• Apollo.com
  • Login
  • Register Now
light site-logo
  • The Academy
  • Upcoming Events
        • Upcoming Events

        • 2026 OutlookTuesday, December 16, 2025 • 11:00am ET
  • Learning Center
        • New & UpdatedAlternative Investing Course 2.0

        • Alternative Investing Essentials Part OnePrivate Equity, Venture Capital, Private Credit
        • Alternative Investing Essentials Part TwoReal Estate, Infrastructure, Digital Assets, Hedge Funds
        • Practical ConsiderationsAsset Allocation, Risk Considerations, Fund Structures, Fees
        • Introductory Videos

          View All Videos

        •  Recent Classes & Videos

        • • Private Equity’s Edge: Delivering Alpha in a Changing Market
        • • Powering Innovation: Infrastructure Investing Across the AI Value Chain
        • • Mid-Year Outlook: At the Crossroads of Stagflation — What’s Next?
        • • Hybrid Investments: Flexible Structures for Volatile Times
        • • Private Credit Investing in Volatile Times
        • • Potential Implications of the Latest US Administration Policy Proposals
        • View All Classes

  • Alternative Perspectives
        • Investment Knowledge
        • The View from Apollo
          • Investment Knowledge White Papers

            The Financing Gap in Sports: Unlocking a $2.5 Trillion Opportunity

            December 12, 2025
          • The View From Apollo

            Private Equity: Alpha in an Evolving Market

            November 24, 2025
          • Investment Knowledge

            Hybrid in Action: Delivering Bespoke Capital Solutions in a New Market Paradigm

            December 4, 2025
  • The Daily Spark
        • Read The Daily Spark Blog


        • Want it delivered daily to your inbox?
          • The Daily Spark

            Strong Technical Demand for Credit

            December 15, 2025
          • The Daily Spark

            Fiscal Situation in Germany vs. Spain

            December 14, 2025
          • The Daily Spark

            Hedge Fund Leverage Rising Rapidly

            December 13, 2025
  • Register for Apollo Academy: Alternative Investing Course
  • Login
  • About Apollo Academy
  • Upcoming Events
  • Learning Center
  • Alternative Perspectives
  • The Daily Spark
  • Register for Apollo Academy: Alternative Investing Course
  • Login
  • 2026 Outlook
  • Alternative Investing Course 2.0
  • Private Equity’s Edge: Delivering Alpha in a Changing Market
  • Powering Innovation: Infrastructure Investing Across the AI Value Chain
  • Mid-Year Outlook: At the Crossroads of Stagflation — What’s Next?
  • Hybrid Investments: Flexible Structures for Volatile Times
  • Private Credit Investing in Volatile Times
  • Potential Implications of the Latest US Administration Policy Proposals
  • View All Classes
  • Introductory Videos
  • Alternative Investing Essentials Part One • Now Available On Demand
  • Alternative Investing Essentials Part Two • Now Available On Demand
  • Practical Considerations • Now Available On Demand
  • Investment Knowledge
  • The View from Apollo
Home May 2024

Credit Market Outlook

Our monthly credit market chart book is available here.

Download high-res chart(s)

Recent Posts

  • Strong Technical Demand for Credit
  • Fiscal Situation in Germany vs. Spain
  • Hedge Fund Leverage Rising Rapidly
  • The Financing Gap in Sports: Unlocking a $2.5 Trillion Opportunity
  • The US Retirement Crisis

Recent Comments

No comments to show.

Archives

  • December 2025
  • November 2025
  • October 2025
  • September 2025
  • August 2025
  • July 2025
  • June 2025
  • May 2025
  • April 2025
  • March 2025
  • February 2025
  • January 2025
  • December 2024
  • November 2024
  • October 2024
  • September 2024
  • August 2024
  • July 2024
  • June 2024
  • May 2024
  • April 2024
  • March 2024
  • February 2024
  • January 2024
  • December 2023
  • November 2023
  • October 2023
  • September 2023
  • August 2023
  • July 2023
  • June 2023
  • May 2023
  • April 2023
  • March 2023
  • February 2023
  • January 2023
  • December 2022
  • November 2022
  • October 2022
  • September 2022
  • August 2022
  • July 2022
  • June 2022
  • May 2022
  • April 2022
  • March 2022
  • February 2022
  • January 2022
  • December 2021
  • November 2021

Categories

  • Apollo Answers
  • Course Introductions
  • Economic Intelligence
  • Hide from Wordpress Search
  • Investment Knowledge
  • Perspectives
  • Redirecting
  • The Daily Spark
  • The View from Apollo
  • The Weekly Brief
  • Uncategorized
  • White Papers

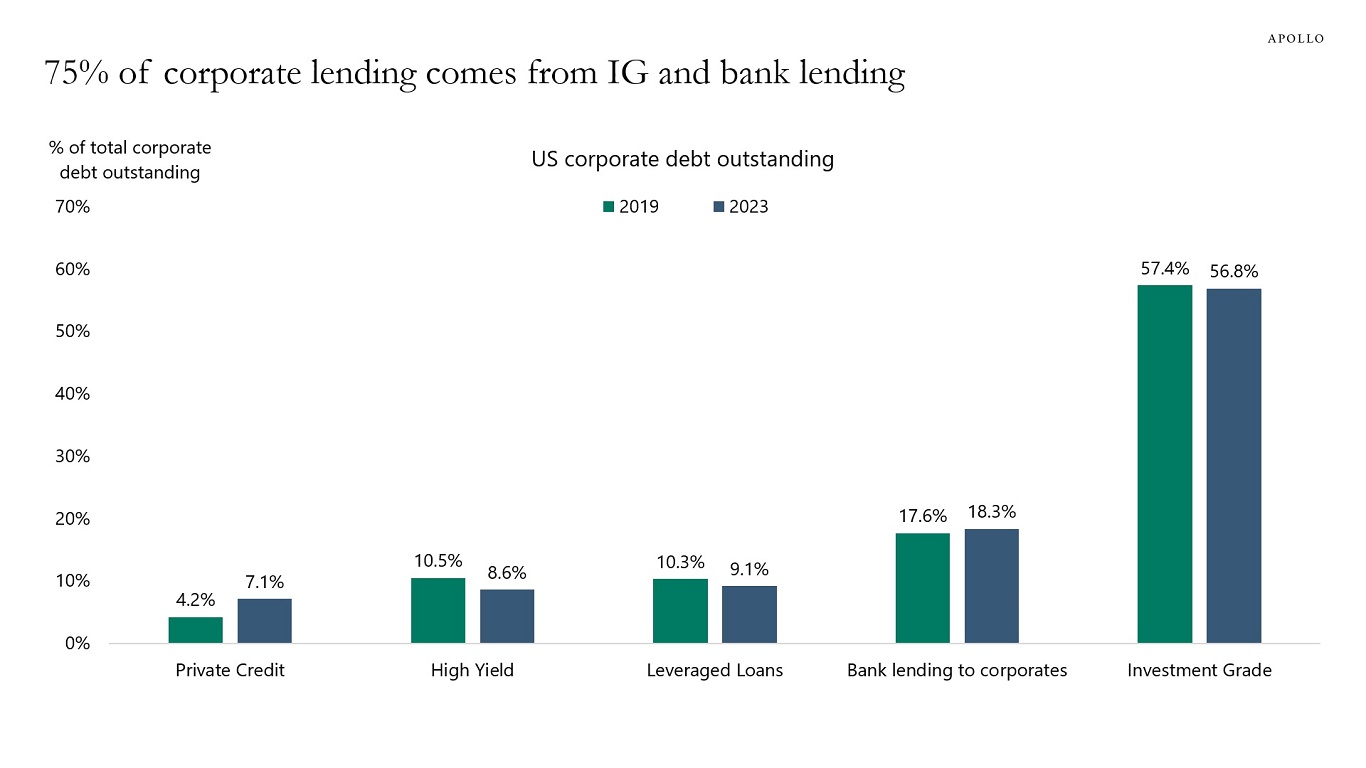
The Benefits of Having More Sources of Financing Available

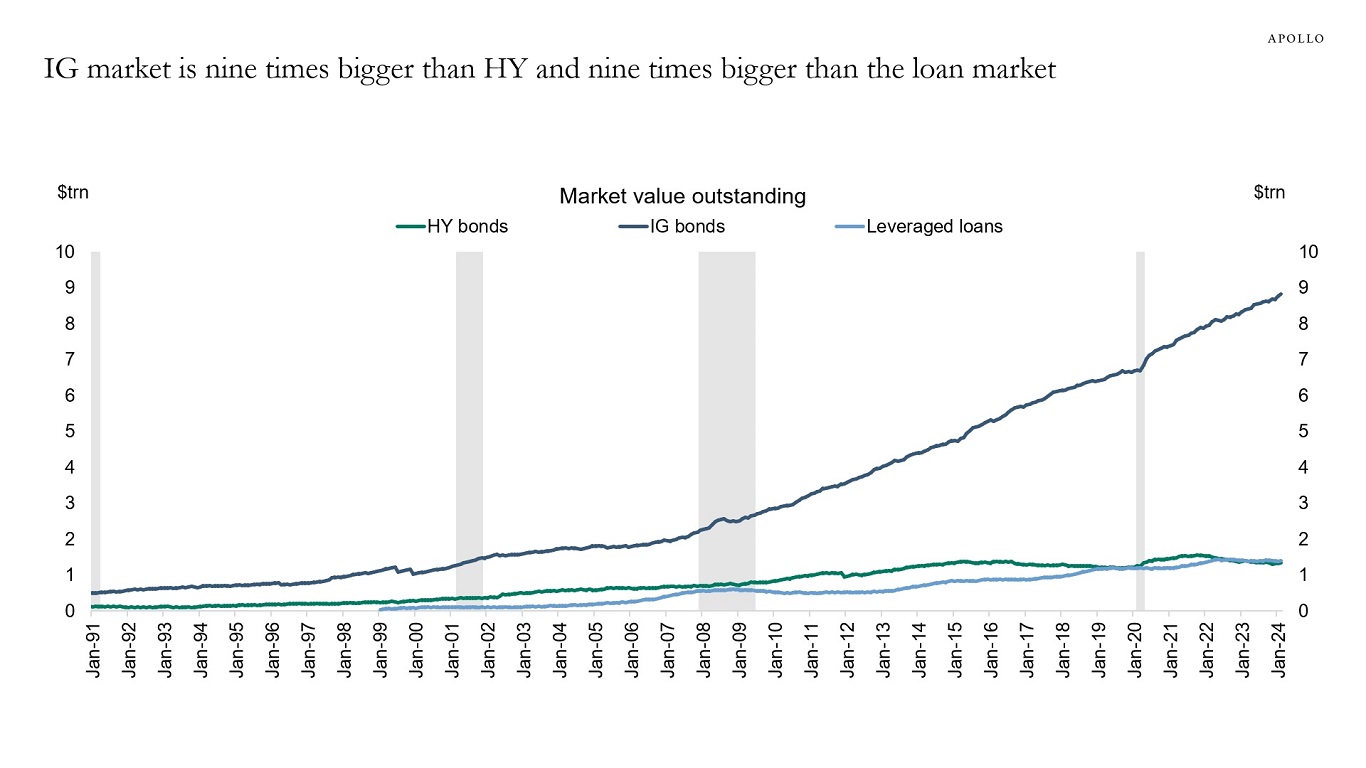
The rising market share of private credit is not coming from banks, it is coming from investment grade markets, high yield markets, and leveraged loan markets, see chart below.

A financial system with more sources of financing for firms has two macroeconomic benefits.

First, the more choices firms have when they need financing, the better. A more diversified financial system with competition between credit providers is better for economic growth, particularly when some players, such as banks, have high leverage and uncertainty about deposits as their source of financing.

Second, having different types of financing available creates more financial stability as more participants can stabilize the financial system and provide credit or buy equity in case of a sudden change in sentiment in financial markets or the economy.

The bottom line is that:

1) The growth in private credit is giving firms in need of financing more choice and thereby boosting long-run growth, and

2) The growth in private markets is improving financial stability with more capital willing to step in when there is distress.

For more discussion see also this OECD working paper and this IMF working paper.

75% of corporate lending comes from IG and bank lending
Source: Preqin, ICE BofA, FRB, PitchBook LCD, Apollo Chief Economist

Download high-res chart(s)

Recent Posts

  • Strong Technical Demand for Credit
  • Fiscal Situation in Germany vs. Spain
  • Hedge Fund Leverage Rising Rapidly
  • The Financing Gap in Sports: Unlocking a $2.5 Trillion Opportunity
  • The US Retirement Crisis

Recent Comments

No comments to show.

Archives

  • December 2025
  • November 2025
  • October 2025
  • September 2025
  • August 2025
  • July 2025
  • June 2025
  • May 2025
  • April 2025
  • March 2025
  • February 2025
  • January 2025
  • December 2024
  • November 2024
  • October 2024
  • September 2024
  • August 2024
  • July 2024
  • June 2024
  • May 2024
  • April 2024
  • March 2024
  • February 2024
  • January 2024
  • December 2023
  • November 2023
  • October 2023
  • September 2023
  • August 2023
  • July 2023
  • June 2023
  • May 2023
  • April 2023
  • March 2023
  • February 2023
  • January 2023
  • December 2022
  • November 2022
  • October 2022
  • September 2022
  • August 2022
  • July 2022
  • June 2022
  • May 2022
  • April 2022
  • March 2022
  • February 2022
  • January 2022
  • December 2021
  • November 2021

Categories

  • Apollo Answers
  • Course Introductions
  • Economic Intelligence
  • Hide from Wordpress Search
  • Investment Knowledge
  • Perspectives
  • Redirecting
  • The Daily Spark
  • The View from Apollo
  • The Weekly Brief
  • Uncategorized
  • White Papers

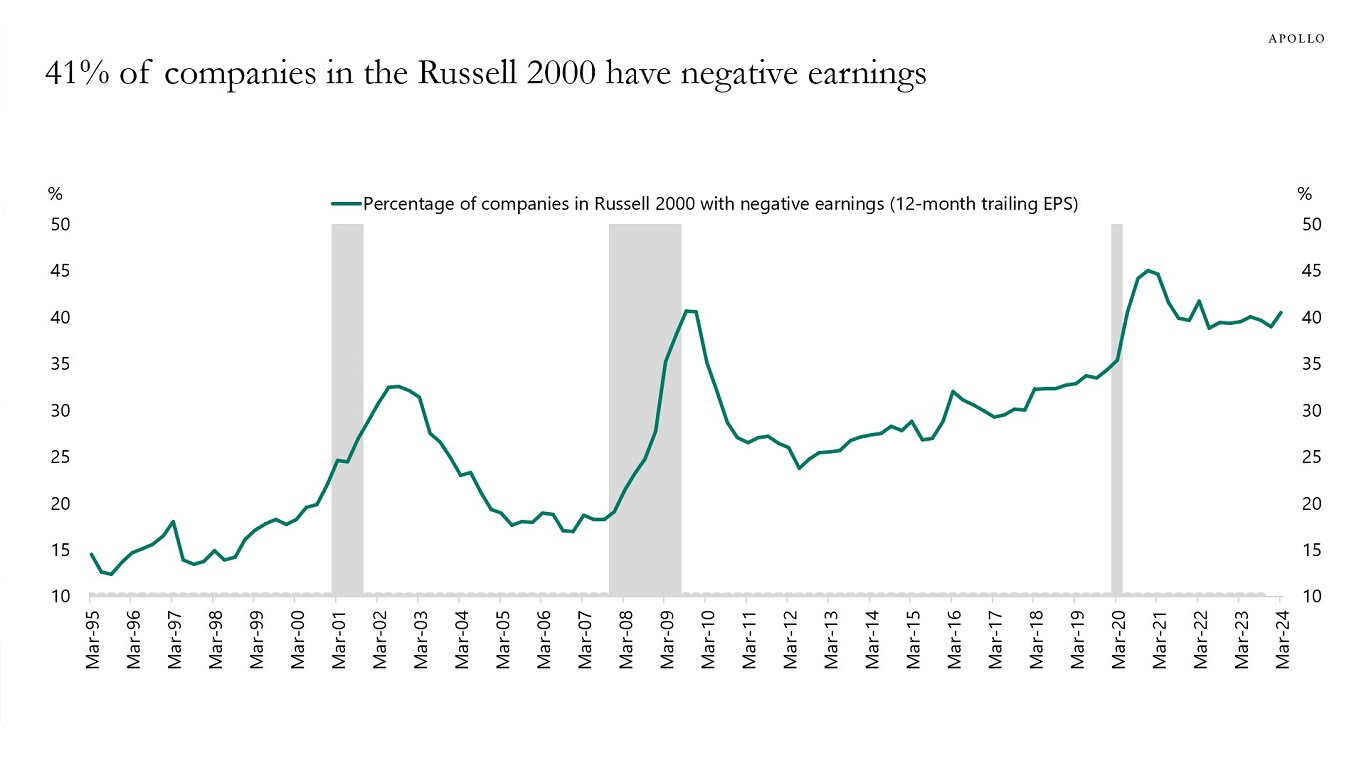
Middle-Market Firms Hit Harder by Fed Hikes

Forty-one percent of companies in the Russell 2000 have negative earnings, see the first chart.

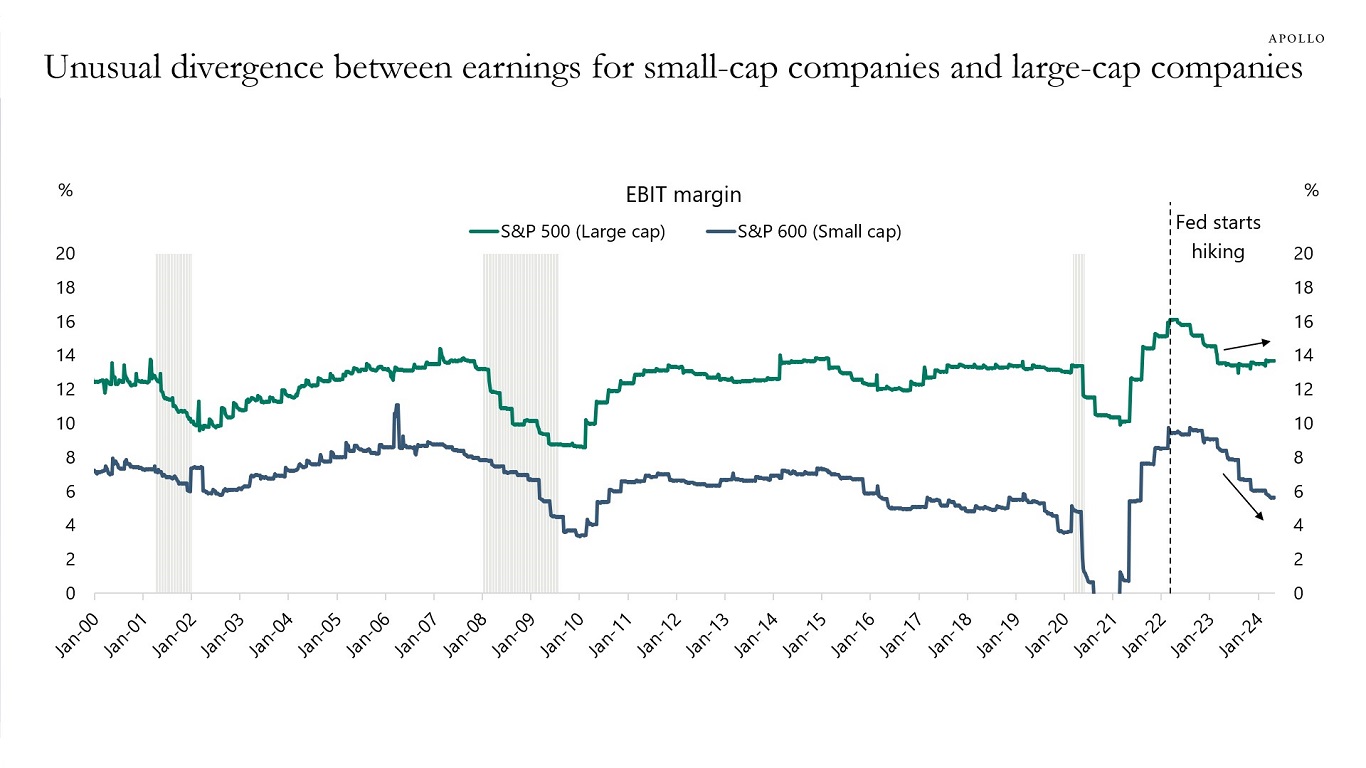
With this backdrop, it is unsurprising that Fed hikes have a more negative impact on small-cap and middle-market companies than on large-cap companies, see the second chart.

The negative impact can be felt in particular in tech, enterprise software, venture capital, and similar firms with no earnings and no revenue.

41% of companies in the Russell 2000 have negative earnings
Source: Bloomberg, Apollo Chief Economist
Unusual divergence between earnings for small-cap companies and large-cap companies
Source: Bloomberg, Apollo Chief Economist

Download high-res chart(s)

Recent Posts

  • Strong Technical Demand for Credit
  • Fiscal Situation in Germany vs. Spain
  • Hedge Fund Leverage Rising Rapidly
  • The Financing Gap in Sports: Unlocking a $2.5 Trillion Opportunity
  • The US Retirement Crisis

Recent Comments

No comments to show.

Archives

  • December 2025
  • November 2025
  • October 2025
  • September 2025
  • August 2025
  • July 2025
  • June 2025
  • May 2025
  • April 2025
  • March 2025
  • February 2025
  • January 2025
  • December 2024
  • November 2024
  • October 2024
  • September 2024
  • August 2024
  • July 2024
  • June 2024
  • May 2024
  • April 2024
  • March 2024
  • February 2024
  • January 2024
  • December 2023
  • November 2023
  • October 2023
  • September 2023
  • August 2023
  • July 2023
  • June 2023
  • May 2023
  • April 2023
  • March 2023
  • February 2023
  • January 2023
  • December 2022
  • November 2022
  • October 2022
  • September 2022
  • August 2022
  • July 2022
  • June 2022
  • May 2022
  • April 2022
  • March 2022
  • February 2022
  • January 2022
  • December 2021
  • November 2021

Categories

  • Apollo Answers
  • Course Introductions
  • Economic Intelligence
  • Hide from Wordpress Search
  • Investment Knowledge
  • Perspectives
  • Redirecting
  • The Daily Spark
  • The View from Apollo
  • The Weekly Brief
  • Uncategorized
  • White Papers

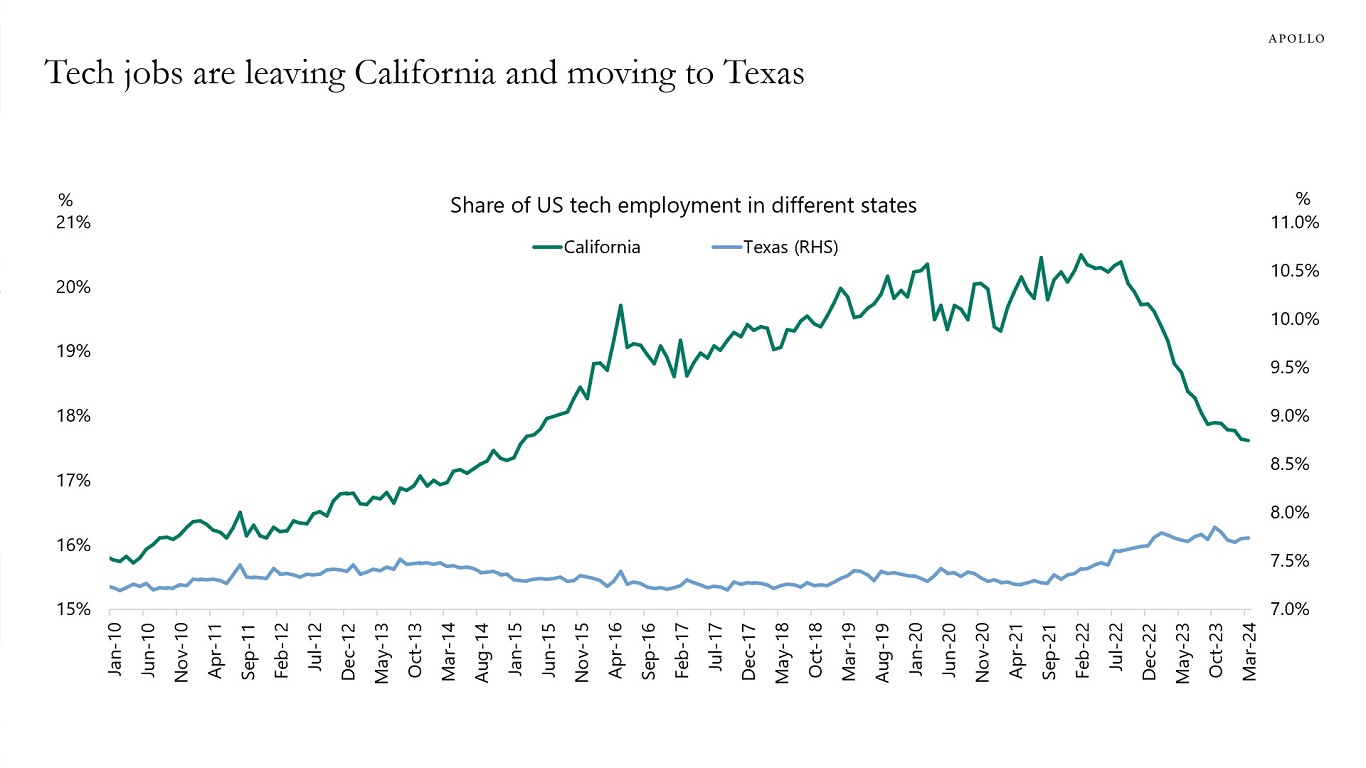
Tech Jobs Leaving California

The share of tech jobs in California has been declining and the share of tech jobs in Texas has been rising, see chart below.

Tech jobs are leaving California and moving to Texas
Source: BLS, Haver Analytics, Apollo Chief Economist. Note: Tech includes telecommunication, data processing, hosting and related services and other IT services, publishing industries, motion picture and sound recording industries, and broadcasting.

Download high-res chart(s)

Recent Posts

  • Strong Technical Demand for Credit
  • Fiscal Situation in Germany vs. Spain
  • Hedge Fund Leverage Rising Rapidly
  • The Financing Gap in Sports: Unlocking a $2.5 Trillion Opportunity
  • The US Retirement Crisis

Recent Comments

No comments to show.

Archives

  • December 2025
  • November 2025
  • October 2025
  • September 2025
  • August 2025
  • July 2025
  • June 2025
  • May 2025
  • April 2025
  • March 2025
  • February 2025
  • January 2025
  • December 2024
  • November 2024
  • October 2024
  • September 2024
  • August 2024
  • July 2024
  • June 2024
  • May 2024
  • April 2024
  • March 2024
  • February 2024
  • January 2024
  • December 2023
  • November 2023
  • October 2023
  • September 2023
  • August 2023
  • July 2023
  • June 2023
  • May 2023
  • April 2023
  • March 2023
  • February 2023
  • January 2023
  • December 2022
  • November 2022
  • October 2022
  • September 2022
  • August 2022
  • July 2022
  • June 2022
  • May 2022
  • April 2022
  • March 2022
  • February 2022
  • January 2022
  • December 2021
  • November 2021

Categories

  • Apollo Answers
  • Course Introductions
  • Economic Intelligence
  • Hide from Wordpress Search
  • Investment Knowledge
  • Perspectives
  • Redirecting
  • The Daily Spark
  • The View from Apollo
  • The Weekly Brief
  • Uncategorized
  • White Papers

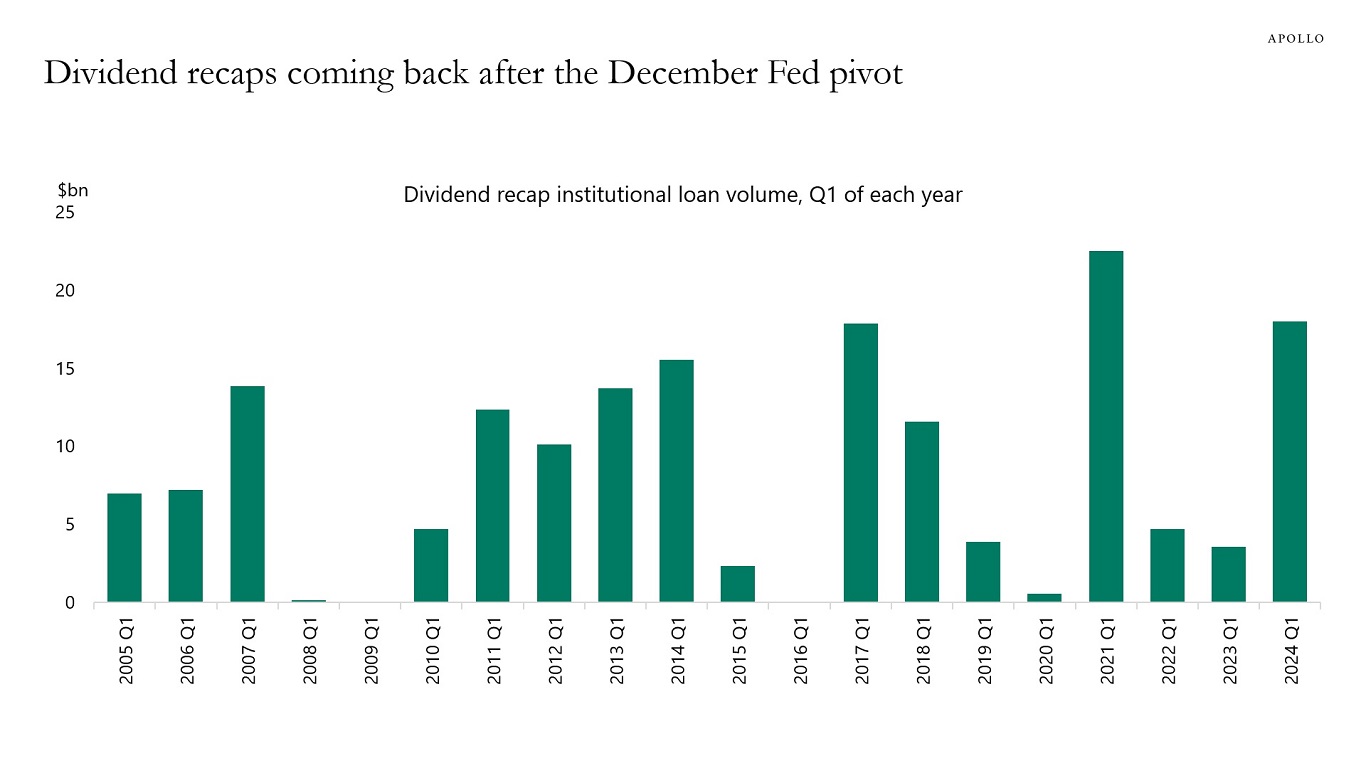
Dividend Recaps Coming Back

The December Fed pivot triggered a boom in dividend recaps, see chart below.

Dividend recaps coming back after the December Fed pivot
Source: PitchBook LCD, Apollo Chief Economist

Download high-res chart(s)

Recent Posts

  • Strong Technical Demand for Credit
  • Fiscal Situation in Germany vs. Spain
  • Hedge Fund Leverage Rising Rapidly
  • The Financing Gap in Sports: Unlocking a $2.5 Trillion Opportunity
  • The US Retirement Crisis

Recent Comments

No comments to show.

Archives

  • December 2025
  • November 2025
  • October 2025
  • September 2025
  • August 2025
  • July 2025
  • June 2025
  • May 2025
  • April 2025
  • March 2025
  • February 2025
  • January 2025
  • December 2024
  • November 2024
  • October 2024
  • September 2024
  • August 2024
  • July 2024
  • June 2024
  • May 2024
  • April 2024
  • March 2024
  • February 2024
  • January 2024
  • December 2023
  • November 2023
  • October 2023
  • September 2023
  • August 2023
  • July 2023
  • June 2023
  • May 2023
  • April 2023
  • March 2023
  • February 2023
  • January 2023
  • December 2022
  • November 2022
  • October 2022
  • September 2022
  • August 2022
  • July 2022
  • June 2022
  • May 2022
  • April 2022
  • March 2022
  • February 2022
  • January 2022
  • December 2021
  • November 2021

Categories

  • Apollo Answers
  • Course Introductions
  • Economic Intelligence
  • Hide from Wordpress Search
  • Investment Knowledge
  • Perspectives
  • Redirecting
  • The Daily Spark
  • The View from Apollo
  • The Weekly Brief
  • Uncategorized
  • White Papers

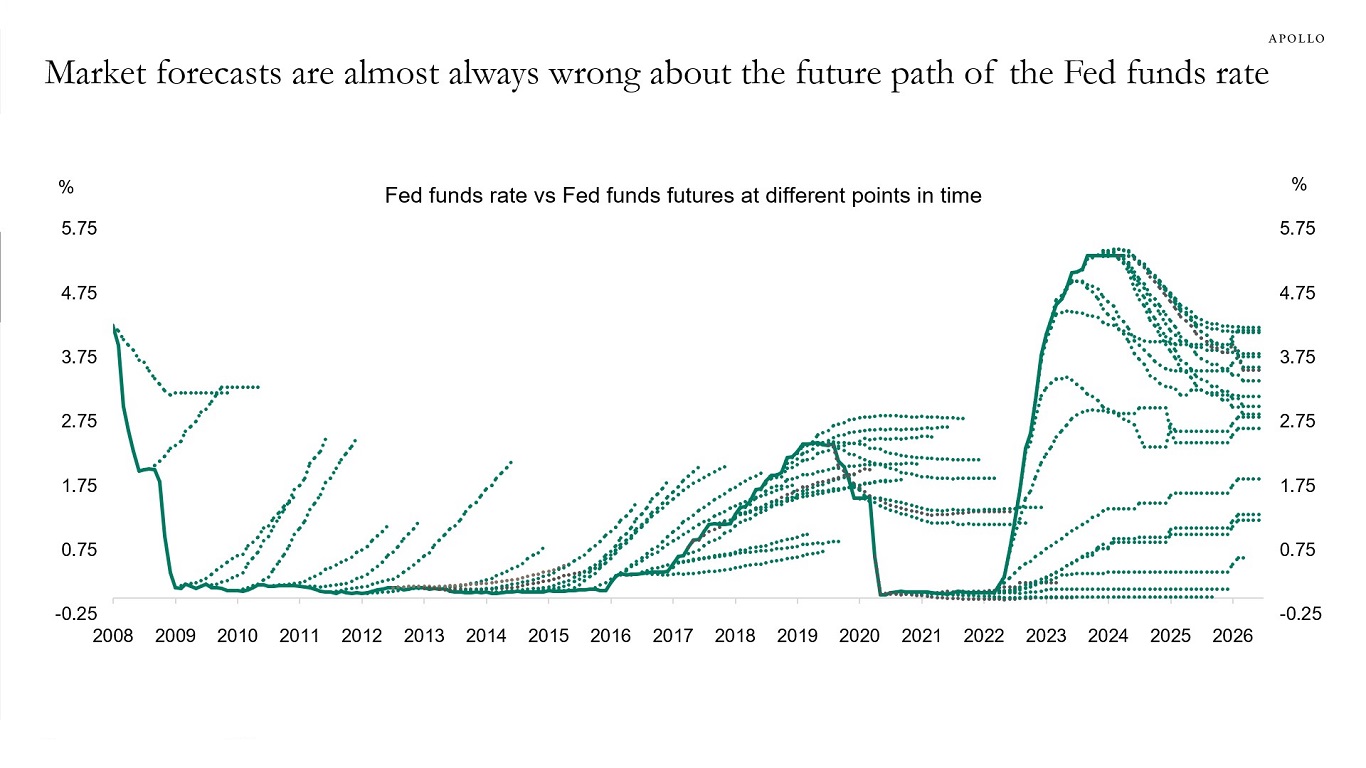
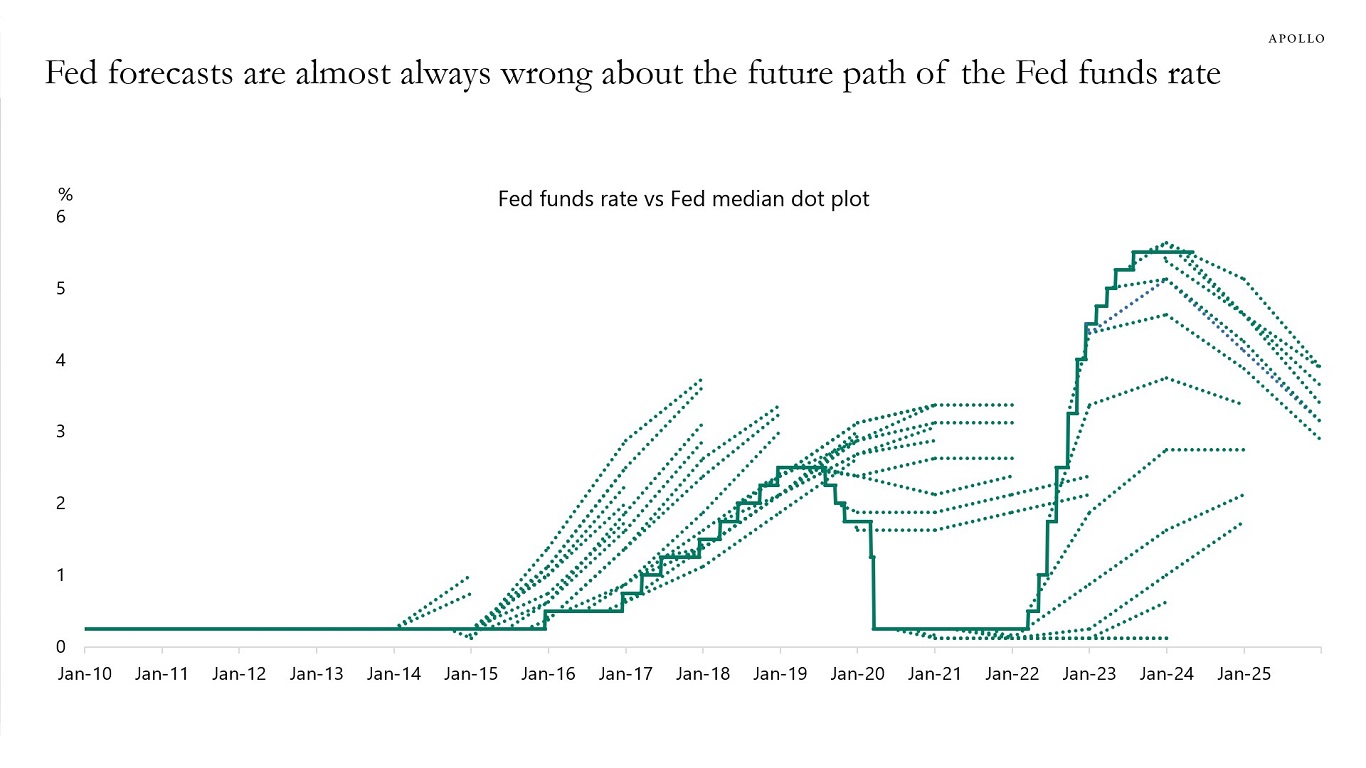
The Forecasting Record of the Fed and the Market

The Fed started publishing the dot plot in 2012, and comparing the Fed’s forecasts with the forecasts from Fed funds futures yields three important conclusions, see charts below:

1) The Fed’s and the market’s forecasts about the future path of the Fed funds rate are almost always wrong.

2) The forecasts are very similar, and the Fed has managed to anchor market expectations about where it thinks the Fed funds rate is going.

3) The direction of the forecasting mistake is always identical, suggesting that the market is taking its cue about the future path of interest rates from the Fed’s dot plot.

The good news is that the Fed is able to anchor market expectations, and thereby reduce volatility in financial markets. 

The bad news is that when the Fed’s forecast is wrong and the FOMC has to move from three cuts in 2024 to say, one cut, it will hurt Fed credibility.

The US economy’s lower interest-rate sensitivity, combined with strong structural and cyclical tailwinds to growth, brings us to the conclusion that the Fed will not cut interest rates in 2024.

Market forecasts are almost always wrong about the future path of the Fed funds rate
Source: Bloomberg, Apollo Chief Economist
Fed forecasts are almost always wrong about the future path of the Fed funds rate
Source: FOMC, Bloomberg, Apollo Chief Economist

Download high-res chart(s)

Recent Posts

  • Strong Technical Demand for Credit
  • Fiscal Situation in Germany vs. Spain
  • Hedge Fund Leverage Rising Rapidly
  • The Financing Gap in Sports: Unlocking a $2.5 Trillion Opportunity
  • The US Retirement Crisis

Recent Comments

No comments to show.

Archives

  • December 2025
  • November 2025
  • October 2025
  • September 2025
  • August 2025
  • July 2025
  • June 2025
  • May 2025
  • April 2025
  • March 2025
  • February 2025
  • January 2025
  • December 2024
  • November 2024
  • October 2024
  • September 2024
  • August 2024
  • July 2024
  • June 2024
  • May 2024
  • April 2024
  • March 2024
  • February 2024
  • January 2024
  • December 2023
  • November 2023
  • October 2023
  • September 2023
  • August 2023
  • July 2023
  • June 2023
  • May 2023
  • April 2023
  • March 2023
  • February 2023
  • January 2023
  • December 2022
  • November 2022
  • October 2022
  • September 2022
  • August 2022
  • July 2022
  • June 2022
  • May 2022
  • April 2022
  • March 2022
  • February 2022
  • January 2022
  • December 2021
  • November 2021

Categories

  • Apollo Answers
  • Course Introductions
  • Economic Intelligence
  • Hide from Wordpress Search
  • Investment Knowledge
  • Perspectives
  • Redirecting
  • The Daily Spark
  • The View from Apollo
  • The Weekly Brief
  • Uncategorized
  • White Papers

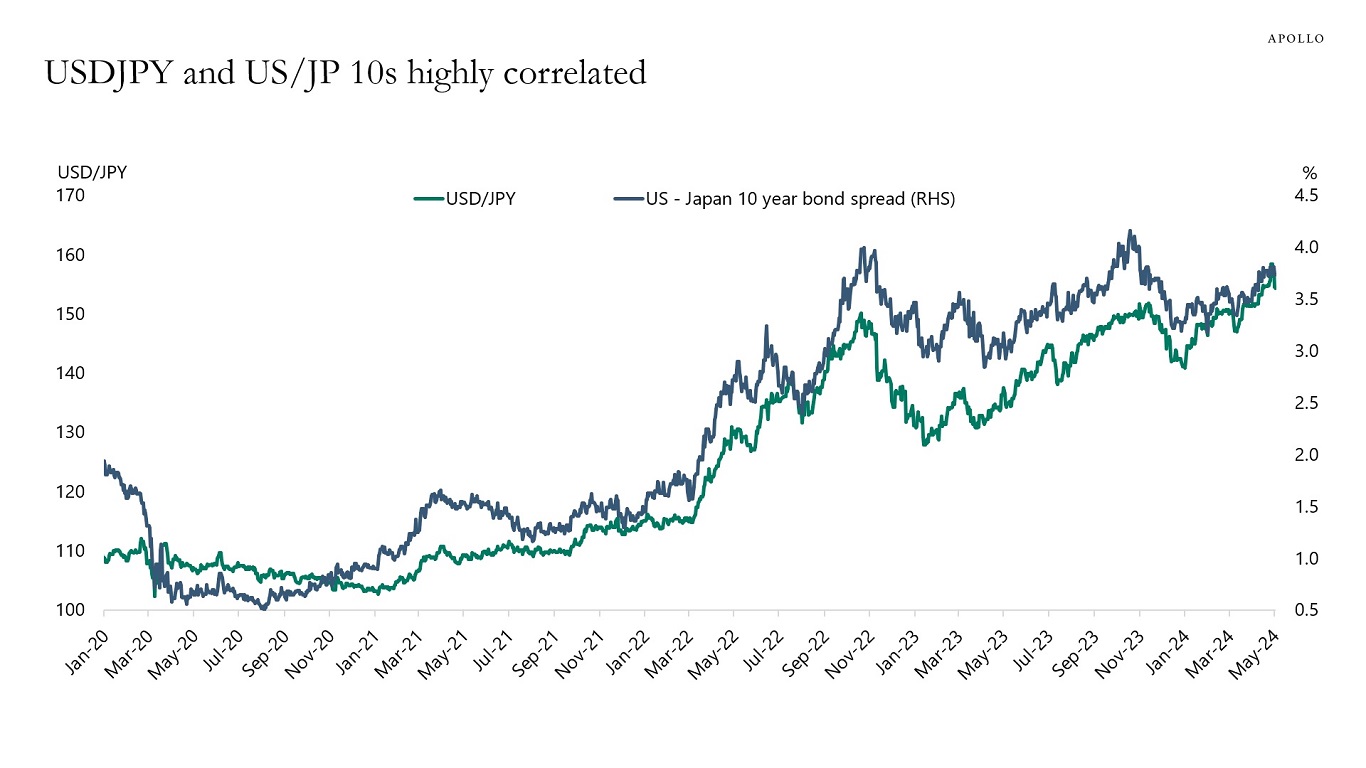
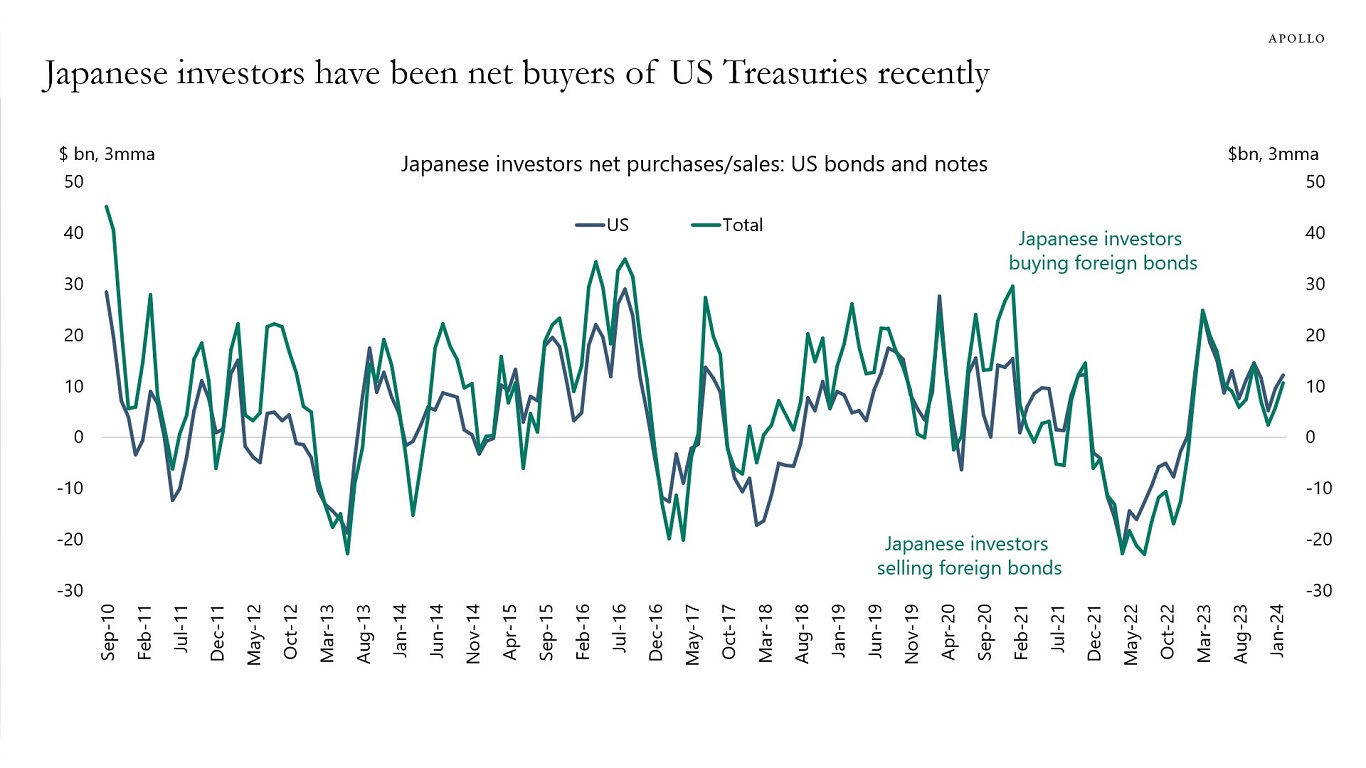
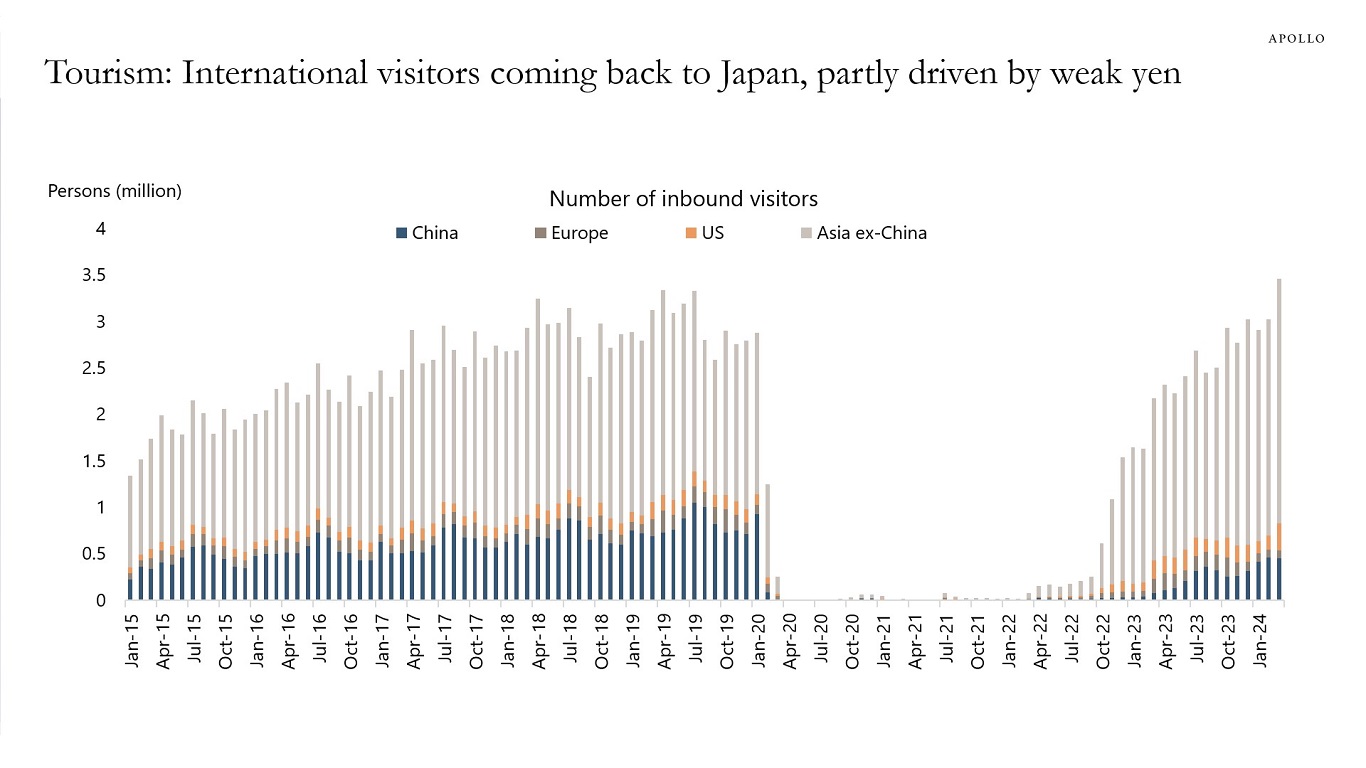
Why Is the Yen Depreciating?

The sources of yen depreciation are the Fed keeping rates higher for longer, the BoJ keeping rates lower for longer, and worries about what higher Japanese interest rates mean for fiscal sustainability.

For more, see also our chart book available here.

USDJPY and US/JP 10s highly correlated
Source: Bloomberg, Apollo Chief Economist
Japanese investors have been net buyers of US Treasuries recently
Source: Ministry of Finance Japan, Bloomberg, Apollo Chief Economist
Tourism: International visitors coming back to Japan, partly driven by weak yen
Source: Japan National Tourism Organization, Bloomberg, Apollo Chief Economist

Download high-res chart(s)

Recent Posts

  • Strong Technical Demand for Credit
  • Fiscal Situation in Germany vs. Spain
  • Hedge Fund Leverage Rising Rapidly
  • The Financing Gap in Sports: Unlocking a $2.5 Trillion Opportunity
  • The US Retirement Crisis

Recent Comments

No comments to show.

Archives

  • December 2025
  • November 2025
  • October 2025
  • September 2025
  • August 2025
  • July 2025
  • June 2025
  • May 2025
  • April 2025
  • March 2025
  • February 2025
  • January 2025
  • December 2024
  • November 2024
  • October 2024
  • September 2024
  • August 2024
  • July 2024
  • June 2024
  • May 2024
  • April 2024
  • March 2024
  • February 2024
  • January 2024
  • December 2023
  • November 2023
  • October 2023
  • September 2023
  • August 2023
  • July 2023
  • June 2023
  • May 2023
  • April 2023
  • March 2023
  • February 2023
  • January 2023
  • December 2022
  • November 2022
  • October 2022
  • September 2022
  • August 2022
  • July 2022
  • June 2022
  • May 2022
  • April 2022
  • March 2022
  • February 2022
  • January 2022
  • December 2021
  • November 2021

Categories

  • Apollo Answers
  • Course Introductions
  • Economic Intelligence
  • Hide from Wordpress Search
  • Investment Knowledge
  • Perspectives
  • Redirecting
  • The Daily Spark
  • The View from Apollo
  • The Weekly Brief
  • Uncategorized
  • White Papers

Why Is the Economy Still So Strong?

Why is the economy still so strong?

There are two reasons, lower interest-rate sensitivity and strong demand tailwinds.

Specifically:

A) Lower interest-rate sensitivity:

1) 40% of homeowners don’t have a mortgage, and 95% of mortgages are 30-year fixed that are not sensitive to the Fed raising interest rates.

2) During Covid, most firms termed out their debt at very low levels, and with the IG market having grown from $3 trillion in 2009 to $9 trillion today, see the second chart, the interest-rate sensitivity of corporate America has declined.

3) A growing share of capex spending is intangibles (R&D and software), which generally is less sensitive to Fed hikes.

B) Strong cyclical and structural demand tailwinds:

1) Fiscal spending, including the CHIPS Act, Inflation Reduction Act, and Infrastructure Act, is still a strong tailwind to growth.

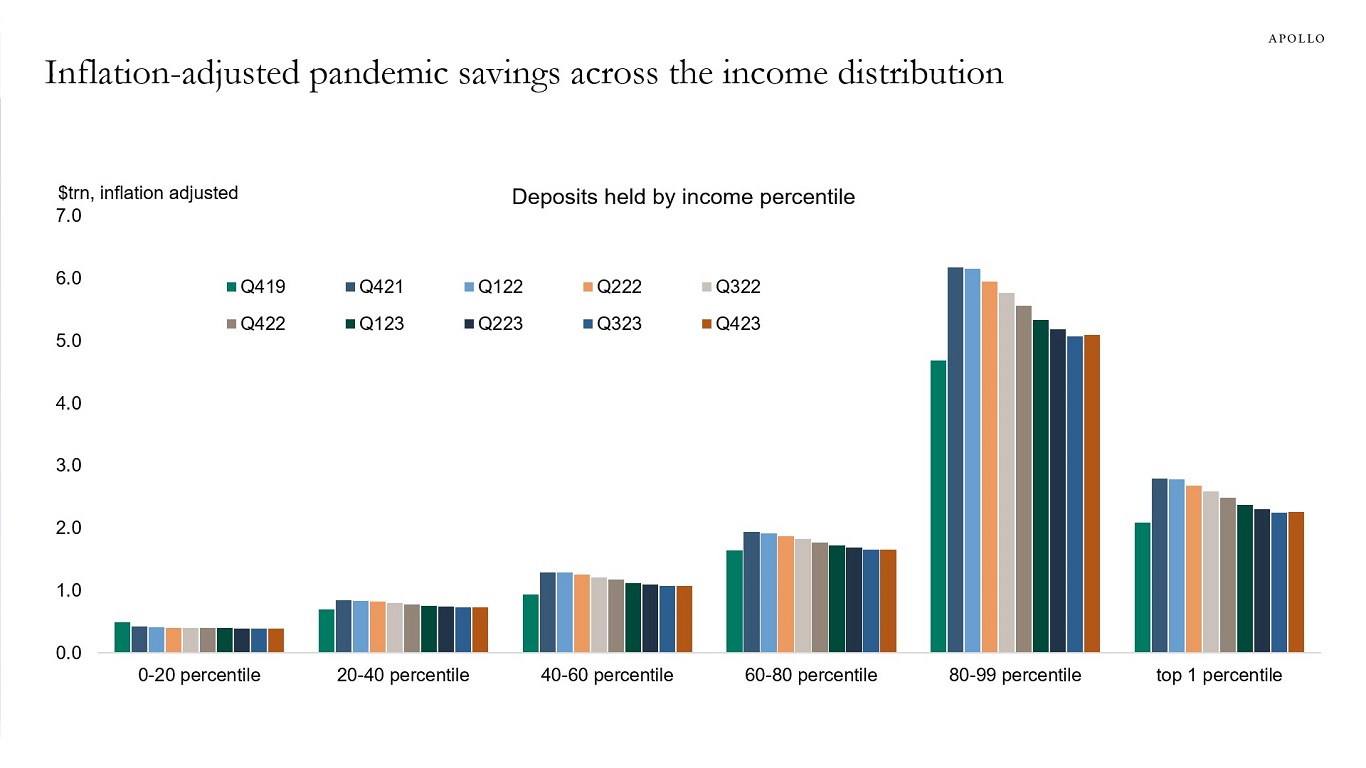
2) Excess savings have recently started to rise again for higher income households, see the third chart.

3) Immigration has been unusually strong, supporting overall employment growth.

4) The Fed turning dovish in December 2023 has eased financial conditions significantly, which continues to boost consumer spending and capex spending.

5) Higher interest rates give higher cash flow to households that own fixed-income assets.

6) After 14 years of very low interest rates from 2008 to 2022, the demand for higher all-in yields remains extremely strong from insurance companies, pension funds, and retail investors, which has contributed to easy financial conditions that have been offsetting Fed hikes. The AI story has also boosted household wealth and eased financial conditions.

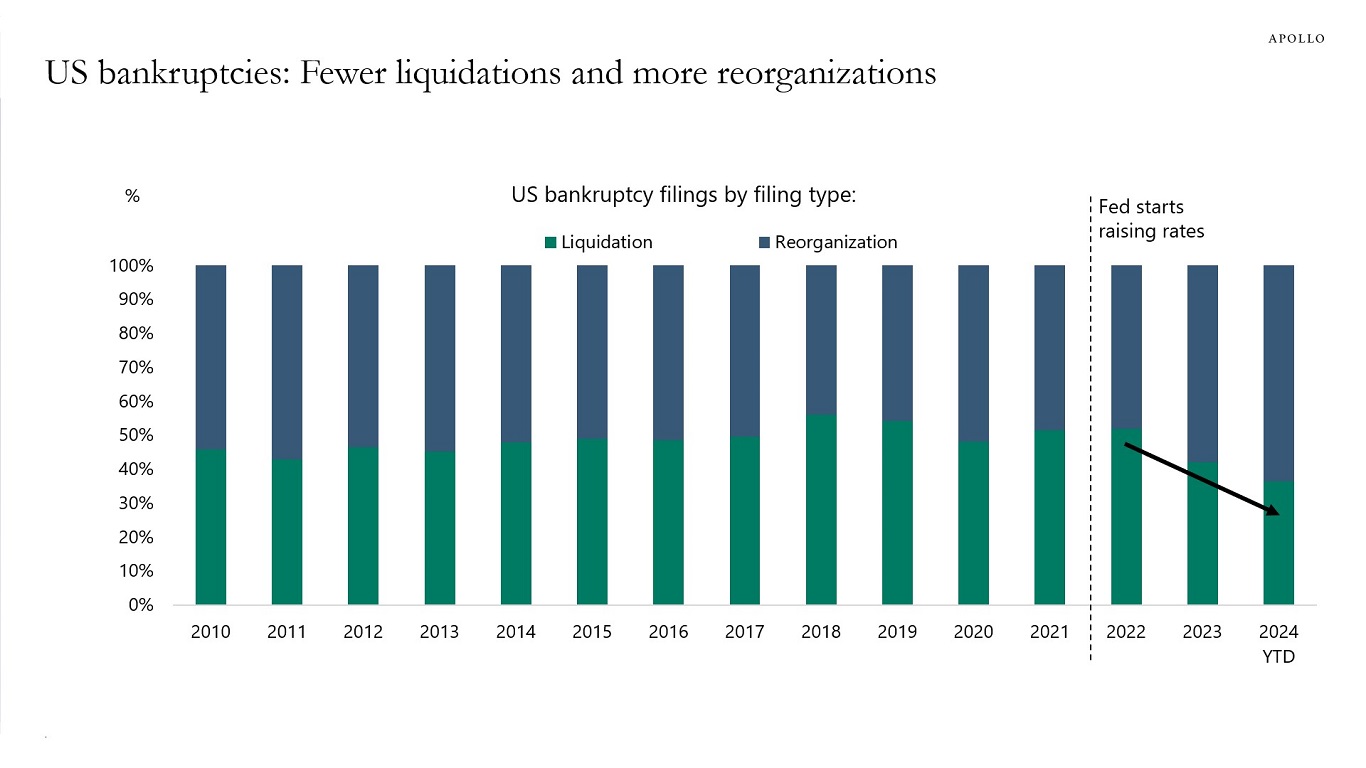
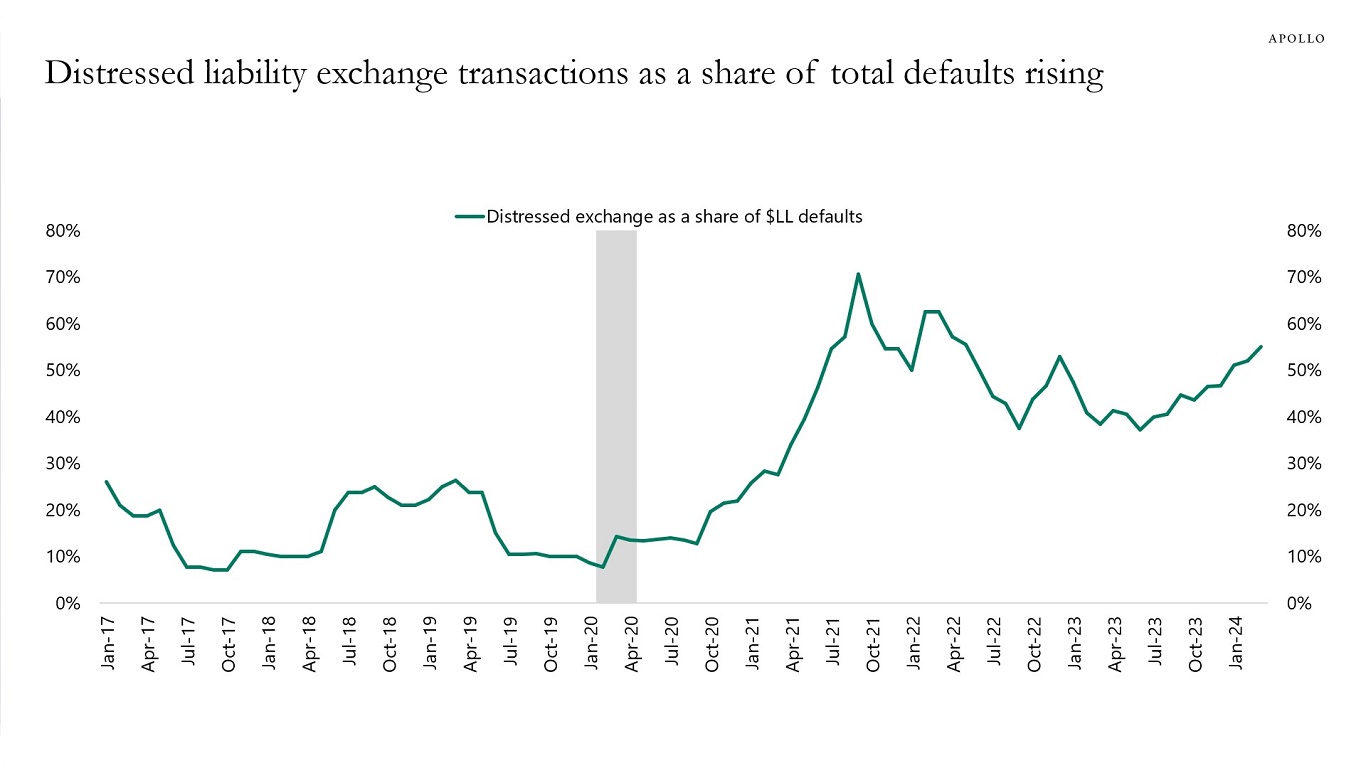
7) Corporates that got into trouble once the Fed started hiking have not been liquidating their assets but instead doing reorganizations and distressed exchanges, and this has kept many firms alive that would otherwise have gone out of business, see the fourth and fifth charts.

In summary, the economy is strong for two reasons:

A) Consumers and firms locked in low interest rates during Covid, which made the economy less sensitive to higher interest rates (i.e., bullet points No. 1 to 3 above), and

B) Strong demand tailwinds coming from fiscal, excess savings, immigration, and easy financial conditions (i.e., bullet points No. 1 to 7 above).

With this backdrop, it is not surprising that inflation and labor costs remain high, and these 10 forces will keep the economy strong for at least several more quarters. 

Eventually, the Fed will get inflation back to 2%, but it is increasingly clear that it will require a meaningful slowdown in the labor market and the housing market.

In short, GDP and earnings should remain strong for the rest of 2024.

Weekly data for same-store retail sales still strong
Source: Redbook, Bloomberg, Apollo Chief Economist
IG market is nine times bigger than HY and nine times bigger than the loan market
Source: ICE BofA, Bloomberg, Pitchbook LCD, Apollo Chief Economist. Note: Ticker used for HY is H0A0 Index and for IG it is C0A0 Index, and for Loans it is SPBDALB Index.
Inflation-adjusted pandemic savings across the income distribution
Source: FRB, Haver Analytics, Apollo Chief Economist
US bankruptcies: Fewer liquidations and more reorganizations
Source: S&P Capital IQ, Apollo Chief Economist. Note: Data till March 14, 2024. Bankruptcy figures include public companies or private companies with public debt with a minimum of $2 million in assets or liabilities at the time of filing, in addition to private companies with at least $10 million in assets or liabilities. Chapter 11 liquidation and Chapter 7 bankruptcy filings are categorized as liquidation, and other Chapter 11 bankruptcy filings as reorganization.
Distressed liability exchange transactions as a share of total defaults rising
Source: S&P, LCD Pitchbook, Apollo Chief Economist

Download high-res chart(s)

Recent Posts

  • Strong Technical Demand for Credit
  • Fiscal Situation in Germany vs. Spain
  • Hedge Fund Leverage Rising Rapidly
  • The Financing Gap in Sports: Unlocking a $2.5 Trillion Opportunity
  • The US Retirement Crisis

Recent Comments

No comments to show.

Archives

  • December 2025
  • November 2025
  • October 2025
  • September 2025
  • August 2025
  • July 2025
  • June 2025
  • May 2025
  • April 2025
  • March 2025
  • February 2025
  • January 2025
  • December 2024
  • November 2024
  • October 2024
  • September 2024
  • August 2024
  • July 2024
  • June 2024
  • May 2024
  • April 2024
  • March 2024
  • February 2024
  • January 2024
  • December 2023
  • November 2023
  • October 2023
  • September 2023
  • August 2023
  • July 2023
  • June 2023
  • May 2023
  • April 2023
  • March 2023
  • February 2023
  • January 2023
  • December 2022
  • November 2022
  • October 2022
  • September 2022
  • August 2022
  • July 2022
  • June 2022
  • May 2022
  • April 2022
  • March 2022
  • February 2022
  • January 2022
  • December 2021
  • November 2021

Categories

  • Apollo Answers
  • Course Introductions
  • Economic Intelligence
  • Hide from Wordpress Search
  • Investment Knowledge
  • Perspectives
  • Redirecting
  • The Daily Spark
  • The View from Apollo
  • The Weekly Brief
  • Uncategorized
  • White Papers

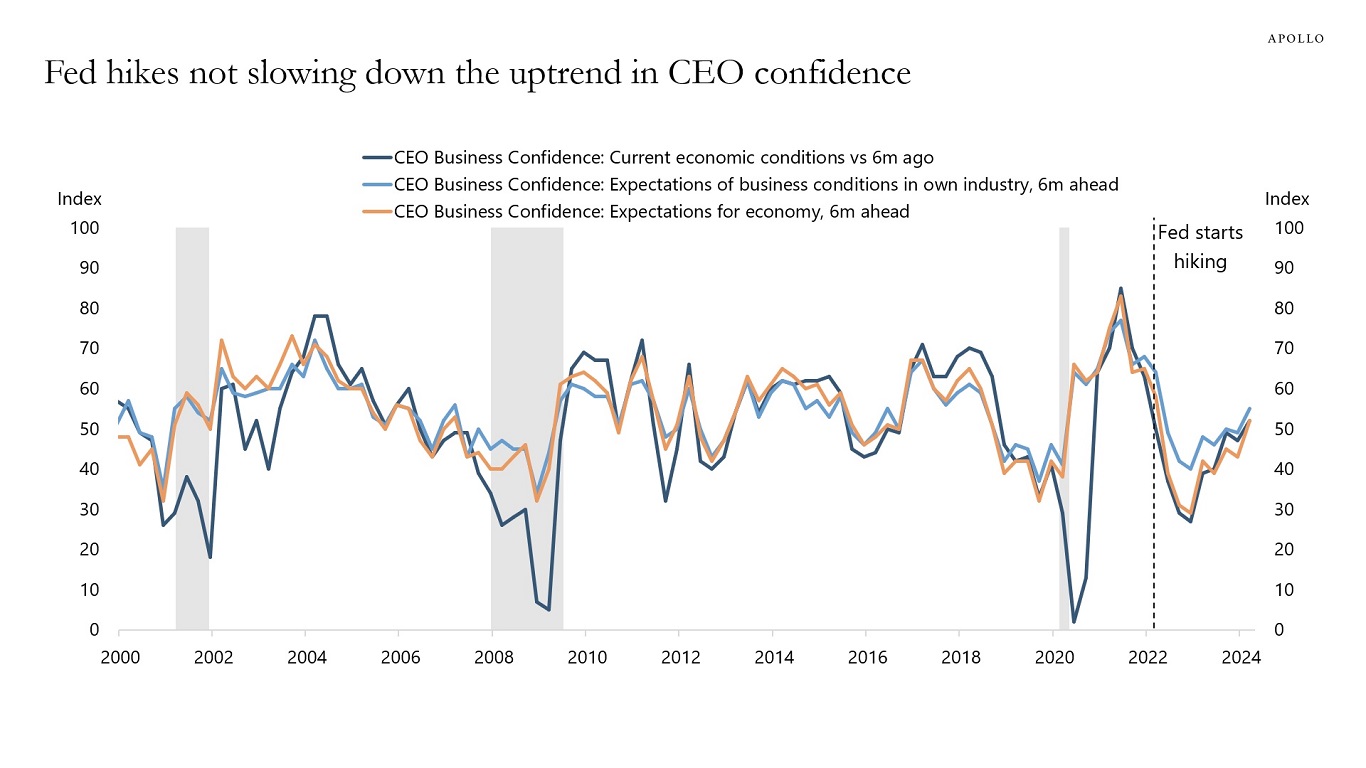
CEOs Are More and More Bullish Despite Fed Hikes

CEO confidence continues to rebound, and there are no signs of Fed hikes weighing on how CEOs view current conditions, future business conditions, and expectations to the economy, see chart below.

In short, CEOs are becoming increasingly bullish on the outlook for their businesses and the economy. This suggests that r-star may be higher than the Fed currently thinks.

Fed hikes not slowing down the uptrend in CEO confidence
Source: Conference Board, Haver Analytics, Apollo Chief Economist

Download high-res chart(s)

Recent Posts

  • Strong Technical Demand for Credit
  • Fiscal Situation in Germany vs. Spain
  • Hedge Fund Leverage Rising Rapidly
  • The Financing Gap in Sports: Unlocking a $2.5 Trillion Opportunity
  • The US Retirement Crisis

Recent Comments

No comments to show.

Archives

  • December 2025
  • November 2025
  • October 2025
  • September 2025
  • August 2025
  • July 2025
  • June 2025
  • May 2025
  • April 2025
  • March 2025
  • February 2025
  • January 2025
  • December 2024
  • November 2024
  • October 2024
  • September 2024
  • August 2024
  • July 2024
  • June 2024
  • May 2024
  • April 2024
  • March 2024
  • February 2024
  • January 2024
  • December 2023
  • November 2023
  • October 2023
  • September 2023
  • August 2023
  • July 2023
  • June 2023
  • May 2023
  • April 2023
  • March 2023
  • February 2023
  • January 2023
  • December 2022
  • November 2022
  • October 2022
  • September 2022
  • August 2022
  • July 2022
  • June 2022
  • May 2022
  • April 2022
  • March 2022
  • February 2022
  • January 2022
  • December 2021
  • November 2021

Categories

  • Apollo Answers
  • Course Introductions
  • Economic Intelligence
  • Hide from Wordpress Search
  • Investment Knowledge
  • Perspectives
  • Redirecting
  • The Daily Spark
  • The View from Apollo
  • The Weekly Brief
  • Uncategorized
  • White Papers

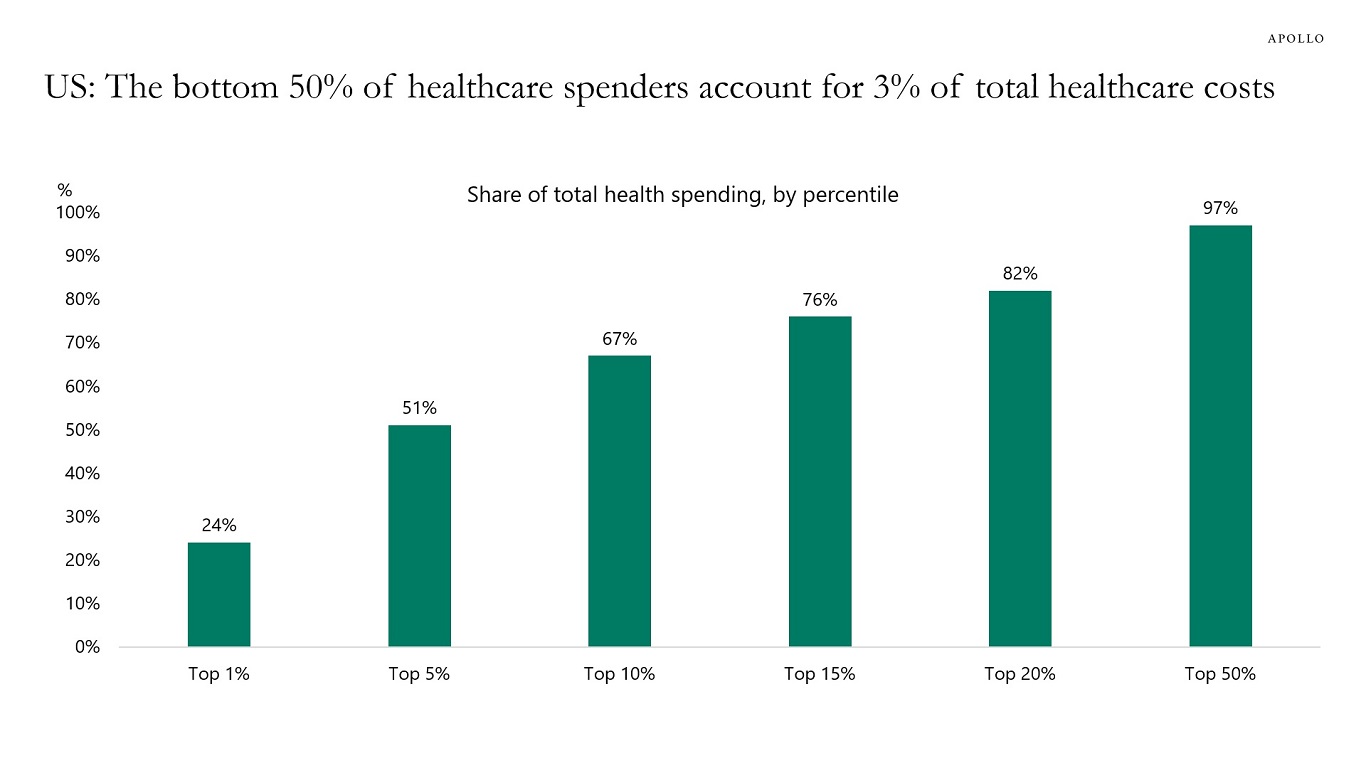
Distribution of Healthcare Costs

The top 5% of healthcare spenders account for 51% of total healthcare spending, see chart below. The bottom 50% account for 3% and their average annual healthcare costs are $385. People with health spending in the top 1% have annual average costs of $166,980.

US: The bottom 50% of healthcare spenders account for 3% of total healthcare costs
Source: Peterson-KFF Health System Tracker, KFF analysis of 2021 Medical Expenditure Panel Survey data, Apollo Chief Economist. Note: Data for 2021.

Download high-res chart(s)

Recent Posts

  • Strong Technical Demand for Credit
  • Fiscal Situation in Germany vs. Spain
  • Hedge Fund Leverage Rising Rapidly
  • The Financing Gap in Sports: Unlocking a $2.5 Trillion Opportunity
  • The US Retirement Crisis

Recent Comments

No comments to show.

Archives

  • December 2025
  • November 2025
  • October 2025
  • September 2025
  • August 2025
  • July 2025
  • June 2025
  • May 2025
  • April 2025
  • March 2025
  • February 2025
  • January 2025
  • December 2024
  • November 2024
  • October 2024
  • September 2024
  • August 2024
  • July 2024
  • June 2024
  • May 2024
  • April 2024
  • March 2024
  • February 2024
  • January 2024
  • December 2023
  • November 2023
  • October 2023
  • September 2023
  • August 2023
  • July 2023
  • June 2023
  • May 2023
  • April 2023
  • March 2023
  • February 2023
  • January 2023
  • December 2022
  • November 2022
  • October 2022
  • September 2022
  • August 2022
  • July 2022
  • June 2022
  • May 2022
  • April 2022
  • March 2022
  • February 2022
  • January 2022
  • December 2021
  • November 2021

Categories

  • Apollo Answers
  • Course Introductions
  • Economic Intelligence
  • Hide from Wordpress Search
  • Investment Knowledge
  • Perspectives
  • Redirecting
  • The Daily Spark
  • The View from Apollo
  • The Weekly Brief
  • Uncategorized
  • White Papers

Posts navigation

←Previous page Page 1 Page 2 Page 3 Page 4 Next page→
  • Privacy Notice
  • Terms of Use
  • Forward-Looking Statements
Apollo
© Apollo Global Management, Inc. All Rights Reserved.

The Apollo Academy is for informational and educational purposes only and nothing contained herein should be taken as investment advice or a recommendation to enter into any transaction. They are not an invitation by or on behalf of Apollo to any person to buy or sell any security or to adopt any investment strategy, and shall not form the basis of, nor may it accompany nor form part of, any right or contract to buy or sell any security or to adopt any investment strategy. There is no guarantee that the views and opinions expressed in this website will come to pass. For additional information, please see the disclaimers included in each piece of content or the legal page of our website here.