• Apollo.com
  • Login
  • Register Now
light site-logo
  • The Academy
  • Upcoming Events
        • Upcoming Events

        • 2026 OutlookTuesday, December 16, 2025 • 11:00am ET
  • Learning Center
        • New & UpdatedAlternative Investing Course 2.0

        • Alternative Investing Essentials Part OnePrivate Equity, Venture Capital, Private Credit
        • Alternative Investing Essentials Part TwoReal Estate, Infrastructure, Digital Assets, Hedge Funds
        • Practical ConsiderationsAsset Allocation, Risk Considerations, Fund Structures, Fees
        • Introductory Videos

          View All Videos

        •  Recent Classes & Videos

        • • Private Equity’s Edge: Delivering Alpha in a Changing Market
        • • Powering Innovation: Infrastructure Investing Across the AI Value Chain
        • • Mid-Year Outlook: At the Crossroads of Stagflation — What’s Next?
        • • Hybrid Investments: Flexible Structures for Volatile Times
        • • Private Credit Investing in Volatile Times
        • • Potential Implications of the Latest US Administration Policy Proposals
        • View All Classes

  • Alternative Perspectives
        • Investment Knowledge
        • The View from Apollo
          • Investment Knowledge

            Hybrid in Action: Delivering Bespoke Capital Solutions in a New Market Paradigm

            December 4, 2025
          • The View From Apollo

            Private Equity: Alpha in an Evolving Market

            November 24, 2025
          • Apollo Answers Investment Knowledge

            Apollo Answers: What’s Missing in Private Credit? Integrating Asset-Backed Finance

            October 27, 2025
  • The Daily Spark
        • Read The Daily Spark Blog


        • Want it delivered daily to your inbox?
          • The Daily Spark

            The Duration Mismatch in the Banking Sector Is a Risk to Financial Stability

            December 6, 2025
          • The Daily Spark

            Default Rates Are Falling

            December 5, 2025
          • The Daily Spark

            Top 5 Risks in 2026

            December 4, 2025
  • Register for Apollo Academy: Alternative Investing Course
  • Login
  • About Apollo Academy
  • Upcoming Events
  • Learning Center
  • Alternative Perspectives
  • The Daily Spark
  • Register for Apollo Academy: Alternative Investing Course
  • Login
  • 2026 Outlook
  • Alternative Investing Course 2.0
  • Private Equity’s Edge: Delivering Alpha in a Changing Market
  • Powering Innovation: Infrastructure Investing Across the AI Value Chain
  • Mid-Year Outlook: At the Crossroads of Stagflation — What’s Next?
  • Hybrid Investments: Flexible Structures for Volatile Times
  • Private Credit Investing in Volatile Times
  • Potential Implications of the Latest US Administration Policy Proposals
  • View All Classes
  • Introductory Videos
  • Alternative Investing Essentials Part One • Now Available On Demand
  • Alternative Investing Essentials Part Two • Now Available On Demand
  • Practical Considerations • Now Available On Demand
  • Investment Knowledge
  • The View from Apollo
Home February 2025

Jobless Claims for the DC Area

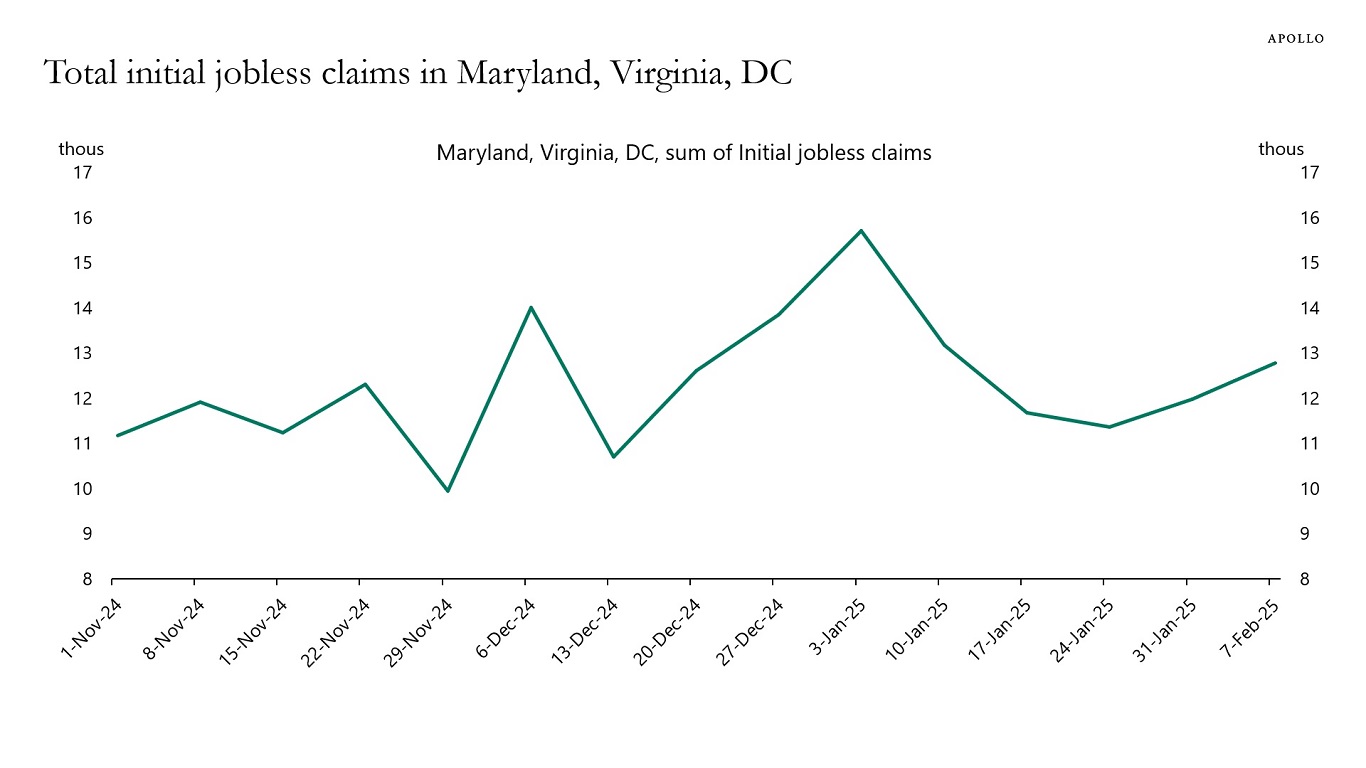
We are watching the weekly data for the number of people who file for unemployment benefits in Washington DC, Maryland, and Virginia, and any impact federal government layoffs may have on nationwide jobless claims, see chart below. This data comes out every Thursday at 8:30 a.m. ET.

Total initial jobless claims in Maryland, Virginia, DC
Source: US Department of Labor, Bloomberg, Apollo Chief Economist

Download high-res chart

Recent Posts

  • The Duration Mismatch in the Banking Sector Is a Risk to Financial Stability
  • Default Rates Are Falling
  • Hybrid in Action: Delivering Bespoke Capital Solutions in a New Market Paradigm
  • Top 5 Risks in 2026
  • Swaption Volatility Remains Remarkably Low Despite Ongoing Fed Debate

Recent Comments

No comments to show.

Archives

  • December 2025
  • November 2025
  • October 2025
  • September 2025
  • August 2025
  • July 2025
  • June 2025
  • May 2025
  • April 2025
  • March 2025
  • February 2025
  • January 2025
  • December 2024
  • November 2024
  • October 2024
  • September 2024
  • August 2024
  • July 2024
  • June 2024
  • May 2024
  • April 2024
  • March 2024
  • February 2024
  • January 2024
  • December 2023
  • November 2023
  • October 2023
  • September 2023
  • August 2023
  • July 2023
  • June 2023
  • May 2023
  • April 2023
  • March 2023
  • February 2023
  • January 2023
  • December 2022
  • November 2022
  • October 2022
  • September 2022
  • August 2022
  • July 2022
  • June 2022
  • May 2022
  • April 2022
  • March 2022
  • February 2022
  • January 2022
  • December 2021
  • November 2021

Categories

  • Apollo Answers
  • Course Introductions
  • Economic Intelligence
  • Hide from Wordpress Search
  • Investment Knowledge
  • Perspectives
  • Redirecting
  • The Daily Spark
  • The View from Apollo
  • The Weekly Brief
  • Uncategorized
  • White Papers

Highly Unusual Divergence Between the Outlook for Germany and Spain

The outlook for Spain continues to improve, and the outlook for Germany continues to deteriorate, see charts below.

German corporate bankruptcies trending higher
Source: German Federal Statistical Office, Bloomberg, Apollo Chief Economist
The unemployment rate in Spain continues to decline
Source: INE, Apollo Chief Economist

Download high-res charts

Recent Posts

  • The Duration Mismatch in the Banking Sector Is a Risk to Financial Stability
  • Default Rates Are Falling
  • Hybrid in Action: Delivering Bespoke Capital Solutions in a New Market Paradigm
  • Top 5 Risks in 2026
  • Swaption Volatility Remains Remarkably Low Despite Ongoing Fed Debate

Recent Comments

No comments to show.

Archives

  • December 2025
  • November 2025
  • October 2025
  • September 2025
  • August 2025
  • July 2025
  • June 2025
  • May 2025
  • April 2025
  • March 2025
  • February 2025
  • January 2025
  • December 2024
  • November 2024
  • October 2024
  • September 2024
  • August 2024
  • July 2024
  • June 2024
  • May 2024
  • April 2024
  • March 2024
  • February 2024
  • January 2024
  • December 2023
  • November 2023
  • October 2023
  • September 2023
  • August 2023
  • July 2023
  • June 2023
  • May 2023
  • April 2023
  • March 2023
  • February 2023
  • January 2023
  • December 2022
  • November 2022
  • October 2022
  • September 2022
  • August 2022
  • July 2022
  • June 2022
  • May 2022
  • April 2022
  • March 2022
  • February 2022
  • January 2022
  • December 2021
  • November 2021

Categories

  • Apollo Answers
  • Course Introductions
  • Economic Intelligence
  • Hide from Wordpress Search
  • Investment Knowledge
  • Perspectives
  • Redirecting
  • The Daily Spark
  • The View from Apollo
  • The Weekly Brief
  • Uncategorized
  • White Papers

The Average Age of US Passenger Cars: 14 Years

The average age of passenger cars on the roads in the US continues to rise, see chart below.

Average age of US passenger cars: 14 years
Source: Bloomberg, Apollo Chief Economist

Download high-res chart

Recent Posts

  • The Duration Mismatch in the Banking Sector Is a Risk to Financial Stability
  • Default Rates Are Falling
  • Hybrid in Action: Delivering Bespoke Capital Solutions in a New Market Paradigm
  • Top 5 Risks in 2026
  • Swaption Volatility Remains Remarkably Low Despite Ongoing Fed Debate

Recent Comments

No comments to show.

Archives

  • December 2025
  • November 2025
  • October 2025
  • September 2025
  • August 2025
  • July 2025
  • June 2025
  • May 2025
  • April 2025
  • March 2025
  • February 2025
  • January 2025
  • December 2024
  • November 2024
  • October 2024
  • September 2024
  • August 2024
  • July 2024
  • June 2024
  • May 2024
  • April 2024
  • March 2024
  • February 2024
  • January 2024
  • December 2023
  • November 2023
  • October 2023
  • September 2023
  • August 2023
  • July 2023
  • June 2023
  • May 2023
  • April 2023
  • March 2023
  • February 2023
  • January 2023
  • December 2022
  • November 2022
  • October 2022
  • September 2022
  • August 2022
  • July 2022
  • June 2022
  • May 2022
  • April 2022
  • March 2022
  • February 2022
  • January 2022
  • December 2021
  • November 2021

Categories

  • Apollo Answers
  • Course Introductions
  • Economic Intelligence
  • Hide from Wordpress Search
  • Investment Knowledge
  • Perspectives
  • Redirecting
  • The Daily Spark
  • The View from Apollo
  • The Weekly Brief
  • Uncategorized
  • White Papers

The Incoming Data Remains Strong

The data this week shows that the economy remains strong.

Consumers are in good shape, and year-over-year retail sales show steady growth, see the first chart below. Capex spending plans are improving, see the second chart, and the Atlanta Fed GDP estimate for first quarter GDP and the Dallas Fed weekly estimate for GDP are at 2.3% and 2.5%, respectively, see the third and fourth chart.

We are carefully monitoring trade war uncertainty, but so far, there are no signs that it is having a negative impact on the incoming data, see the fifth chart.

Retail sales still strong
Source: Census Bureau, Haver Analytics, Apollo Chief Economist
Corporate capex spending plans
Source: Business Roundtable; NFIB; Federal Reserve Bank of Philadelphia, Dallas, New York, Kansas, and Richmond; Apollo Chief Economist
2025 Q1 GDP estimate from Atlanta Fed: 2.3%
Source: Federal Reserve Bank of Atlanta, Haver Analytics, Apollo Chief Economist
The Fed’s Weekly Economic Index, measured in GDP units
Source: Federal Reserve Bank of Dallas, Bureau of Economic Analysis, Apollo Chief Economist
Changes in trade policy has increased economic policy uncertainty
Source: PolicyUncertainty.com, Haver Analytics, Apollo Chief Economist

Download high-res chart book

Recent Posts

  • The Duration Mismatch in the Banking Sector Is a Risk to Financial Stability
  • Default Rates Are Falling
  • Hybrid in Action: Delivering Bespoke Capital Solutions in a New Market Paradigm
  • Top 5 Risks in 2026
  • Swaption Volatility Remains Remarkably Low Despite Ongoing Fed Debate

Recent Comments

No comments to show.

Archives

  • December 2025
  • November 2025
  • October 2025
  • September 2025
  • August 2025
  • July 2025
  • June 2025
  • May 2025
  • April 2025
  • March 2025
  • February 2025
  • January 2025
  • December 2024
  • November 2024
  • October 2024
  • September 2024
  • August 2024
  • July 2024
  • June 2024
  • May 2024
  • April 2024
  • March 2024
  • February 2024
  • January 2024
  • December 2023
  • November 2023
  • October 2023
  • September 2023
  • August 2023
  • July 2023
  • June 2023
  • May 2023
  • April 2023
  • March 2023
  • February 2023
  • January 2023
  • December 2022
  • November 2022
  • October 2022
  • September 2022
  • August 2022
  • July 2022
  • June 2022
  • May 2022
  • April 2022
  • March 2022
  • February 2022
  • January 2022
  • December 2021
  • November 2021

Categories

  • Apollo Answers
  • Course Introductions
  • Economic Intelligence
  • Hide from Wordpress Search
  • Investment Knowledge
  • Perspectives
  • Redirecting
  • The Daily Spark
  • The View from Apollo
  • The Weekly Brief
  • Uncategorized
  • White Papers
The View from Apollo - A New Podcast Series

How Can Private IG Enhance Fixed Income Allocations?

Listen to Torsten Slok, Apollo’s Chief Economist and John Cortese, Partner and Global Head of trading at the Firm, explore a lesser-known area of private credit—Investment Grade Private Credit, or Private IG. In a wide-ranging conversation, they discuss what Private IG is, the key differences with public investment grade credit, secular drivers, its potential role in portfolios, and much more.

Recent Posts

  • The Duration Mismatch in the Banking Sector Is a Risk to Financial Stability
  • Default Rates Are Falling
  • Hybrid in Action: Delivering Bespoke Capital Solutions in a New Market Paradigm
  • Top 5 Risks in 2026
  • Swaption Volatility Remains Remarkably Low Despite Ongoing Fed Debate

Recent Comments

No comments to show.

Archives

  • December 2025
  • November 2025
  • October 2025
  • September 2025
  • August 2025
  • July 2025
  • June 2025
  • May 2025
  • April 2025
  • March 2025
  • February 2025
  • January 2025
  • December 2024
  • November 2024
  • October 2024
  • September 2024
  • August 2024
  • July 2024
  • June 2024
  • May 2024
  • April 2024
  • March 2024
  • February 2024
  • January 2024
  • December 2023
  • November 2023
  • October 2023
  • September 2023
  • August 2023
  • July 2023
  • June 2023
  • May 2023
  • April 2023
  • March 2023
  • February 2023
  • January 2023
  • December 2022
  • November 2022
  • October 2022
  • September 2022
  • August 2022
  • July 2022
  • June 2022
  • May 2022
  • April 2022
  • March 2022
  • February 2022
  • January 2022
  • December 2021
  • November 2021

Categories

  • Apollo Answers
  • Course Introductions
  • Economic Intelligence
  • Hide from Wordpress Search
  • Investment Knowledge
  • Perspectives
  • Redirecting
  • The Daily Spark
  • The View from Apollo
  • The Weekly Brief
  • Uncategorized
  • White Papers

The Source of Returns in the 60/40 Portfolio

Almost all returns in the 60/40 portfolio come from the stock market, see chart below. When the stock market goes down, there are years when Treasuries are not the correct hedge against downside risks in the S&P 500, including in 2022.

Asset allocation has evolved significantly since the 60/40 portfolio was invented in the 1950s, and investors are now asking more nuanced questions about fixed income replacement and equity replacement, with a focus on less concentration in the S&P 500, lower volatility in returns, and less need for daily liquidity, see also here.

Almost all the variation in returns in the 60/40 portfolio comes from the equity market
Source: Bloomberg, Apollo Chief Economist

Download high-res chart

Recent Posts

  • The Duration Mismatch in the Banking Sector Is a Risk to Financial Stability
  • Default Rates Are Falling
  • Hybrid in Action: Delivering Bespoke Capital Solutions in a New Market Paradigm
  • Top 5 Risks in 2026
  • Swaption Volatility Remains Remarkably Low Despite Ongoing Fed Debate

Recent Comments

No comments to show.

Archives

  • December 2025
  • November 2025
  • October 2025
  • September 2025
  • August 2025
  • July 2025
  • June 2025
  • May 2025
  • April 2025
  • March 2025
  • February 2025
  • January 2025
  • December 2024
  • November 2024
  • October 2024
  • September 2024
  • August 2024
  • July 2024
  • June 2024
  • May 2024
  • April 2024
  • March 2024
  • February 2024
  • January 2024
  • December 2023
  • November 2023
  • October 2023
  • September 2023
  • August 2023
  • July 2023
  • June 2023
  • May 2023
  • April 2023
  • March 2023
  • February 2023
  • January 2023
  • December 2022
  • November 2022
  • October 2022
  • September 2022
  • August 2022
  • July 2022
  • June 2022
  • May 2022
  • April 2022
  • March 2022
  • February 2022
  • January 2022
  • December 2021
  • November 2021

Categories

  • Apollo Answers
  • Course Introductions
  • Economic Intelligence
  • Hide from Wordpress Search
  • Investment Knowledge
  • Perspectives
  • Redirecting
  • The Daily Spark
  • The View from Apollo
  • The Weekly Brief
  • Uncategorized
  • White Papers

When History Rhymes

Inflation is moving higher, inflation expectations are moving higher, and breakevens are moving higher, see charts below. If the Fed cuts interest rates too early, it increases the likelihood that we will see a repeat of the 1970s. The Fed has no other options than to keep interest rates higher for longer.

Inflation: Today vs. the 1970s
Source: Bloomberg, BLS, Apollo Chief Economist
CPI: Inflation is moving away from the Fed’s 2% inflation target
Source: BLS, Haver Analytics, Apollo Chief Economist
Core CPI: Inflation is moving away from the Fed’s 2% inflation target
Source: BLS, Haver Analytics, Apollo Chief Economist

Download high-res charts

Recent Posts

  • The Duration Mismatch in the Banking Sector Is a Risk to Financial Stability
  • Default Rates Are Falling
  • Hybrid in Action: Delivering Bespoke Capital Solutions in a New Market Paradigm
  • Top 5 Risks in 2026
  • Swaption Volatility Remains Remarkably Low Despite Ongoing Fed Debate

Recent Comments

No comments to show.

Archives

  • December 2025
  • November 2025
  • October 2025
  • September 2025
  • August 2025
  • July 2025
  • June 2025
  • May 2025
  • April 2025
  • March 2025
  • February 2025
  • January 2025
  • December 2024
  • November 2024
  • October 2024
  • September 2024
  • August 2024
  • July 2024
  • June 2024
  • May 2024
  • April 2024
  • March 2024
  • February 2024
  • January 2024
  • December 2023
  • November 2023
  • October 2023
  • September 2023
  • August 2023
  • July 2023
  • June 2023
  • May 2023
  • April 2023
  • March 2023
  • February 2023
  • January 2023
  • December 2022
  • November 2022
  • October 2022
  • September 2022
  • August 2022
  • July 2022
  • June 2022
  • May 2022
  • April 2022
  • March 2022
  • February 2022
  • January 2022
  • December 2021
  • November 2021

Categories

  • Apollo Answers
  • Course Introductions
  • Economic Intelligence
  • Hide from Wordpress Search
  • Investment Knowledge
  • Perspectives
  • Redirecting
  • The Daily Spark
  • The View from Apollo
  • The Weekly Brief
  • Uncategorized
  • White Papers

Public Markets Becoming Less Liquid and Less Transparent

The share of equity trading volume on the exchanges is now smaller than the share of equity trading volume in dark pools, negotiated trades, and internalized trades, see chart below.

More equity trading volume is now off-exchange
Note: Off-exchange trading activity is Trade Reporting Facility (TRF) trading volume. All trades executed otherwise than on an exchange is reported under TRF. Examples include dark pools, negotiated trades, and internalized trades. Source: Bloomberg, FINRA, Apollo Chief Economist

Download high-res chart

Recent Posts

  • The Duration Mismatch in the Banking Sector Is a Risk to Financial Stability
  • Default Rates Are Falling
  • Hybrid in Action: Delivering Bespoke Capital Solutions in a New Market Paradigm
  • Top 5 Risks in 2026
  • Swaption Volatility Remains Remarkably Low Despite Ongoing Fed Debate

Recent Comments

No comments to show.

Archives

  • December 2025
  • November 2025
  • October 2025
  • September 2025
  • August 2025
  • July 2025
  • June 2025
  • May 2025
  • April 2025
  • March 2025
  • February 2025
  • January 2025
  • December 2024
  • November 2024
  • October 2024
  • September 2024
  • August 2024
  • July 2024
  • June 2024
  • May 2024
  • April 2024
  • March 2024
  • February 2024
  • January 2024
  • December 2023
  • November 2023
  • October 2023
  • September 2023
  • August 2023
  • July 2023
  • June 2023
  • May 2023
  • April 2023
  • March 2023
  • February 2023
  • January 2023
  • December 2022
  • November 2022
  • October 2022
  • September 2022
  • August 2022
  • July 2022
  • June 2022
  • May 2022
  • April 2022
  • March 2022
  • February 2022
  • January 2022
  • December 2021
  • November 2021

Categories

  • Apollo Answers
  • Course Introductions
  • Economic Intelligence
  • Hide from Wordpress Search
  • Investment Knowledge
  • Perspectives
  • Redirecting
  • The Daily Spark
  • The View from Apollo
  • The Weekly Brief
  • Uncategorized
  • White Papers

The Impact of Rates Higher for Longer on the Capital Structure

The transmission mechanism of monetary policy works through higher costs of capital that lowers demand for capex and hiring but also raises return requirements for equity to pay the debtholders in the company.

Higher interest rates are a redistribution of value from the junior parts of the capital structure to the senior parts, see chart below. Someone has to pay the higher level of interest rates in corporate capital structures, and it is not the Fed, it is the equity holder.

In short, companies with no earnings, no cash flow, and no revenue will continue to struggle simply because they cannot pay the higher debt servicing costs. In other words, when interest rates are higher for longer, companies with earnings tend to outperform because companies with earnings are able to pay higher debt servicing costs. The purpose with higher interest rates is to slow growth, which makes value more attractive than growth.

In fact, this is the entire idea from the Fed with raising interest rates—to discourage too much risk taking, such as investments in companies and capital structures with no earnings, no revenue, and no cash flow. Examples of unattractive sectors are growth, software, and venture capital.

When interest rates are higher for longer, relative value moves up the capital structure
Source: Bloomberg, Apollo Chief Economist

Download high-res chart

Recent Posts

  • The Duration Mismatch in the Banking Sector Is a Risk to Financial Stability
  • Default Rates Are Falling
  • Hybrid in Action: Delivering Bespoke Capital Solutions in a New Market Paradigm
  • Top 5 Risks in 2026
  • Swaption Volatility Remains Remarkably Low Despite Ongoing Fed Debate

Recent Comments

No comments to show.

Archives

  • December 2025
  • November 2025
  • October 2025
  • September 2025
  • August 2025
  • July 2025
  • June 2025
  • May 2025
  • April 2025
  • March 2025
  • February 2025
  • January 2025
  • December 2024
  • November 2024
  • October 2024
  • September 2024
  • August 2024
  • July 2024
  • June 2024
  • May 2024
  • April 2024
  • March 2024
  • February 2024
  • January 2024
  • December 2023
  • November 2023
  • October 2023
  • September 2023
  • August 2023
  • July 2023
  • June 2023
  • May 2023
  • April 2023
  • March 2023
  • February 2023
  • January 2023
  • December 2022
  • November 2022
  • October 2022
  • September 2022
  • August 2022
  • July 2022
  • June 2022
  • May 2022
  • April 2022
  • March 2022
  • February 2022
  • January 2022
  • December 2021
  • November 2021

Categories

  • Apollo Answers
  • Course Introductions
  • Economic Intelligence
  • Hide from Wordpress Search
  • Investment Knowledge
  • Perspectives
  • Redirecting
  • The Daily Spark
  • The View from Apollo
  • The Weekly Brief
  • Uncategorized
  • White Papers

13% of US Imports Come from China

The share of US imports from China has been declining since 2016 and currently stands at 13%, see chart below.

13% of US imports come from China
Source: Census Bureau, Haver Analytics, Apollo Chief Economist

Download high-res chart

Recent Posts

  • The Duration Mismatch in the Banking Sector Is a Risk to Financial Stability
  • Default Rates Are Falling
  • Hybrid in Action: Delivering Bespoke Capital Solutions in a New Market Paradigm
  • Top 5 Risks in 2026
  • Swaption Volatility Remains Remarkably Low Despite Ongoing Fed Debate

Recent Comments

No comments to show.

Archives

  • December 2025
  • November 2025
  • October 2025
  • September 2025
  • August 2025
  • July 2025
  • June 2025
  • May 2025
  • April 2025
  • March 2025
  • February 2025
  • January 2025
  • December 2024
  • November 2024
  • October 2024
  • September 2024
  • August 2024
  • July 2024
  • June 2024
  • May 2024
  • April 2024
  • March 2024
  • February 2024
  • January 2024
  • December 2023
  • November 2023
  • October 2023
  • September 2023
  • August 2023
  • July 2023
  • June 2023
  • May 2023
  • April 2023
  • March 2023
  • February 2023
  • January 2023
  • December 2022
  • November 2022
  • October 2022
  • September 2022
  • August 2022
  • July 2022
  • June 2022
  • May 2022
  • April 2022
  • March 2022
  • February 2022
  • January 2022
  • December 2021
  • November 2021

Categories

  • Apollo Answers
  • Course Introductions
  • Economic Intelligence
  • Hide from Wordpress Search
  • Investment Knowledge
  • Perspectives
  • Redirecting
  • The Daily Spark
  • The View from Apollo
  • The Weekly Brief
  • Uncategorized
  • White Papers

Posts navigation

←Previous page Page 1 Page 2 Page 3 Next page→
  • Privacy Notice
  • Terms of Use
  • Forward-Looking Statements
Apollo
© Apollo Global Management, Inc. All Rights Reserved.

The Apollo Academy is for informational and educational purposes only and nothing contained herein should be taken as investment advice or a recommendation to enter into any transaction. They are not an invitation by or on behalf of Apollo to any person to buy or sell any security or to adopt any investment strategy, and shall not form the basis of, nor may it accompany nor form part of, any right or contract to buy or sell any security or to adopt any investment strategy. There is no guarantee that the views and opinions expressed in this website will come to pass. For additional information, please see the disclaimers included in each piece of content or the legal page of our website here.