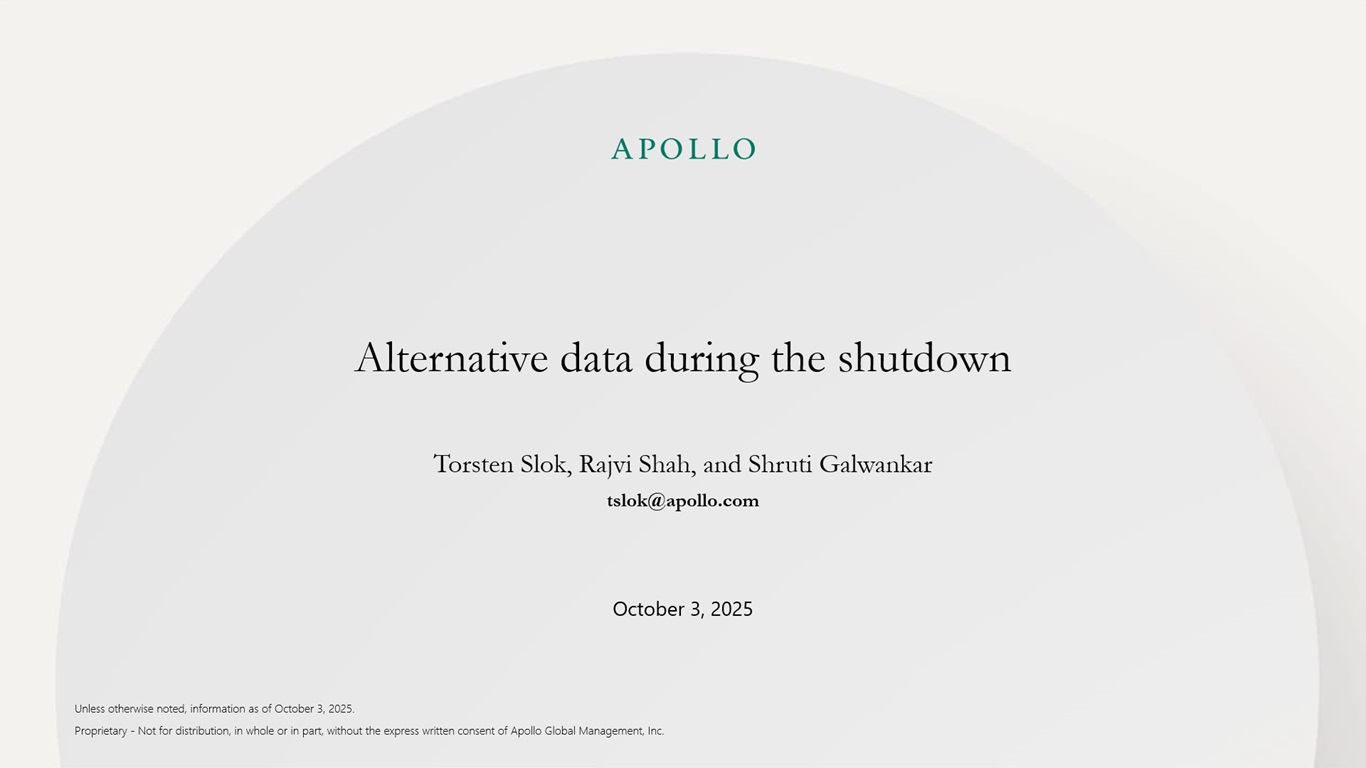
There is still strong growth in data center construction, but the current growth rate at 30% is lower than the 80% observed two years ago, see chart below.


There is still strong growth in data center construction, but the current growth rate at 30% is lower than the 80% observed two years ago, see chart below.
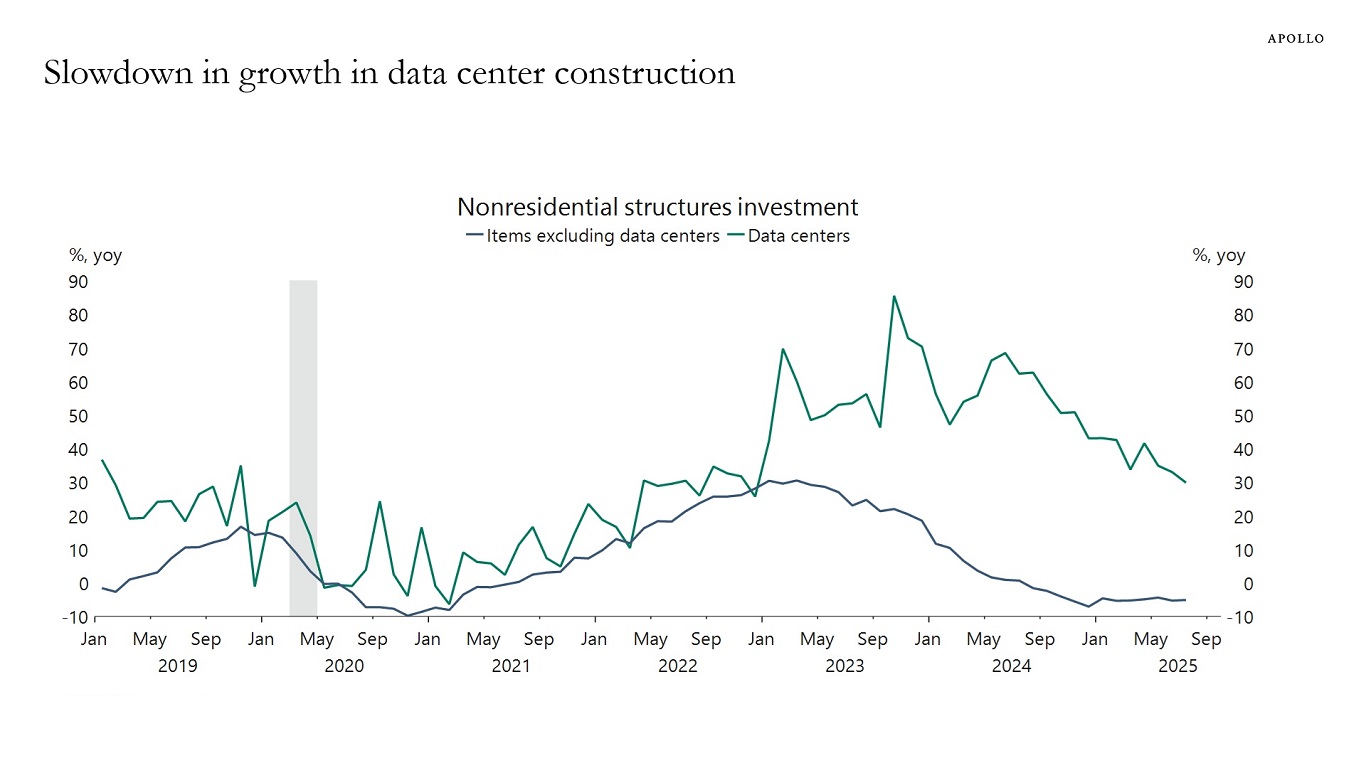
Yield levels on deposits in many fintech companies are dramatically higher than yield levels on deposits in the banking sector, see chart below. It is a fundamental imprudence in banking to finance long-horizon assets with short-term liabilities.
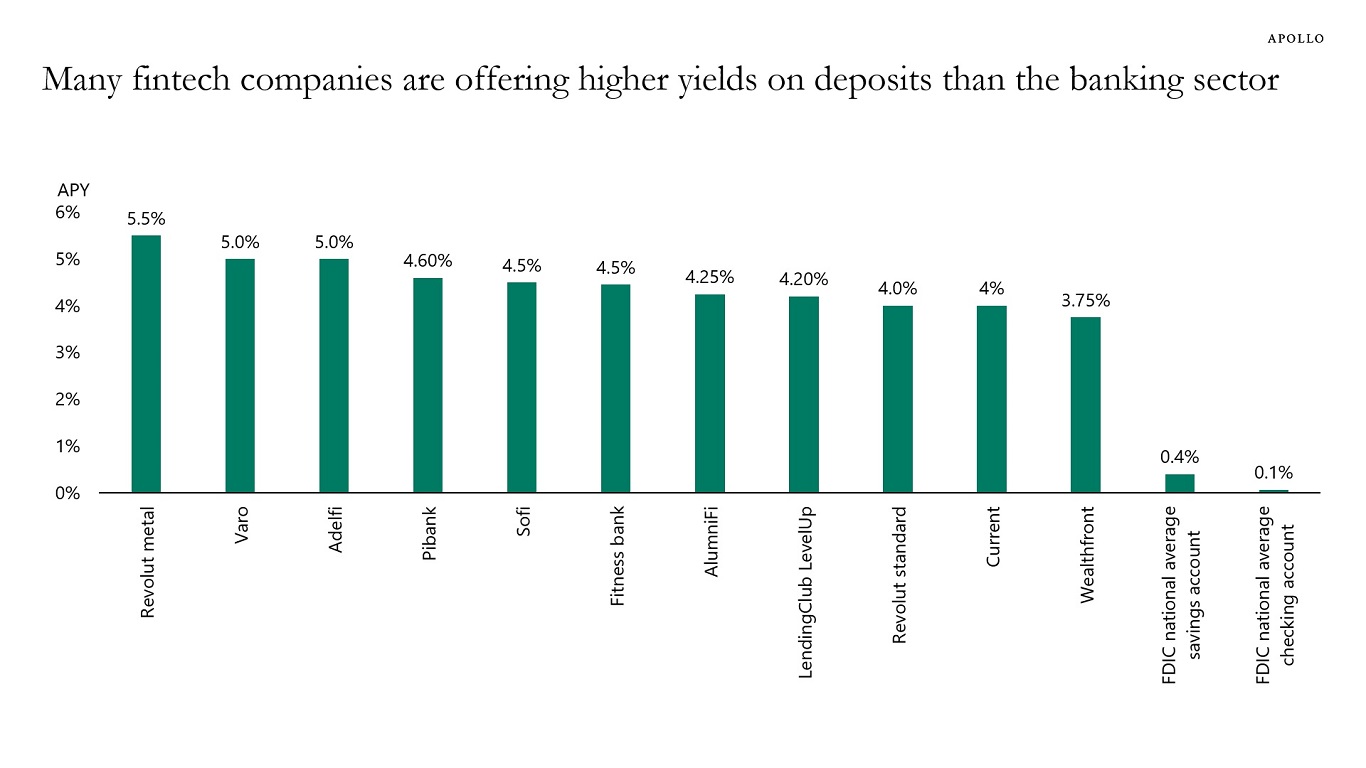
House prices in Brisbane, Adelaide and Perth are up roughly 90% since 2020, see chart below. Home prices in Sydney are up “only” 40% over the same period.
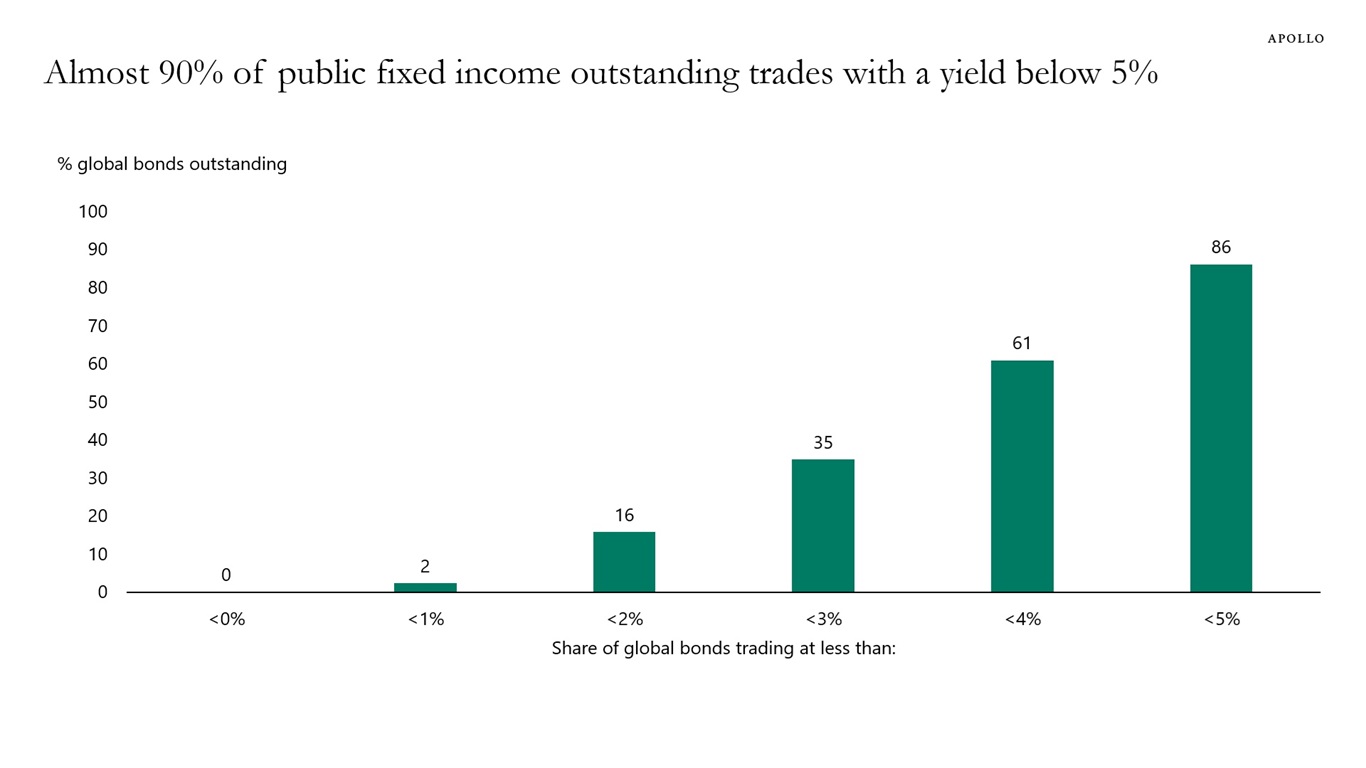
Almost 90% of all public fixed income outstanding in the world trades at a yield below 5%, see chart below.
With inflation at 3%, the real return for investors in public fixed income is a meager 2% or less.
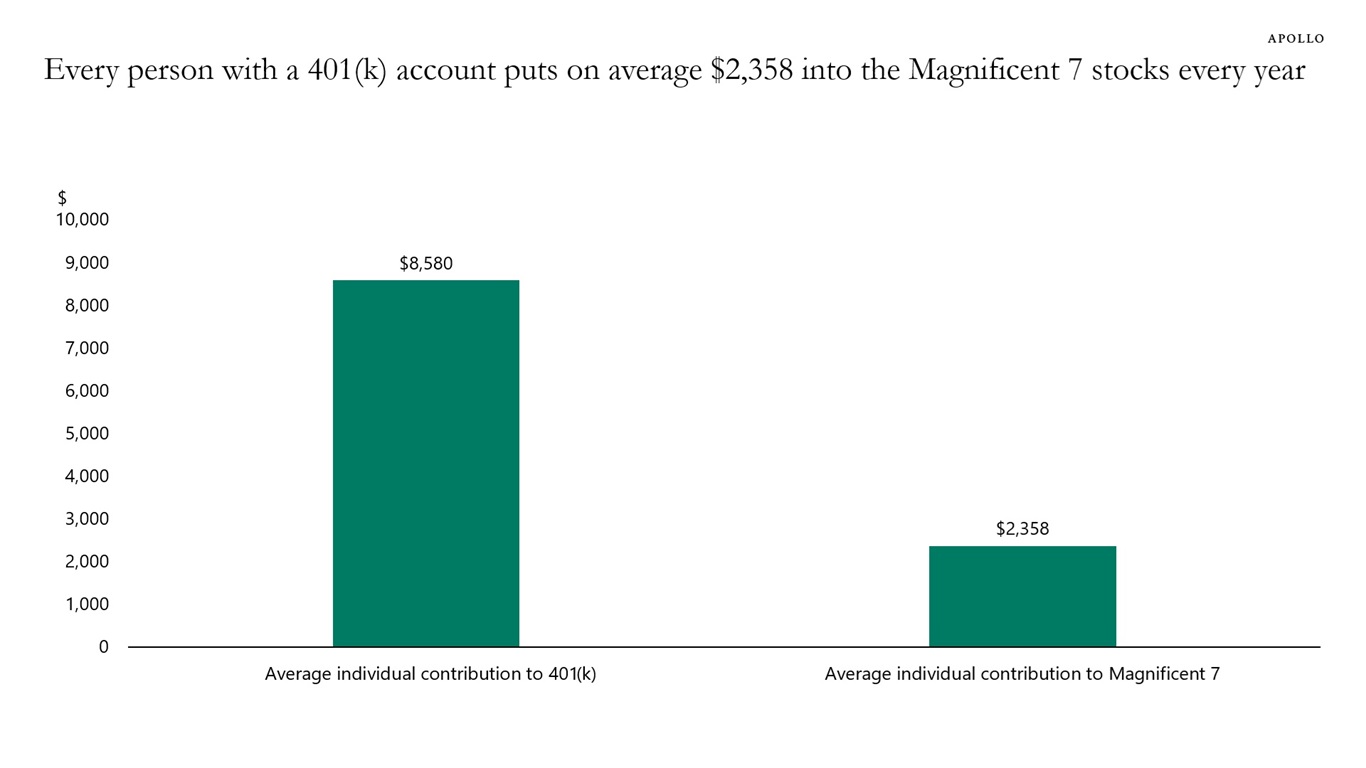
US workers contribute on average around $8,500 to their 401(k) accounts every year, and with 71% of 401(k) assets allocated to equities—and the Magnificent Seven having a weight of almost 40% in the S&P 500—the bottom line is that each worker in the US puts an estimated $2,300 into the Magnificent Seven stocks every year, see chart below.
This is passive money going into the Magnificent Seven regardless of whether their outlook is good or bad.
There are three reasons why job growth is slow: 1) Lower immigration, 2) AI implementation and 3) fewer government jobs.
Specifically:
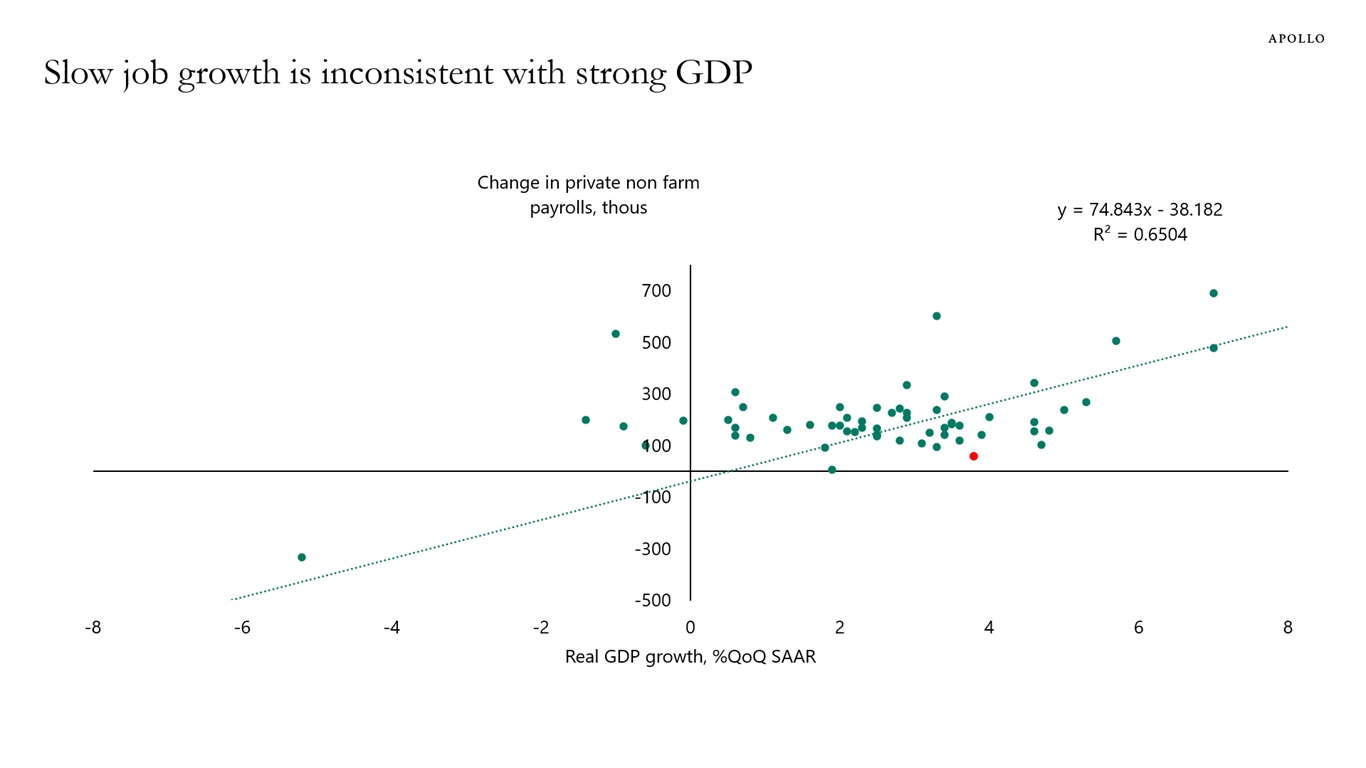
The first chart below shows that at the current level of GDP growth, nonfarm payrolls should be 263k every month.
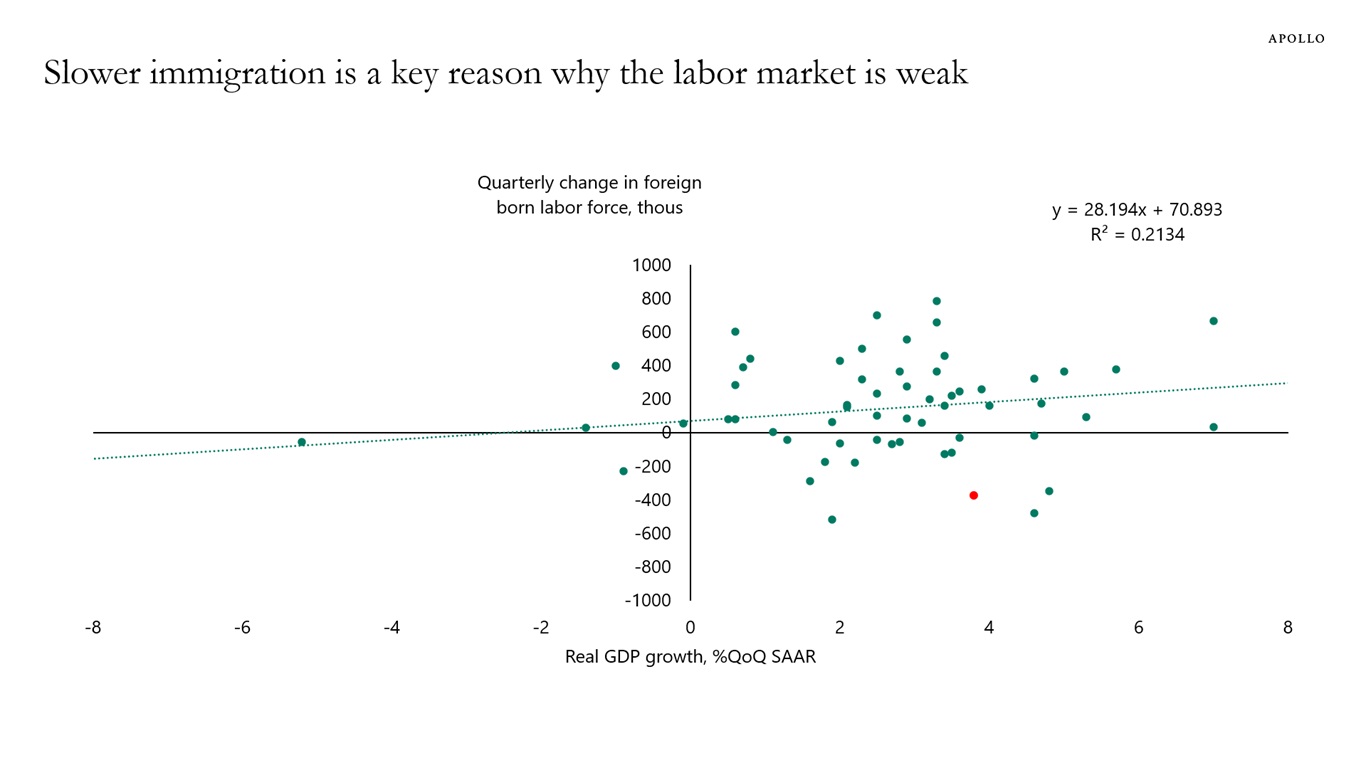
The second chart indicates that a key reason for the slow job growth is that the growth rate in the foreign-born labor force has been significantly weaker than normal. Fewer people looking for jobs means fewer people get hired.
The third chart indicates that AI implementation is likely improving productivity.
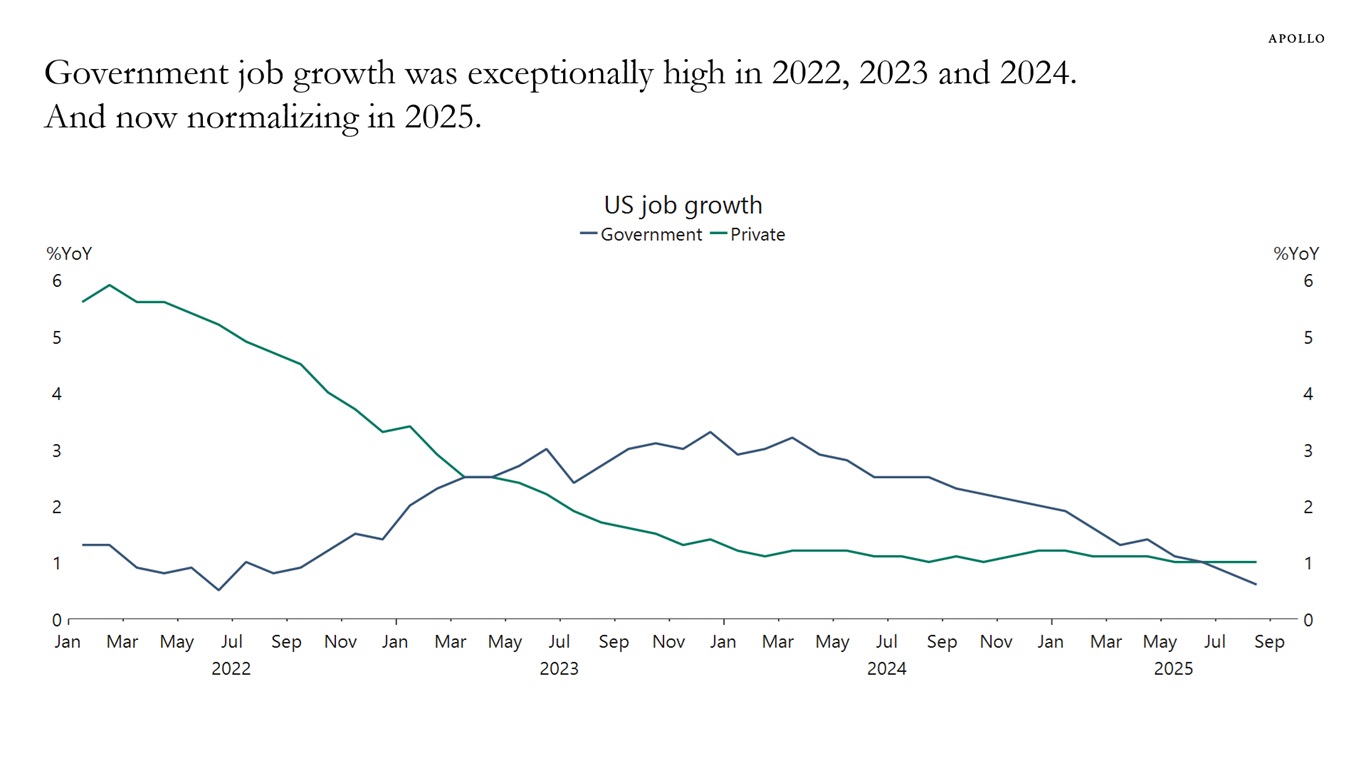
The fourth chart shows that government job growth was artificially high in 2022, 2023 and 2024. Combined with DOGE, government job growth is now returning to more normal levels.
The bottom line is that the weak labor market is not due to weaker labor demand, but rather to weaker labor supply because of immigration, AI implementation and a normalization of job growth in the public sector.
In short, slow job growth is not the result of a slowing economy. Because if it were, then GDP, consumer spending and capex spending would also be slowing.
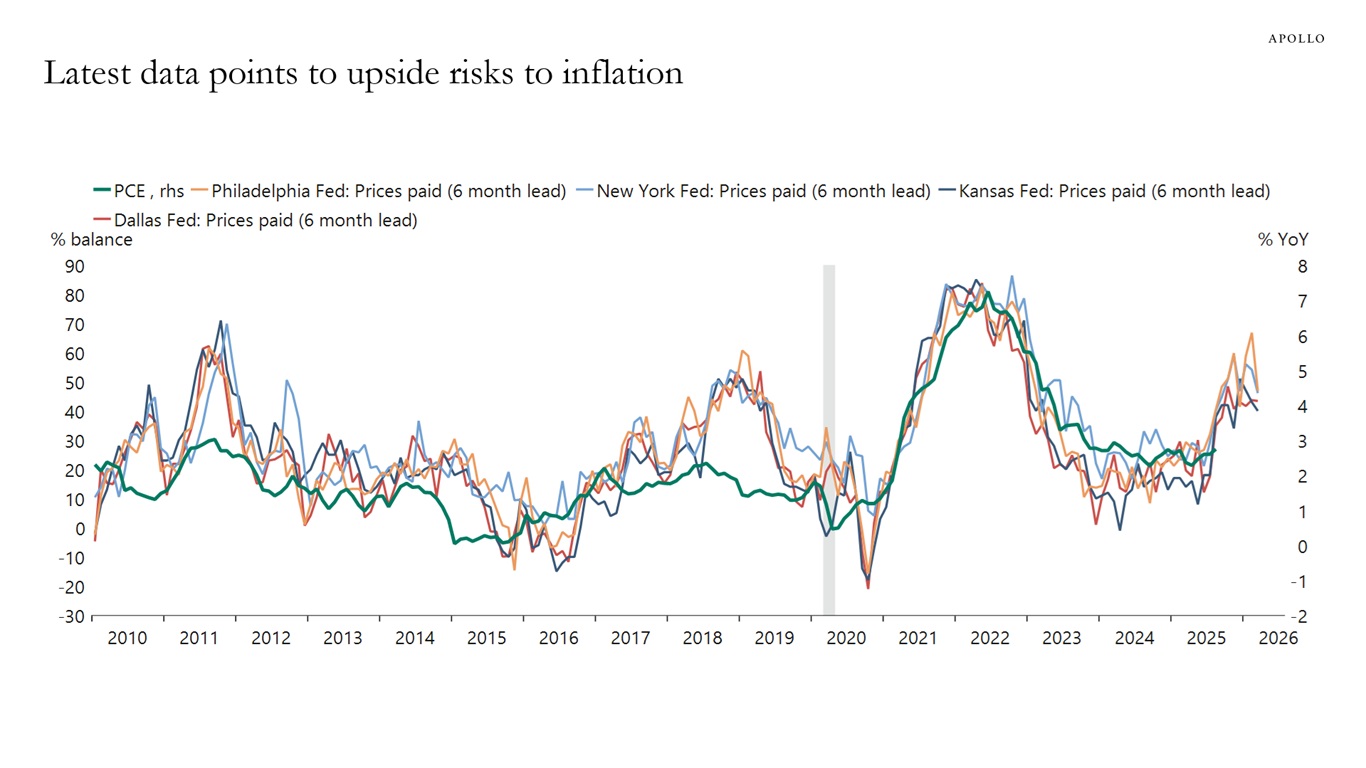
The conclusion is that the Fed should focus less on the slowdown in job growth and more on the ongoing uptrend in inflation, see the fifth and sixth charts.
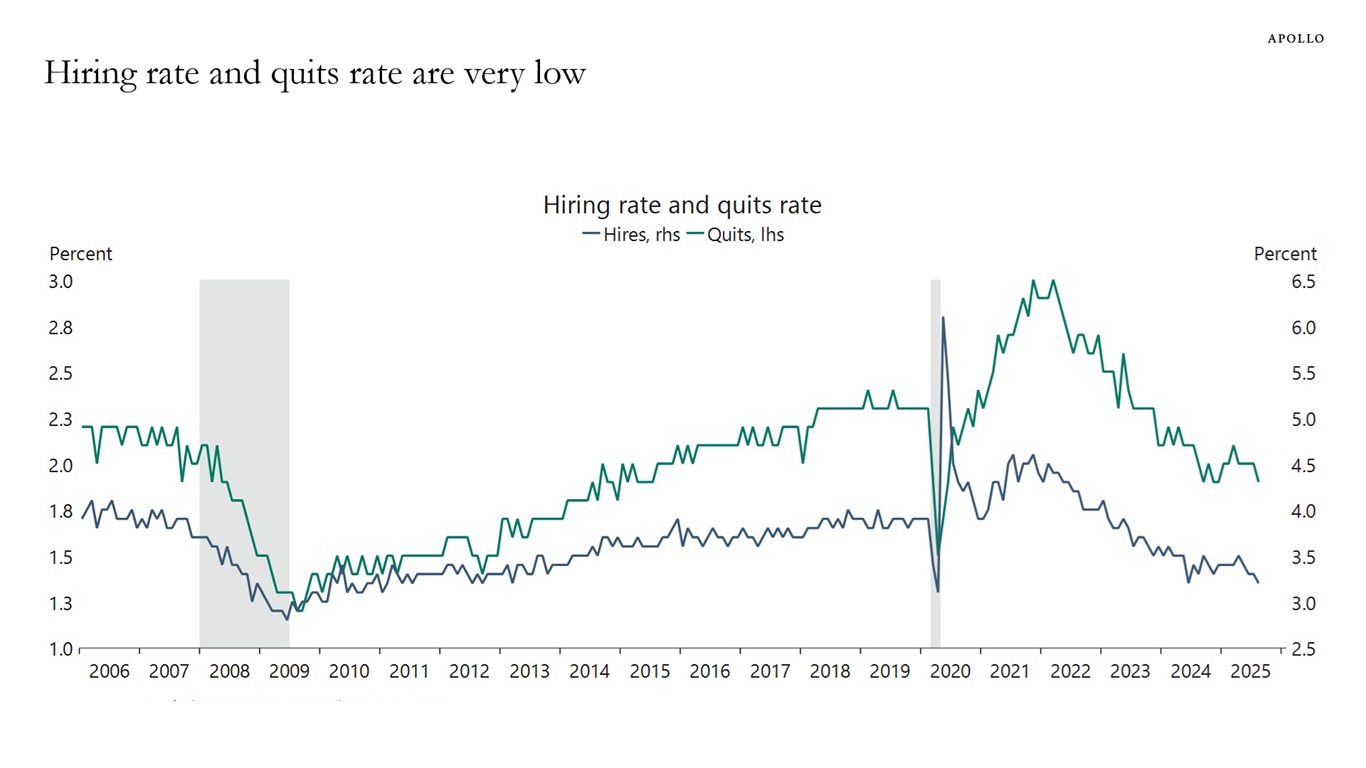
The hiring rate measures the number of hires during the entire month as a percentage of total employment, and it is currently at recessionary levels, see chart below.
Similarly, the quits rate measures the number of employees who voluntarily left their jobs during a month, expressed as a percentage of total employment, and the quits rate is also low.
Combined with a declining number of job openings, rising unemployment, and slower job growth, the bottom line is that the labor market is at a standstill, where workers are not getting hired or voluntarily changing jobs.

The rapid growth in private credit markets has been fueled by a surge in new loan originations by private lenders. Apollo’s proprietary origination ecosystem is built to align with the growing needs of borrowers while providing investors access to private investment-grade credit opportunities that can offer enhanced yield. Chris Edson, Partner and Head of Origination, explains what this differentiated origination engine can deliver for investors and borrowers.
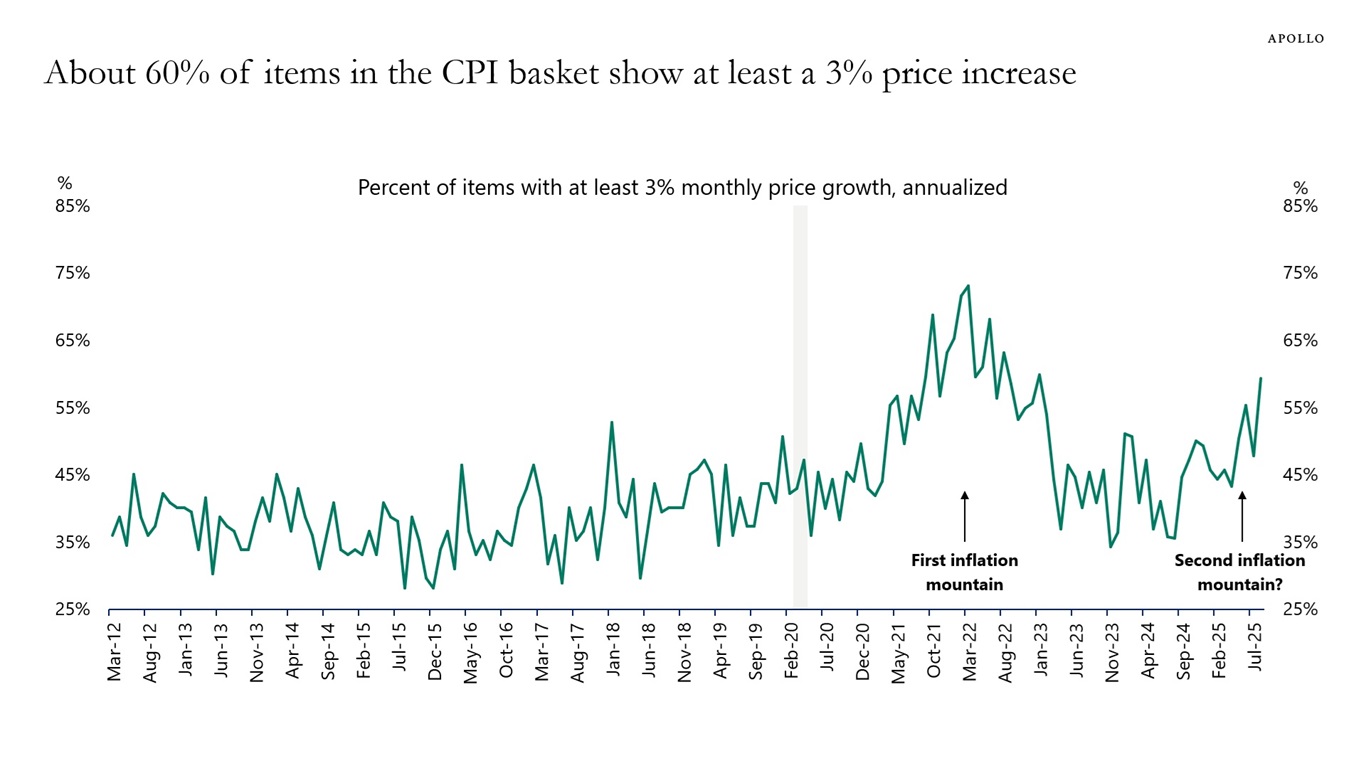
Looking at annualized month-over-month growth rates shows that 60% of items in the CPI basket are growing faster than 3%, see chart below. Is a second inflation mountain emerging?
We have put together a 75-page chart book with private sector data to monitor during the shutdown, and it is available here. We will update and publish this going forward as long as the shutdown continues.