• Apollo.com
  • Login
  • Register Now
light site-logo
  • The Academy
  • Upcoming Events
        • Upcoming Events

  • Learning Center
        • New & UpdatedAlternative Investing Course 2.0

        • Alternative Investing Essentials Part OnePrivate Equity, Venture Capital, Private Credit
        • Alternative Investing Essentials Part TwoReal Estate, Infrastructure, Digital Assets, Hedge Funds
        • Practical ConsiderationsAsset Allocation, Risk Considerations, Fund Structures, Fees
        • Introductory Videos

          View All Videos

        •  Recent Classes & Videos

        • • 2026 Outlook
        • • Private Equity’s Edge: Delivering Alpha in a Changing Market
        • • Powering Innovation: Infrastructure Investing Across the AI Value Chain
        • • Mid-Year Outlook: At the Crossroads of Stagflation — What’s Next?
        • • Hybrid Investments: Flexible Structures for Volatile Times
        • • Private Credit Investing in Volatile Times
        • View All Classes

  • Alternative Perspectives
        • Investment Knowledge
        • The View from Apollo
          • Investment Knowledge White Papers

            After 60/40: In Private Markets, Manager Selection Matters

            February 27, 2026
          • The View From Apollo

            Allocation Insights: Asset-Backed Finance Is the Engine Behind Private Credit’s Next Chapter

            February 17, 2026
          • Investment Knowledge White Papers

            Private Equity Returns to Its Roots

            January 29, 2026
  • The Daily Spark
        • Read The Daily Spark Blog


        • Want it delivered daily to your inbox?
          • The Daily Spark

            Strong Net Foreign Buying of US Assets

            March 2, 2026
          • The Daily Spark

            Average Tenure of Companies in the S&P 500 Index: 15 Years

            March 1, 2026
          • The Daily Spark

            Fed Pricing Reveals Market Expectations About the AI Adoption Pace

            February 28, 2026
  • Register for Apollo Academy: Alternative Investing Course
  • Login
  • About Apollo Academy
  • Upcoming Events
  • Learning Center
  • Alternative Perspectives
  • The Daily Spark
  • Register for Apollo Academy: Alternative Investing Course
  • Login
  • Alternative Investing Course 2.0
  • 2026 Outlook
  • Private Equity’s Edge: Delivering Alpha in a Changing Market
  • Powering Innovation: Infrastructure Investing Across the AI Value Chain
  • Mid-Year Outlook: At the Crossroads of Stagflation — What’s Next?
  • Hybrid Investments: Flexible Structures for Volatile Times
  • Private Credit Investing in Volatile Times
  • View All Classes
  • Introductory Videos
  • Alternative Investing Essentials Part One • Now Available On Demand
  • Alternative Investing Essentials Part Two • Now Available On Demand
  • Practical Considerations • Now Available On Demand
  • Investment Knowledge
  • The View from Apollo
Home February 2026

US Private Sector Balance Sheets in Excellent Shape

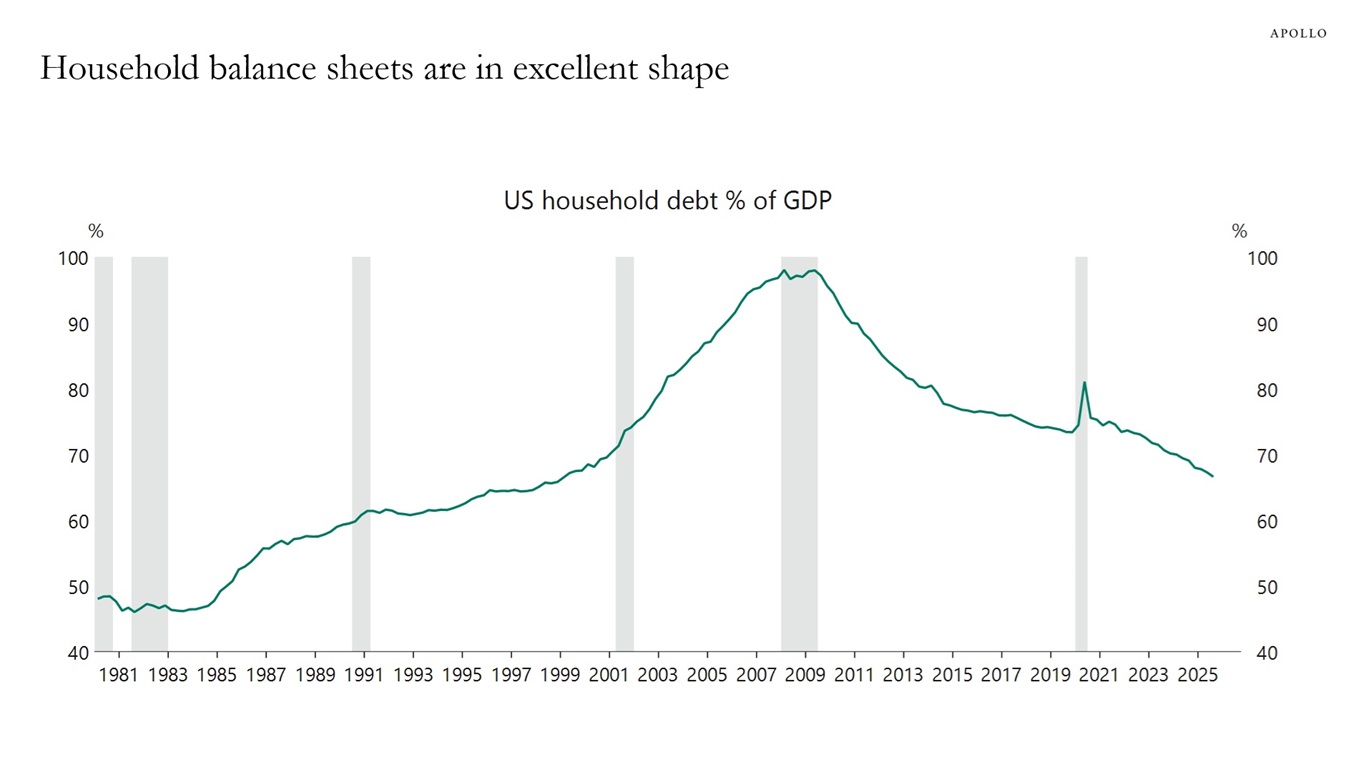
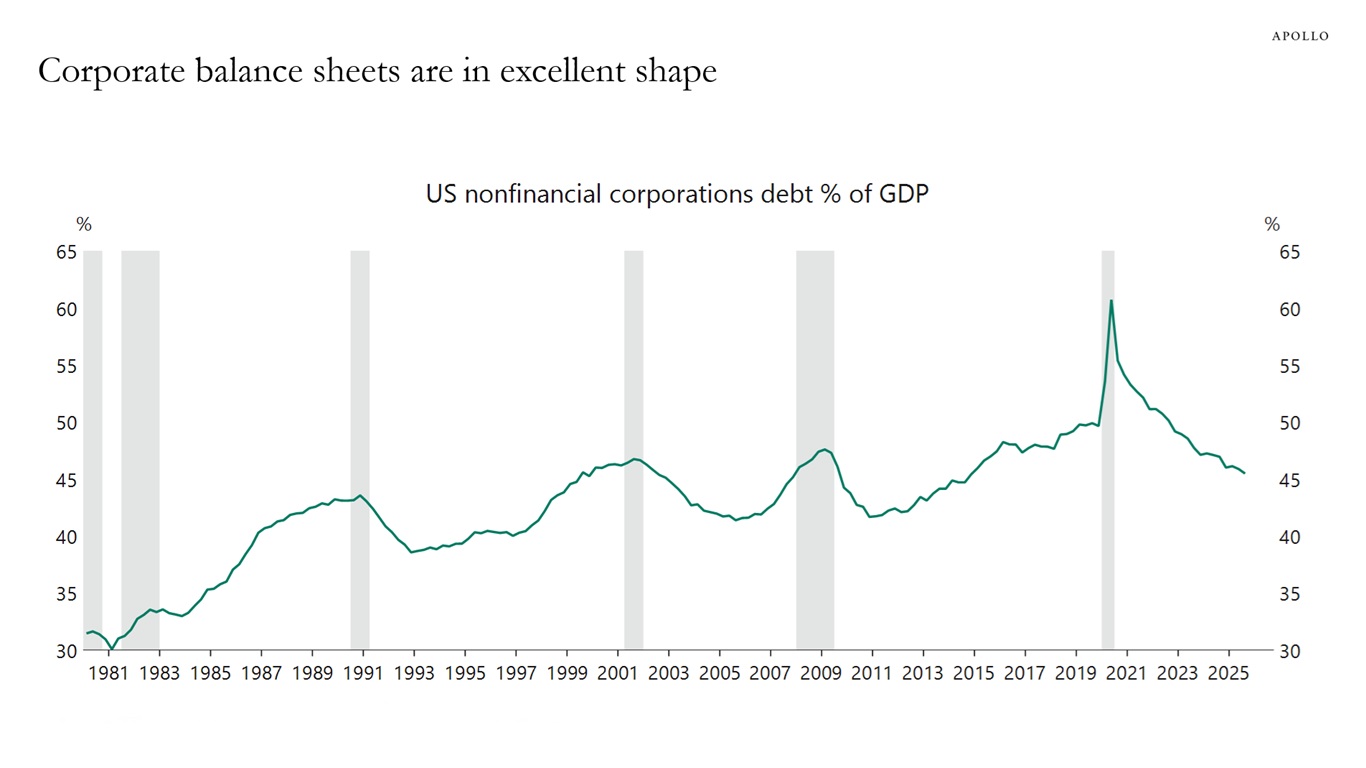
The private sector in the US is in really good shape. Households have been deleveraging since the 2008 financial crisis, see the first chart. The corporate sector has been deleveraging since COVID, see the second chart.

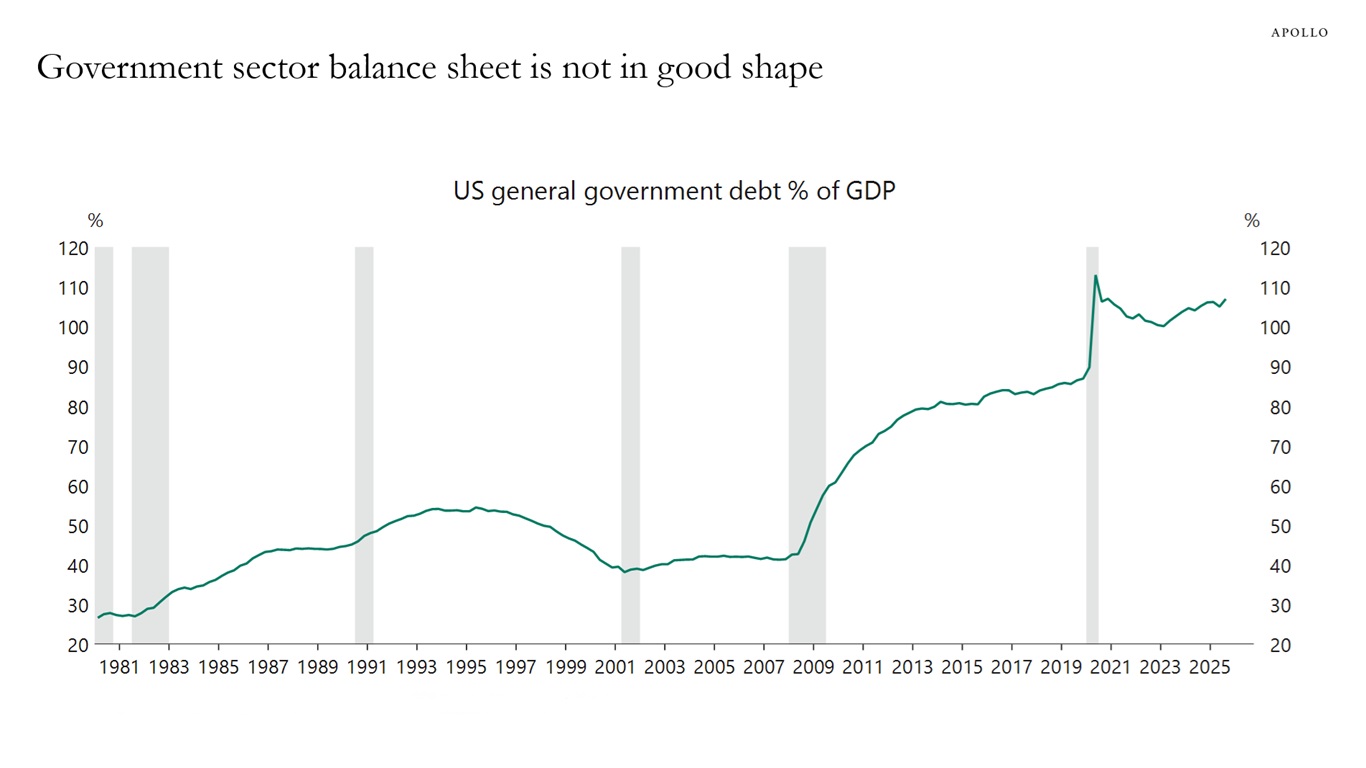
Unfortunately, the government balance sheet is not in good shape. Government debt to GDP has increased steadily from 40% of GDP in 2007 to more than 100% today, see the third chart.

Household balance sheets are in excellent shape
Sources: Federal Reserve, US Bureau of Economic Analysis (BEA), Macrobond, Apollo Chief Economist
Corporate balance sheets are in excellent shape
Sources: Federal Reserve, US Bureau of Economic Analysis (BEA), Macrobond, Apollo Chief Economist
Government sector balance sheet is not in good shape
Sources: Federal Reserve, US Bureau of Economic Analysis (BEA), Macrobond, Apollo Chief Economist

Download high-res charts

Recent Posts

  • Strong Net Foreign Buying of US Assets
  • Average Tenure of Companies in the S&P 500 Index: 15 Years
  • Fed Pricing Reveals Market Expectations About the AI Adoption Pace
  • After 60/40: In Private Markets, Manager Selection Matters
  • Equity Market Trading Volumes Rising

Recent Comments

No comments to show.

Archives

  • March 2026
  • February 2026
  • January 2026
  • December 2025
  • November 2025
  • October 2025
  • September 2025
  • August 2025
  • July 2025
  • June 2025
  • May 2025
  • April 2025
  • March 2025
  • February 2025
  • January 2025
  • December 2024
  • November 2024
  • October 2024
  • September 2024
  • August 2024
  • July 2024
  • June 2024
  • May 2024
  • April 2024
  • March 2024
  • February 2024
  • January 2024
  • December 2023
  • November 2023
  • October 2023
  • September 2023
  • August 2023
  • July 2023
  • June 2023
  • May 2023
  • April 2023
  • March 2023
  • February 2023
  • January 2023
  • December 2022
  • November 2022
  • October 2022
  • September 2022
  • August 2022
  • July 2022
  • June 2022
  • May 2022
  • April 2022
  • March 2022
  • February 2022
  • January 2022
  • December 2021
  • November 2021

Categories

  • Apollo Answers
  • Course Introductions
  • Economic Intelligence
  • Hide from Wordpress Search
  • Investment Knowledge
  • Perspectives
  • Redirecting
  • The Daily Spark
  • The View from Apollo
  • The Weekly Brief
  • Uncategorized
  • White Papers

Dramatic Increase in the Number of Unicorns

A unicorn is a privately owned company valued at more than $1 billion, and over the past decade, the number of unicorns has increased from 114 to 857, see chart below.

With a growing number of privately owned large companies, today there is a bigger need than ever before for private debt and equity solutions for both performing and distressed firms.

Dramatic increase in the number of unicorns over the past decade
Note: The term unicorn describes startups that are privately held and valued at more than $1 billion. Sources: PitchBook, Apollo Chief Economist

Download high-res chart

Recent Posts

  • Strong Net Foreign Buying of US Assets
  • Average Tenure of Companies in the S&P 500 Index: 15 Years
  • Fed Pricing Reveals Market Expectations About the AI Adoption Pace
  • After 60/40: In Private Markets, Manager Selection Matters
  • Equity Market Trading Volumes Rising

Recent Comments

No comments to show.

Archives

  • March 2026
  • February 2026
  • January 2026
  • December 2025
  • November 2025
  • October 2025
  • September 2025
  • August 2025
  • July 2025
  • June 2025
  • May 2025
  • April 2025
  • March 2025
  • February 2025
  • January 2025
  • December 2024
  • November 2024
  • October 2024
  • September 2024
  • August 2024
  • July 2024
  • June 2024
  • May 2024
  • April 2024
  • March 2024
  • February 2024
  • January 2024
  • December 2023
  • November 2023
  • October 2023
  • September 2023
  • August 2023
  • July 2023
  • June 2023
  • May 2023
  • April 2023
  • March 2023
  • February 2023
  • January 2023
  • December 2022
  • November 2022
  • October 2022
  • September 2022
  • August 2022
  • July 2022
  • June 2022
  • May 2022
  • April 2022
  • March 2022
  • February 2022
  • January 2022
  • December 2021
  • November 2021

Categories

  • Apollo Answers
  • Course Introductions
  • Economic Intelligence
  • Hide from Wordpress Search
  • Investment Knowledge
  • Perspectives
  • Redirecting
  • The Daily Spark
  • The View from Apollo
  • The Weekly Brief
  • Uncategorized
  • White Papers
The View from Apollo - A New Podcast Series

Allocation Insights: Asset-Backed Finance Is the Engine Behind Private Credit’s Next Chapter

Private markets are playing a growing role in wealth portfolios. And understanding where opportunities are emerging has never been more important.

In this episode of The View from Apollo, we introduce Allocation Insights, a recurring series focused on how private markets are reshaping wealth portfolios. To kick off the series, hosts Alex Wright and Diana Sands are joined by Partner and Global Head of Structured Credit Investing Michael Paniwozik to discuss one of the fastest-growing areas of private markets: asset-backed finance.

They break down what asset-backed finance is, why it’s gaining momentum, and why investors are paying attention.

Recent Posts

  • Strong Net Foreign Buying of US Assets
  • Average Tenure of Companies in the S&P 500 Index: 15 Years
  • Fed Pricing Reveals Market Expectations About the AI Adoption Pace
  • After 60/40: In Private Markets, Manager Selection Matters
  • Equity Market Trading Volumes Rising

Recent Comments

No comments to show.

Archives

  • March 2026
  • February 2026
  • January 2026
  • December 2025
  • November 2025
  • October 2025
  • September 2025
  • August 2025
  • July 2025
  • June 2025
  • May 2025
  • April 2025
  • March 2025
  • February 2025
  • January 2025
  • December 2024
  • November 2024
  • October 2024
  • September 2024
  • August 2024
  • July 2024
  • June 2024
  • May 2024
  • April 2024
  • March 2024
  • February 2024
  • January 2024
  • December 2023
  • November 2023
  • October 2023
  • September 2023
  • August 2023
  • July 2023
  • June 2023
  • May 2023
  • April 2023
  • March 2023
  • February 2023
  • January 2023
  • December 2022
  • November 2022
  • October 2022
  • September 2022
  • August 2022
  • July 2022
  • June 2022
  • May 2022
  • April 2022
  • March 2022
  • February 2022
  • January 2022
  • December 2021
  • November 2021

Categories

  • Apollo Answers
  • Course Introductions
  • Economic Intelligence
  • Hide from Wordpress Search
  • Investment Knowledge
  • Perspectives
  • Redirecting
  • The Daily Spark
  • The View from Apollo
  • The Weekly Brief
  • Uncategorized
  • White Papers

90% of Bonds Outstanding Yield Less Than 5%

Looking at the entire global universe of public bonds outstanding shows that almost 90% trade at a yield lower than 5%, see chart below.

With inflation at close to 3%, this means that investors in public fixed income only get a 2% real return each year.

Roughly 90% of bonds in the world trade at a yield lower than 5%
Sources: Bloomberg, Apollo Chief Economist

Download high-res chart

Recent Posts

  • Strong Net Foreign Buying of US Assets
  • Average Tenure of Companies in the S&P 500 Index: 15 Years
  • Fed Pricing Reveals Market Expectations About the AI Adoption Pace
  • After 60/40: In Private Markets, Manager Selection Matters
  • Equity Market Trading Volumes Rising

Recent Comments

No comments to show.

Archives

  • March 2026
  • February 2026
  • January 2026
  • December 2025
  • November 2025
  • October 2025
  • September 2025
  • August 2025
  • July 2025
  • June 2025
  • May 2025
  • April 2025
  • March 2025
  • February 2025
  • January 2025
  • December 2024
  • November 2024
  • October 2024
  • September 2024
  • August 2024
  • July 2024
  • June 2024
  • May 2024
  • April 2024
  • March 2024
  • February 2024
  • January 2024
  • December 2023
  • November 2023
  • October 2023
  • September 2023
  • August 2023
  • July 2023
  • June 2023
  • May 2023
  • April 2023
  • March 2023
  • February 2023
  • January 2023
  • December 2022
  • November 2022
  • October 2022
  • September 2022
  • August 2022
  • July 2022
  • June 2022
  • May 2022
  • April 2022
  • March 2022
  • February 2022
  • January 2022
  • December 2021
  • November 2021

Categories

  • Apollo Answers
  • Course Introductions
  • Economic Intelligence
  • Hide from Wordpress Search
  • Investment Knowledge
  • Perspectives
  • Redirecting
  • The Daily Spark
  • The View from Apollo
  • The Weekly Brief
  • Uncategorized
  • White Papers

Japan’s Demographic Squeeze Keeps Getting Worse: More Deaths, Fewer Births

Japan’s population growth has slowed and moved into sustained decline, as births continue to fall and the demographic gap widens.

Japan: 700,000 people are born every year. And 1.6 million people die every year.
Sources: Japanese Ministry of Health, Labour & Welfare; Macrobond; Apollo Chief Economist

Download high-res chart

Recent Posts

  • Strong Net Foreign Buying of US Assets
  • Average Tenure of Companies in the S&P 500 Index: 15 Years
  • Fed Pricing Reveals Market Expectations About the AI Adoption Pace
  • After 60/40: In Private Markets, Manager Selection Matters
  • Equity Market Trading Volumes Rising

Recent Comments

No comments to show.

Archives

  • March 2026
  • February 2026
  • January 2026
  • December 2025
  • November 2025
  • October 2025
  • September 2025
  • August 2025
  • July 2025
  • June 2025
  • May 2025
  • April 2025
  • March 2025
  • February 2025
  • January 2025
  • December 2024
  • November 2024
  • October 2024
  • September 2024
  • August 2024
  • July 2024
  • June 2024
  • May 2024
  • April 2024
  • March 2024
  • February 2024
  • January 2024
  • December 2023
  • November 2023
  • October 2023
  • September 2023
  • August 2023
  • July 2023
  • June 2023
  • May 2023
  • April 2023
  • March 2023
  • February 2023
  • January 2023
  • December 2022
  • November 2022
  • October 2022
  • September 2022
  • August 2022
  • July 2022
  • June 2022
  • May 2022
  • April 2022
  • March 2022
  • February 2022
  • January 2022
  • December 2021
  • November 2021

Categories

  • Apollo Answers
  • Course Introductions
  • Economic Intelligence
  • Hide from Wordpress Search
  • Investment Knowledge
  • Perspectives
  • Redirecting
  • The Daily Spark
  • The View from Apollo
  • The Weekly Brief
  • Uncategorized
  • White Papers

US Public Equities 40% More Expensive than Non-US Equities

After the Global Financial Crisis (GFC), the P/E ratio for US equities was similar to that of the rest of the world, but the surge in tech valuations has now pushed the US P/E ratio 40% higher, see chart below.

US P/E ratio is 40% higher than the P/E ratio for world ex-US
Note: US=SPX Index, World ex-US=MSCI World ex-USA Index. Sources: Bloomberg, Macrobond, Apollo Chief Economist

Download high-res chart

Recent Posts

  • Strong Net Foreign Buying of US Assets
  • Average Tenure of Companies in the S&P 500 Index: 15 Years
  • Fed Pricing Reveals Market Expectations About the AI Adoption Pace
  • After 60/40: In Private Markets, Manager Selection Matters
  • Equity Market Trading Volumes Rising

Recent Comments

No comments to show.

Archives

  • March 2026
  • February 2026
  • January 2026
  • December 2025
  • November 2025
  • October 2025
  • September 2025
  • August 2025
  • July 2025
  • June 2025
  • May 2025
  • April 2025
  • March 2025
  • February 2025
  • January 2025
  • December 2024
  • November 2024
  • October 2024
  • September 2024
  • August 2024
  • July 2024
  • June 2024
  • May 2024
  • April 2024
  • March 2024
  • February 2024
  • January 2024
  • December 2023
  • November 2023
  • October 2023
  • September 2023
  • August 2023
  • July 2023
  • June 2023
  • May 2023
  • April 2023
  • March 2023
  • February 2023
  • January 2023
  • December 2022
  • November 2022
  • October 2022
  • September 2022
  • August 2022
  • July 2022
  • June 2022
  • May 2022
  • April 2022
  • March 2022
  • February 2022
  • January 2022
  • December 2021
  • November 2021

Categories

  • Apollo Answers
  • Course Introductions
  • Economic Intelligence
  • Hide from Wordpress Search
  • Investment Knowledge
  • Perspectives
  • Redirecting
  • The Daily Spark
  • The View from Apollo
  • The Weekly Brief
  • Uncategorized
  • White Papers

Waiting for the AI J-Curve

The Nobel Prize–winning economist Robert Solow said in 1987, “You can see the computer age everywhere but in the productivity statistics.” This observation is the so‑called Solow productivity paradox.

The same can be said today: AI is everywhere except in the incoming macroeconomic data.

Today, you don’t see AI in the employment data, productivity data or inflation data. Similarly, for the S&P 493, there are no signs of AI in profit margins or earnings expectations.

Maybe there is a J‑curve effect for AI, where it takes time for AI to show up in the macro data. Maybe not.

Whether there is a J-curve effect depends on the value creation from AI. There is fierce competition between the builders of large language models (LLMs), which is driving the price of LLMs toward zero for end-users. This is the opposite of what the finance textbook says, namely that an innovator will have monopoly pricing power until others arrive with a similar product. This is what we saw during the computer age in the 1980s. 

In other words, from a macro perspective, the value creation is not the product, but how generative AI is used and implemented in different sectors in the economy. The academic literature is still inconclusive about the potential macro effects of AI, see table below. 

After three years with ChatGPT and still no signs of AI in the incoming data, it looks like AI will likely be labor enhancing in some sectors rather than labor replacing in all sectors. 

Academic studies inconclusive about the impact of AI on productivity
Source: Apollo Chief Economist

Download high-res table

Recent Posts

  • Strong Net Foreign Buying of US Assets
  • Average Tenure of Companies in the S&P 500 Index: 15 Years
  • Fed Pricing Reveals Market Expectations About the AI Adoption Pace
  • After 60/40: In Private Markets, Manager Selection Matters
  • Equity Market Trading Volumes Rising

Recent Comments

No comments to show.

Archives

  • March 2026
  • February 2026
  • January 2026
  • December 2025
  • November 2025
  • October 2025
  • September 2025
  • August 2025
  • July 2025
  • June 2025
  • May 2025
  • April 2025
  • March 2025
  • February 2025
  • January 2025
  • December 2024
  • November 2024
  • October 2024
  • September 2024
  • August 2024
  • July 2024
  • June 2024
  • May 2024
  • April 2024
  • March 2024
  • February 2024
  • January 2024
  • December 2023
  • November 2023
  • October 2023
  • September 2023
  • August 2023
  • July 2023
  • June 2023
  • May 2023
  • April 2023
  • March 2023
  • February 2023
  • January 2023
  • December 2022
  • November 2022
  • October 2022
  • September 2022
  • August 2022
  • July 2022
  • June 2022
  • May 2022
  • April 2022
  • March 2022
  • February 2022
  • January 2022
  • December 2021
  • November 2021

Categories

  • Apollo Answers
  • Course Introductions
  • Economic Intelligence
  • Hide from Wordpress Search
  • Investment Knowledge
  • Perspectives
  • Redirecting
  • The Daily Spark
  • The View from Apollo
  • The Weekly Brief
  • Uncategorized
  • White Papers

More FDI Out of China

For many years, the rest of the world invested significant amounts in China to build factories and assembly lines.

But that has changed in recent years.

China now invests more abroad than the rest of the world invests in China, see chart below.

China now invests more abroad than it receives in foreign investment
Sources: China Ministry of Commerce, Macrobond, Apollo Chief Economist

Download high-res chart

Recent Posts

  • Strong Net Foreign Buying of US Assets
  • Average Tenure of Companies in the S&P 500 Index: 15 Years
  • Fed Pricing Reveals Market Expectations About the AI Adoption Pace
  • After 60/40: In Private Markets, Manager Selection Matters
  • Equity Market Trading Volumes Rising

Recent Comments

No comments to show.

Archives

  • March 2026
  • February 2026
  • January 2026
  • December 2025
  • November 2025
  • October 2025
  • September 2025
  • August 2025
  • July 2025
  • June 2025
  • May 2025
  • April 2025
  • March 2025
  • February 2025
  • January 2025
  • December 2024
  • November 2024
  • October 2024
  • September 2024
  • August 2024
  • July 2024
  • June 2024
  • May 2024
  • April 2024
  • March 2024
  • February 2024
  • January 2024
  • December 2023
  • November 2023
  • October 2023
  • September 2023
  • August 2023
  • July 2023
  • June 2023
  • May 2023
  • April 2023
  • March 2023
  • February 2023
  • January 2023
  • December 2022
  • November 2022
  • October 2022
  • September 2022
  • August 2022
  • July 2022
  • June 2022
  • May 2022
  • April 2022
  • March 2022
  • February 2022
  • January 2022
  • December 2021
  • November 2021

Categories

  • Apollo Answers
  • Course Introductions
  • Economic Intelligence
  • Hide from Wordpress Search
  • Investment Knowledge
  • Perspectives
  • Redirecting
  • The Daily Spark
  • The View from Apollo
  • The Weekly Brief
  • Uncategorized
  • White Papers

No Signs of Profit Margins Going Up Outside of Tech

There are no signs of AI boosting profit margins for companies outside the tech sector, see chart below.

No signs of profit margins going up outside of the tech sector
Sources: Bloomberg, Macrobond, Apollo Chief Economist

Download high-res chart

Recent Posts

  • Strong Net Foreign Buying of US Assets
  • Average Tenure of Companies in the S&P 500 Index: 15 Years
  • Fed Pricing Reveals Market Expectations About the AI Adoption Pace
  • After 60/40: In Private Markets, Manager Selection Matters
  • Equity Market Trading Volumes Rising

Recent Comments

No comments to show.

Archives

  • March 2026
  • February 2026
  • January 2026
  • December 2025
  • November 2025
  • October 2025
  • September 2025
  • August 2025
  • July 2025
  • June 2025
  • May 2025
  • April 2025
  • March 2025
  • February 2025
  • January 2025
  • December 2024
  • November 2024
  • October 2024
  • September 2024
  • August 2024
  • July 2024
  • June 2024
  • May 2024
  • April 2024
  • March 2024
  • February 2024
  • January 2024
  • December 2023
  • November 2023
  • October 2023
  • September 2023
  • August 2023
  • July 2023
  • June 2023
  • May 2023
  • April 2023
  • March 2023
  • February 2023
  • January 2023
  • December 2022
  • November 2022
  • October 2022
  • September 2022
  • August 2022
  • July 2022
  • June 2022
  • May 2022
  • April 2022
  • March 2022
  • February 2022
  • January 2022
  • December 2021
  • November 2021

Categories

  • Apollo Answers
  • Course Introductions
  • Economic Intelligence
  • Hide from Wordpress Search
  • Investment Knowledge
  • Perspectives
  • Redirecting
  • The Daily Spark
  • The View from Apollo
  • The Weekly Brief
  • Uncategorized
  • White Papers

10-Year Yields Should Be Higher

The incoming data has surprised significantly to the upside in recent weeks, but long rates have not moved higher, see chart below.

Economic surprise index points to much higher long rates ahead
Sources: US Department of Treasury, Bloomberg, Macrobond, Apollo Chief Economist

Download high-res chart

Recent Posts

  • Strong Net Foreign Buying of US Assets
  • Average Tenure of Companies in the S&P 500 Index: 15 Years
  • Fed Pricing Reveals Market Expectations About the AI Adoption Pace
  • After 60/40: In Private Markets, Manager Selection Matters
  • Equity Market Trading Volumes Rising

Recent Comments

No comments to show.

Archives

  • March 2026
  • February 2026
  • January 2026
  • December 2025
  • November 2025
  • October 2025
  • September 2025
  • August 2025
  • July 2025
  • June 2025
  • May 2025
  • April 2025
  • March 2025
  • February 2025
  • January 2025
  • December 2024
  • November 2024
  • October 2024
  • September 2024
  • August 2024
  • July 2024
  • June 2024
  • May 2024
  • April 2024
  • March 2024
  • February 2024
  • January 2024
  • December 2023
  • November 2023
  • October 2023
  • September 2023
  • August 2023
  • July 2023
  • June 2023
  • May 2023
  • April 2023
  • March 2023
  • February 2023
  • January 2023
  • December 2022
  • November 2022
  • October 2022
  • September 2022
  • August 2022
  • July 2022
  • June 2022
  • May 2022
  • April 2022
  • March 2022
  • February 2022
  • January 2022
  • December 2021
  • November 2021

Categories

  • Apollo Answers
  • Course Introductions
  • Economic Intelligence
  • Hide from Wordpress Search
  • Investment Knowledge
  • Perspectives
  • Redirecting
  • The Daily Spark
  • The View from Apollo
  • The Weekly Brief
  • Uncategorized
  • White Papers

Posts navigation

←Previous page Page 1 Page 2 Page 3 Next page→
  • Privacy Notice
  • Terms of Use
  • Forward-Looking Statements
Apollo
© Apollo Global Management, Inc. All Rights Reserved.

The Apollo Academy is for informational and educational purposes only and nothing contained herein should be taken as investment advice or a recommendation to enter into any transaction. They are not an invitation by or on behalf of Apollo to any person to buy or sell any security or to adopt any investment strategy, and shall not form the basis of, nor may it accompany nor form part of, any right or contract to buy or sell any security or to adopt any investment strategy. There is no guarantee that the views and opinions expressed in this website will come to pass. For additional information, please see the disclaimers included in each piece of content or the legal page of our website here.