• Apollo.com
  • Login
  • Register Now
light site-logo
  • The Academy
  • Upcoming Events
        • Upcoming Events

        • 2026 OutlookTuesday, December 16, 2025 • 11:00am ET
  • Learning Center
        • New & UpdatedAlternative Investing Course 2.0

        • Alternative Investing Essentials Part OnePrivate Equity, Venture Capital, Private Credit
        • Alternative Investing Essentials Part TwoReal Estate, Infrastructure, Digital Assets, Hedge Funds
        • Practical ConsiderationsAsset Allocation, Risk Considerations, Fund Structures, Fees
        • Introductory Videos

          View All Videos

        •  Recent Classes & Videos

        • • Private Equity’s Edge: Delivering Alpha in a Changing Market
        • • Powering Innovation: Infrastructure Investing Across the AI Value Chain
        • • Mid-Year Outlook: At the Crossroads of Stagflation — What’s Next?
        • • Hybrid Investments: Flexible Structures for Volatile Times
        • • Private Credit Investing in Volatile Times
        • • Potential Implications of the Latest US Administration Policy Proposals
        • View All Classes

  • Alternative Perspectives
        • Investment Knowledge
        • The View from Apollo
          • Investment Knowledge White Papers

            The Financing Gap in Sports: Unlocking a $2.5 Trillion Opportunity

            December 12, 2025
          • The View From Apollo

            Private Equity: Alpha in an Evolving Market

            November 24, 2025
          • Investment Knowledge

            Hybrid in Action: Delivering Bespoke Capital Solutions in a New Market Paradigm

            December 4, 2025
  • The Daily Spark
        • Read The Daily Spark Blog


        • Want it delivered daily to your inbox?
          • The Daily Spark

            Strong Technical Demand for Credit

            December 15, 2025
          • The Daily Spark

            Fiscal Situation in Germany vs. Spain

            December 14, 2025
          • The Daily Spark

            Hedge Fund Leverage Rising Rapidly

            December 13, 2025
  • Register for Apollo Academy: Alternative Investing Course
  • Login
  • About Apollo Academy
  • Upcoming Events
  • Learning Center
  • Alternative Perspectives
  • The Daily Spark
  • Register for Apollo Academy: Alternative Investing Course
  • Login
  • 2026 Outlook
  • Alternative Investing Course 2.0
  • Private Equity’s Edge: Delivering Alpha in a Changing Market
  • Powering Innovation: Infrastructure Investing Across the AI Value Chain
  • Mid-Year Outlook: At the Crossroads of Stagflation — What’s Next?
  • Hybrid Investments: Flexible Structures for Volatile Times
  • Private Credit Investing in Volatile Times
  • Potential Implications of the Latest US Administration Policy Proposals
  • View All Classes
  • Introductory Videos
  • Alternative Investing Essentials Part One • Now Available On Demand
  • Alternative Investing Essentials Part Two • Now Available On Demand
  • Practical Considerations • Now Available On Demand
  • Investment Knowledge
  • The View from Apollo
Home February 2024

China: Number of Births Declining

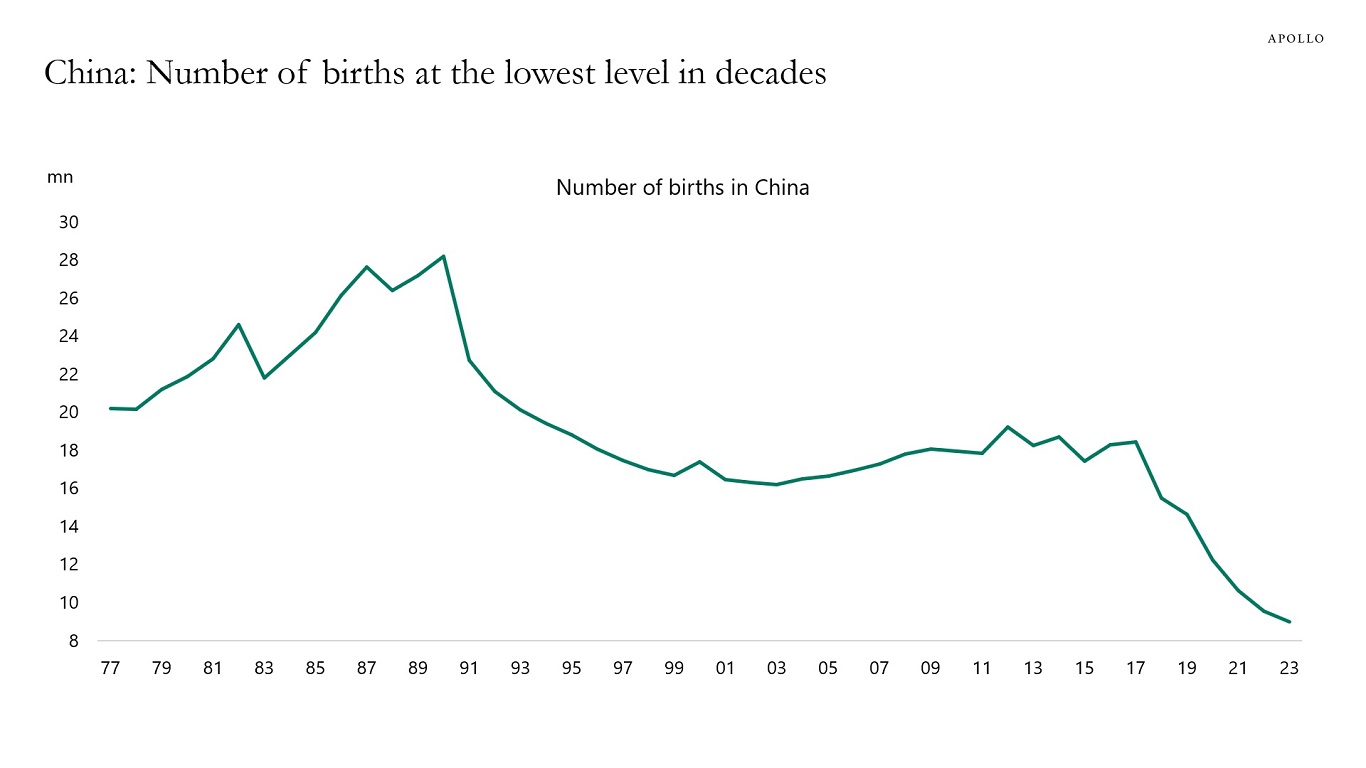
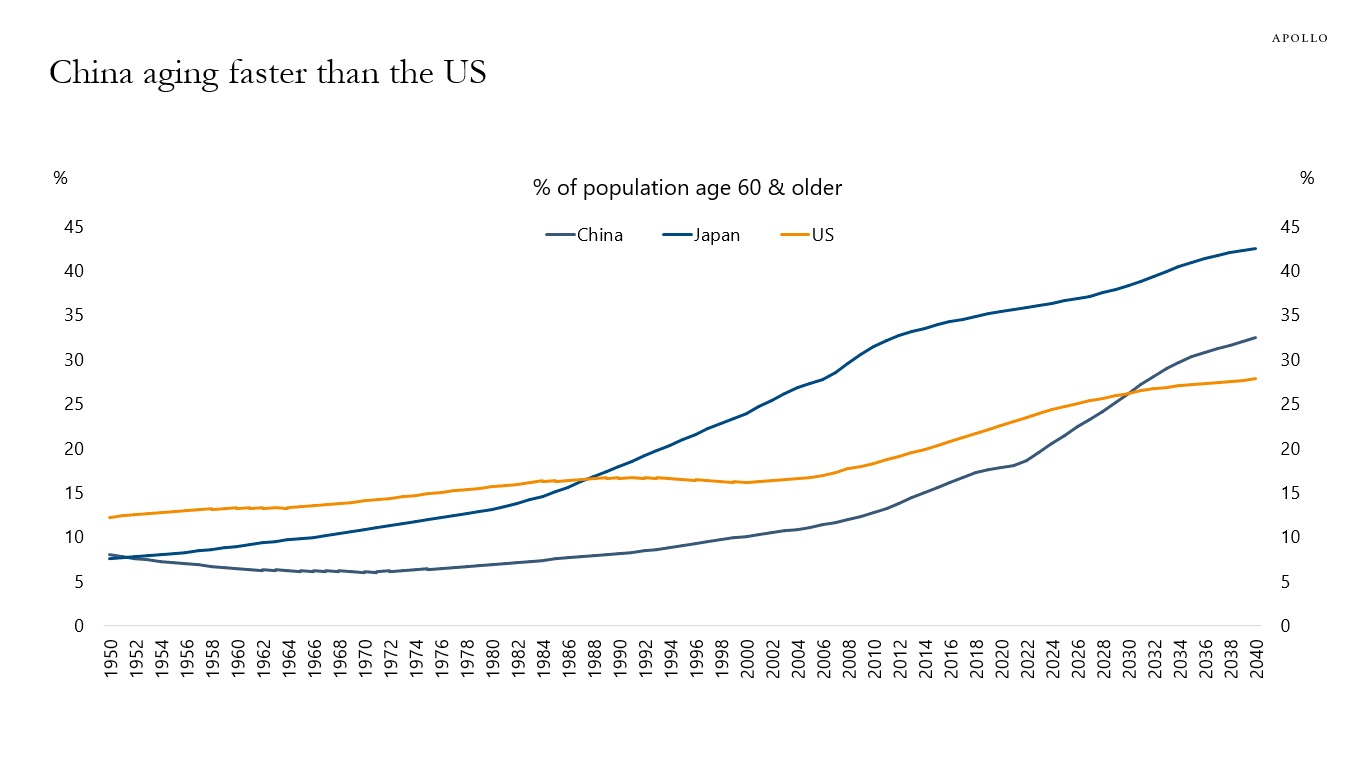
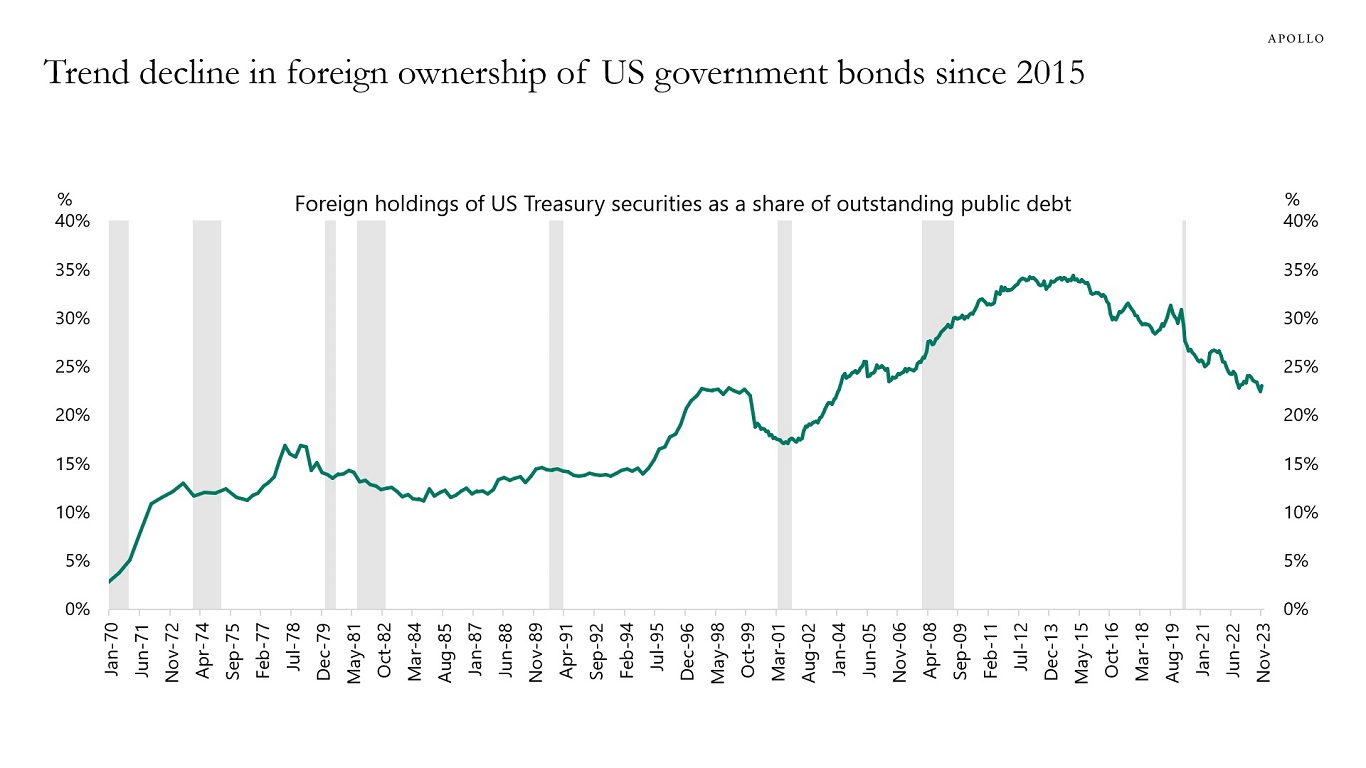
China began its one-child policy in 1980 and ended it in 2016. In 2021, it started its three-child policy, encouraging couples to have three children. The UN projects that China’s population will decline from 1.4 billion today to 800 million by the end of this century. China’s demographic headwinds have significant implications for growth, savings, and FX reserve accumulation and, therefore, Chinese appetite for buying US Treasuries.

China: Number of births at the lowest level in decades
Source: UN, National Bureau of Statistics of China, Apollo Chief Economist

Download hi-res chart(s)

Recent Posts

  • Strong Technical Demand for Credit
  • Fiscal Situation in Germany vs. Spain
  • Hedge Fund Leverage Rising Rapidly
  • The Financing Gap in Sports: Unlocking a $2.5 Trillion Opportunity
  • The US Retirement Crisis

Recent Comments

No comments to show.

Archives

  • December 2025
  • November 2025
  • October 2025
  • September 2025
  • August 2025
  • July 2025
  • June 2025
  • May 2025
  • April 2025
  • March 2025
  • February 2025
  • January 2025
  • December 2024
  • November 2024
  • October 2024
  • September 2024
  • August 2024
  • July 2024
  • June 2024
  • May 2024
  • April 2024
  • March 2024
  • February 2024
  • January 2024
  • December 2023
  • November 2023
  • October 2023
  • September 2023
  • August 2023
  • July 2023
  • June 2023
  • May 2023
  • April 2023
  • March 2023
  • February 2023
  • January 2023
  • December 2022
  • November 2022
  • October 2022
  • September 2022
  • August 2022
  • July 2022
  • June 2022
  • May 2022
  • April 2022
  • March 2022
  • February 2022
  • January 2022
  • December 2021
  • November 2021

Categories

  • Apollo Answers
  • Course Introductions
  • Economic Intelligence
  • Hide from Wordpress Search
  • Investment Knowledge
  • Perspectives
  • Redirecting
  • The Daily Spark
  • The View from Apollo
  • The Weekly Brief
  • Uncategorized
  • White Papers

US Housing Outlook

Our latest outlook for the housing market is available here, key charts below.

US Housing Outlook
A housing recovery has been driven by
Source: Apollo Chief Economist
Home price inflation rebounding
Source: Haver Analytics, BLS, S&P, Apollo Chief Economist
100 largest US cities: Share of cities with positive rent growth is rising
Source: Apartmentlist.com, Apollo Chief Economist
Very low inventory of homes for sale
Source: Realtor.com, Apollo Chief Economist
ARM share of total mortgage applications has declined recently
Source: MBA, Bloomberg, Apollo Chief Economist (Note: It is 5-year ARM)
Total housing inventory per person continues to decline
Source: Census Bureau, FRED, Apollo Chief Economist

Download high-res chart(s)

Recent Posts

  • Strong Technical Demand for Credit
  • Fiscal Situation in Germany vs. Spain
  • Hedge Fund Leverage Rising Rapidly
  • The Financing Gap in Sports: Unlocking a $2.5 Trillion Opportunity
  • The US Retirement Crisis

Recent Comments

No comments to show.

Archives

  • December 2025
  • November 2025
  • October 2025
  • September 2025
  • August 2025
  • July 2025
  • June 2025
  • May 2025
  • April 2025
  • March 2025
  • February 2025
  • January 2025
  • December 2024
  • November 2024
  • October 2024
  • September 2024
  • August 2024
  • July 2024
  • June 2024
  • May 2024
  • April 2024
  • March 2024
  • February 2024
  • January 2024
  • December 2023
  • November 2023
  • October 2023
  • September 2023
  • August 2023
  • July 2023
  • June 2023
  • May 2023
  • April 2023
  • March 2023
  • February 2023
  • January 2023
  • December 2022
  • November 2022
  • October 2022
  • September 2022
  • August 2022
  • July 2022
  • June 2022
  • May 2022
  • April 2022
  • March 2022
  • February 2022
  • January 2022
  • December 2021
  • November 2021

Categories

  • Apollo Answers
  • Course Introductions
  • Economic Intelligence
  • Hide from Wordpress Search
  • Investment Knowledge
  • Perspectives
  • Redirecting
  • The Daily Spark
  • The View from Apollo
  • The Weekly Brief
  • Uncategorized
  • White Papers

Outlook for Banks

Our updated banking sector chart book is available here, key charts below.

Outlook for US regional banks
US banks hold half of CRE debt outstanding
Source: S&P Capital IQ, Apollo Chief Economist
Small banks account for almost 70% of all commercial real estate loans outstanding
Source: Federal Reserve Board, Haver Analytics, Apollo Chief Economist
Banks with total assets between $100 million and $10 billion are more exposed to CRE loans
Source: FDIC, Apollo Chief Economist
Non-owner-occupied CRE past-due and noncurrent loans
Source: FDIC, Apollo Chief Economist. (PDNA stands for Past Due and Non-Accrual rate defined as loans that are past due and are in non-accrual status.)
Important differences between regional banks and money center banks
Source: FRB, Haver Analytics, Apollo Chief Economist

Download high-res chart(s)

Recent Posts

  • Strong Technical Demand for Credit
  • Fiscal Situation in Germany vs. Spain
  • Hedge Fund Leverage Rising Rapidly
  • The Financing Gap in Sports: Unlocking a $2.5 Trillion Opportunity
  • The US Retirement Crisis

Recent Comments

No comments to show.

Archives

  • December 2025
  • November 2025
  • October 2025
  • September 2025
  • August 2025
  • July 2025
  • June 2025
  • May 2025
  • April 2025
  • March 2025
  • February 2025
  • January 2025
  • December 2024
  • November 2024
  • October 2024
  • September 2024
  • August 2024
  • July 2024
  • June 2024
  • May 2024
  • April 2024
  • March 2024
  • February 2024
  • January 2024
  • December 2023
  • November 2023
  • October 2023
  • September 2023
  • August 2023
  • July 2023
  • June 2023
  • May 2023
  • April 2023
  • March 2023
  • February 2023
  • January 2023
  • December 2022
  • November 2022
  • October 2022
  • September 2022
  • August 2022
  • July 2022
  • June 2022
  • May 2022
  • April 2022
  • March 2022
  • February 2022
  • January 2022
  • December 2021
  • November 2021

Categories

  • Apollo Answers
  • Course Introductions
  • Economic Intelligence
  • Hide from Wordpress Search
  • Investment Knowledge
  • Perspectives
  • Redirecting
  • The Daily Spark
  • The View from Apollo
  • The Weekly Brief
  • Uncategorized
  • White Papers

Outlook for China

About 18% of China’s population is older than 60. Over the coming decades, that share will rise to 32%, higher than in the US, see chart below. Our latest outlook for China is available here.

China aging faster than the US
Source: UN, Haver Analytics, Apollo Chief Economist

Download high-res chart(s)

Recent Posts

  • Strong Technical Demand for Credit
  • Fiscal Situation in Germany vs. Spain
  • Hedge Fund Leverage Rising Rapidly
  • The Financing Gap in Sports: Unlocking a $2.5 Trillion Opportunity
  • The US Retirement Crisis

Recent Comments

No comments to show.

Archives

  • December 2025
  • November 2025
  • October 2025
  • September 2025
  • August 2025
  • July 2025
  • June 2025
  • May 2025
  • April 2025
  • March 2025
  • February 2025
  • January 2025
  • December 2024
  • November 2024
  • October 2024
  • September 2024
  • August 2024
  • July 2024
  • June 2024
  • May 2024
  • April 2024
  • March 2024
  • February 2024
  • January 2024
  • December 2023
  • November 2023
  • October 2023
  • September 2023
  • August 2023
  • July 2023
  • June 2023
  • May 2023
  • April 2023
  • March 2023
  • February 2023
  • January 2023
  • December 2022
  • November 2022
  • October 2022
  • September 2022
  • August 2022
  • July 2022
  • June 2022
  • May 2022
  • April 2022
  • March 2022
  • February 2022
  • January 2022
  • December 2021
  • November 2021

Categories

  • Apollo Answers
  • Course Introductions
  • Economic Intelligence
  • Hide from Wordpress Search
  • Investment Knowledge
  • Perspectives
  • Redirecting
  • The Daily Spark
  • The View from Apollo
  • The Weekly Brief
  • Uncategorized
  • White Papers

Comparing Sources of Financing for Corporates

Comparing the growth in private credit with the growth in other sources of financing for corporates shows that private credit has been growing much slower than public credit and credit extended by banks, see chart below.

Since 2020, private credit has been growing much slower than public credit and bank lending
Source: FRB, ICE BofA, Bloomberg, Preqin, Apollo Chief Economist. (Note: Public credit markets include HY, IG, and leveraged loans. Bank lending includes loans & leases in bank credit. All commercial banks and private credit is dry powder + unrealized value/NAV of all the funds in the private debt space.)

Download high-res chart(s)

Recent Posts

  • Strong Technical Demand for Credit
  • Fiscal Situation in Germany vs. Spain
  • Hedge Fund Leverage Rising Rapidly
  • The Financing Gap in Sports: Unlocking a $2.5 Trillion Opportunity
  • The US Retirement Crisis

Recent Comments

No comments to show.

Archives

  • December 2025
  • November 2025
  • October 2025
  • September 2025
  • August 2025
  • July 2025
  • June 2025
  • May 2025
  • April 2025
  • March 2025
  • February 2025
  • January 2025
  • December 2024
  • November 2024
  • October 2024
  • September 2024
  • August 2024
  • July 2024
  • June 2024
  • May 2024
  • April 2024
  • March 2024
  • February 2024
  • January 2024
  • December 2023
  • November 2023
  • October 2023
  • September 2023
  • August 2023
  • July 2023
  • June 2023
  • May 2023
  • April 2023
  • March 2023
  • February 2023
  • January 2023
  • December 2022
  • November 2022
  • October 2022
  • September 2022
  • August 2022
  • July 2022
  • June 2022
  • May 2022
  • April 2022
  • March 2022
  • February 2022
  • January 2022
  • December 2021
  • November 2021

Categories

  • Apollo Answers
  • Course Introductions
  • Economic Intelligence
  • Hide from Wordpress Search
  • Investment Knowledge
  • Perspectives
  • Redirecting
  • The Daily Spark
  • The View from Apollo
  • The Weekly Brief
  • Uncategorized
  • White Papers

Average Number of People per Household Declining

The average number of people per household continues to decline, see chart below.

The average family size in the US has declined from 3.3 in 1960 to 2.5 in 2023
Source: Census Bureau, Apollo Chief Economist

Download high-res chart(s)

Recent Posts

  • Strong Technical Demand for Credit
  • Fiscal Situation in Germany vs. Spain
  • Hedge Fund Leverage Rising Rapidly
  • The Financing Gap in Sports: Unlocking a $2.5 Trillion Opportunity
  • The US Retirement Crisis

Recent Comments

No comments to show.

Archives

  • December 2025
  • November 2025
  • October 2025
  • September 2025
  • August 2025
  • July 2025
  • June 2025
  • May 2025
  • April 2025
  • March 2025
  • February 2025
  • January 2025
  • December 2024
  • November 2024
  • October 2024
  • September 2024
  • August 2024
  • July 2024
  • June 2024
  • May 2024
  • April 2024
  • March 2024
  • February 2024
  • January 2024
  • December 2023
  • November 2023
  • October 2023
  • September 2023
  • August 2023
  • July 2023
  • June 2023
  • May 2023
  • April 2023
  • March 2023
  • February 2023
  • January 2023
  • December 2022
  • November 2022
  • October 2022
  • September 2022
  • August 2022
  • July 2022
  • June 2022
  • May 2022
  • April 2022
  • March 2022
  • February 2022
  • January 2022
  • December 2021
  • November 2021

Categories

  • Apollo Answers
  • Course Introductions
  • Economic Intelligence
  • Hide from Wordpress Search
  • Investment Knowledge
  • Perspectives
  • Redirecting
  • The Daily Spark
  • The View from Apollo
  • The Weekly Brief
  • Uncategorized
  • White Papers

Less Consumption in December

The share of consumer spending that takes place in December has been steadily declining for decades and now makes up less than 10% of total private consumption, see chart below.

The reason is that consumers spend less money on goods and more money on services such as restaurants, hotels, airlines, concerts, and sporting events.

The share of consumer spending that takes place in December is declining
Source: Census Bureau, Haver Analytics, Apollo Chief Economist

Download high-res chart(s)

Recent Posts

  • Strong Technical Demand for Credit
  • Fiscal Situation in Germany vs. Spain
  • Hedge Fund Leverage Rising Rapidly
  • The Financing Gap in Sports: Unlocking a $2.5 Trillion Opportunity
  • The US Retirement Crisis

Recent Comments

No comments to show.

Archives

  • December 2025
  • November 2025
  • October 2025
  • September 2025
  • August 2025
  • July 2025
  • June 2025
  • May 2025
  • April 2025
  • March 2025
  • February 2025
  • January 2025
  • December 2024
  • November 2024
  • October 2024
  • September 2024
  • August 2024
  • July 2024
  • June 2024
  • May 2024
  • April 2024
  • March 2024
  • February 2024
  • January 2024
  • December 2023
  • November 2023
  • October 2023
  • September 2023
  • August 2023
  • July 2023
  • June 2023
  • May 2023
  • April 2023
  • March 2023
  • February 2023
  • January 2023
  • December 2022
  • November 2022
  • October 2022
  • September 2022
  • August 2022
  • July 2022
  • June 2022
  • May 2022
  • April 2022
  • March 2022
  • February 2022
  • January 2022
  • December 2021
  • November 2021

Categories

  • Apollo Answers
  • Course Introductions
  • Economic Intelligence
  • Hide from Wordpress Search
  • Investment Knowledge
  • Perspectives
  • Redirecting
  • The Daily Spark
  • The View from Apollo
  • The Weekly Brief
  • Uncategorized
  • White Papers

No Alpha in Public Markets

More than 50% of all ETFs and mutual funds are passive, and 37% of fixed income funds are passive, see charts below. Numerous studies show that active mutual fund managers continue to underperform their benchmark, see for example here, here, and here.

More than 50% of all ETFs and mutual funds are passive
Source: Bloomberg, Apollo Chief Economist
37% of fixed income funds are passive
Source: Bloomberg, Apollo Chief Economist

Download high-res chart(s)

Recent Posts

  • Strong Technical Demand for Credit
  • Fiscal Situation in Germany vs. Spain
  • Hedge Fund Leverage Rising Rapidly
  • The Financing Gap in Sports: Unlocking a $2.5 Trillion Opportunity
  • The US Retirement Crisis

Recent Comments

No comments to show.

Archives

  • December 2025
  • November 2025
  • October 2025
  • September 2025
  • August 2025
  • July 2025
  • June 2025
  • May 2025
  • April 2025
  • March 2025
  • February 2025
  • January 2025
  • December 2024
  • November 2024
  • October 2024
  • September 2024
  • August 2024
  • July 2024
  • June 2024
  • May 2024
  • April 2024
  • March 2024
  • February 2024
  • January 2024
  • December 2023
  • November 2023
  • October 2023
  • September 2023
  • August 2023
  • July 2023
  • June 2023
  • May 2023
  • April 2023
  • March 2023
  • February 2023
  • January 2023
  • December 2022
  • November 2022
  • October 2022
  • September 2022
  • August 2022
  • July 2022
  • June 2022
  • May 2022
  • April 2022
  • March 2022
  • February 2022
  • January 2022
  • December 2021
  • November 2021

Categories

  • Apollo Answers
  • Course Introductions
  • Economic Intelligence
  • Hide from Wordpress Search
  • Investment Knowledge
  • Perspectives
  • Redirecting
  • The Daily Spark
  • The View from Apollo
  • The Weekly Brief
  • Uncategorized
  • White Papers

$10 Trillion in US Treasuries Coming to the Market in 2024

A record $8.9 trillion of government debt will mature over the next year, see the first chart below. The government budget deficit in 2024 will be $1.4 trillion according to the CBO, and the Fed has been running down its balance sheet by $60 billion per month.

The bottom line is that someone will need to buy more than $10 trillion in US government bonds in 2024. That is more than one-third of US government debt outstanding. And more than one-third of US GDP.

This may be a particular challenge when the biggest holders of US Treasuries, namely foreigners, continue to shrink their share, see the second chart.

More fundamentally, interest rate-sensitive balance sheets such as households, pension, and insurance have been the biggest buyers of Treasuries in 2023, and the question is whether they will continue to buy once the Fed starts cutting rates.

Our updated outlook for Treasury demand is available here.

A record-high $8.9 trillion of government debt will mature over the next year
Source: Treasury, BEA, Haver Analytics, Apollo Chief Economist
Trend decline in foreign ownership of US government bonds since 2015
Source: Treasury, Haver Analytics, Apollo Chief Economist

Download hi-res chart(s)

Recent Posts

  • Strong Technical Demand for Credit
  • Fiscal Situation in Germany vs. Spain
  • Hedge Fund Leverage Rising Rapidly
  • The Financing Gap in Sports: Unlocking a $2.5 Trillion Opportunity
  • The US Retirement Crisis

Recent Comments

No comments to show.

Archives

  • December 2025
  • November 2025
  • October 2025
  • September 2025
  • August 2025
  • July 2025
  • June 2025
  • May 2025
  • April 2025
  • March 2025
  • February 2025
  • January 2025
  • December 2024
  • November 2024
  • October 2024
  • September 2024
  • August 2024
  • July 2024
  • June 2024
  • May 2024
  • April 2024
  • March 2024
  • February 2024
  • January 2024
  • December 2023
  • November 2023
  • October 2023
  • September 2023
  • August 2023
  • July 2023
  • June 2023
  • May 2023
  • April 2023
  • March 2023
  • February 2023
  • January 2023
  • December 2022
  • November 2022
  • October 2022
  • September 2022
  • August 2022
  • July 2022
  • June 2022
  • May 2022
  • April 2022
  • March 2022
  • February 2022
  • January 2022
  • December 2021
  • November 2021

Categories

  • Apollo Answers
  • Course Introductions
  • Economic Intelligence
  • Hide from Wordpress Search
  • Investment Knowledge
  • Perspectives
  • Redirecting
  • The Daily Spark
  • The View from Apollo
  • The Weekly Brief
  • Uncategorized
  • White Papers

Government Interest Payments Have Doubled since 2021

In 2021, US government interest payments were around $350 billion, see chart below.

Because of the increase in interest rates and debt levels, annualized debt servicing costs are now above $700 billion.

Government debt servicing costs have doubled since 2021
Source: US Treasury, Haver Analytics, Apollo Chief Economist

Download hi-res chart(s)

Recent Posts

  • Strong Technical Demand for Credit
  • Fiscal Situation in Germany vs. Spain
  • Hedge Fund Leverage Rising Rapidly
  • The Financing Gap in Sports: Unlocking a $2.5 Trillion Opportunity
  • The US Retirement Crisis

Recent Comments

No comments to show.

Archives

  • December 2025
  • November 2025
  • October 2025
  • September 2025
  • August 2025
  • July 2025
  • June 2025
  • May 2025
  • April 2025
  • March 2025
  • February 2025
  • January 2025
  • December 2024
  • November 2024
  • October 2024
  • September 2024
  • August 2024
  • July 2024
  • June 2024
  • May 2024
  • April 2024
  • March 2024
  • February 2024
  • January 2024
  • December 2023
  • November 2023
  • October 2023
  • September 2023
  • August 2023
  • July 2023
  • June 2023
  • May 2023
  • April 2023
  • March 2023
  • February 2023
  • January 2023
  • December 2022
  • November 2022
  • October 2022
  • September 2022
  • August 2022
  • July 2022
  • June 2022
  • May 2022
  • April 2022
  • March 2022
  • February 2022
  • January 2022
  • December 2021
  • November 2021

Categories

  • Apollo Answers
  • Course Introductions
  • Economic Intelligence
  • Hide from Wordpress Search
  • Investment Knowledge
  • Perspectives
  • Redirecting
  • The Daily Spark
  • The View from Apollo
  • The Weekly Brief
  • Uncategorized
  • White Papers

Posts navigation

←Previous page Page 1 Page 2 Page 3 Page 4 Next page→
  • Privacy Notice
  • Terms of Use
  • Forward-Looking Statements
Apollo
© Apollo Global Management, Inc. All Rights Reserved.

The Apollo Academy is for informational and educational purposes only and nothing contained herein should be taken as investment advice or a recommendation to enter into any transaction. They are not an invitation by or on behalf of Apollo to any person to buy or sell any security or to adopt any investment strategy, and shall not form the basis of, nor may it accompany nor form part of, any right or contract to buy or sell any security or to adopt any investment strategy. There is no guarantee that the views and opinions expressed in this website will come to pass. For additional information, please see the disclaimers included in each piece of content or the legal page of our website here.