• Apollo.com
  • Login
  • Register Now
light site-logo
  • The Academy
  • Upcoming Events
        • Upcoming Events

        • 2026 OutlookTuesday, December 16, 2025 • 11:00am ET
  • Learning Center
        • New & UpdatedAlternative Investing Course 2.0

        • Alternative Investing Essentials Part OnePrivate Equity, Venture Capital, Private Credit
        • Alternative Investing Essentials Part TwoReal Estate, Infrastructure, Digital Assets, Hedge Funds
        • Practical ConsiderationsAsset Allocation, Risk Considerations, Fund Structures, Fees
        • Introductory Videos

          View All Videos

        •  Recent Classes & Videos

        • • Private Equity’s Edge: Delivering Alpha in a Changing Market
        • • Powering Innovation: Infrastructure Investing Across the AI Value Chain
        • • Mid-Year Outlook: At the Crossroads of Stagflation — What’s Next?
        • • Hybrid Investments: Flexible Structures for Volatile Times
        • • Private Credit Investing in Volatile Times
        • • Potential Implications of the Latest US Administration Policy Proposals
        • View All Classes

  • Alternative Perspectives
        • Investment Knowledge
        • The View from Apollo
          • Investment Knowledge White Papers

            The Financing Gap in Sports: Unlocking a $2.5 Trillion Opportunity

            December 12, 2025
          • The View From Apollo

            Private Equity: Alpha in an Evolving Market

            November 24, 2025
          • Investment Knowledge

            Hybrid in Action: Delivering Bespoke Capital Solutions in a New Market Paradigm

            December 4, 2025
  • The Daily Spark
        • Read The Daily Spark Blog


        • Want it delivered daily to your inbox?
          • The Daily Spark

            Strong Technical Demand for Credit

            December 15, 2025
          • The Daily Spark

            Fiscal Situation in Germany vs. Spain

            December 14, 2025
          • The Daily Spark

            Hedge Fund Leverage Rising Rapidly

            December 13, 2025
  • Register for Apollo Academy: Alternative Investing Course
  • Login
  • About Apollo Academy
  • Upcoming Events
  • Learning Center
  • Alternative Perspectives
  • The Daily Spark
  • Register for Apollo Academy: Alternative Investing Course
  • Login
  • 2026 Outlook
  • Alternative Investing Course 2.0
  • Private Equity’s Edge: Delivering Alpha in a Changing Market
  • Powering Innovation: Infrastructure Investing Across the AI Value Chain
  • Mid-Year Outlook: At the Crossroads of Stagflation — What’s Next?
  • Hybrid Investments: Flexible Structures for Volatile Times
  • Private Credit Investing in Volatile Times
  • Potential Implications of the Latest US Administration Policy Proposals
  • View All Classes
  • Introductory Videos
  • Alternative Investing Essentials Part One • Now Available On Demand
  • Alternative Investing Essentials Part Two • Now Available On Demand
  • Practical Considerations • Now Available On Demand
  • Investment Knowledge
  • The View from Apollo
Home June 2024

Big Difference Between Small-Cap and Large-Cap Valuations in the S&P 500

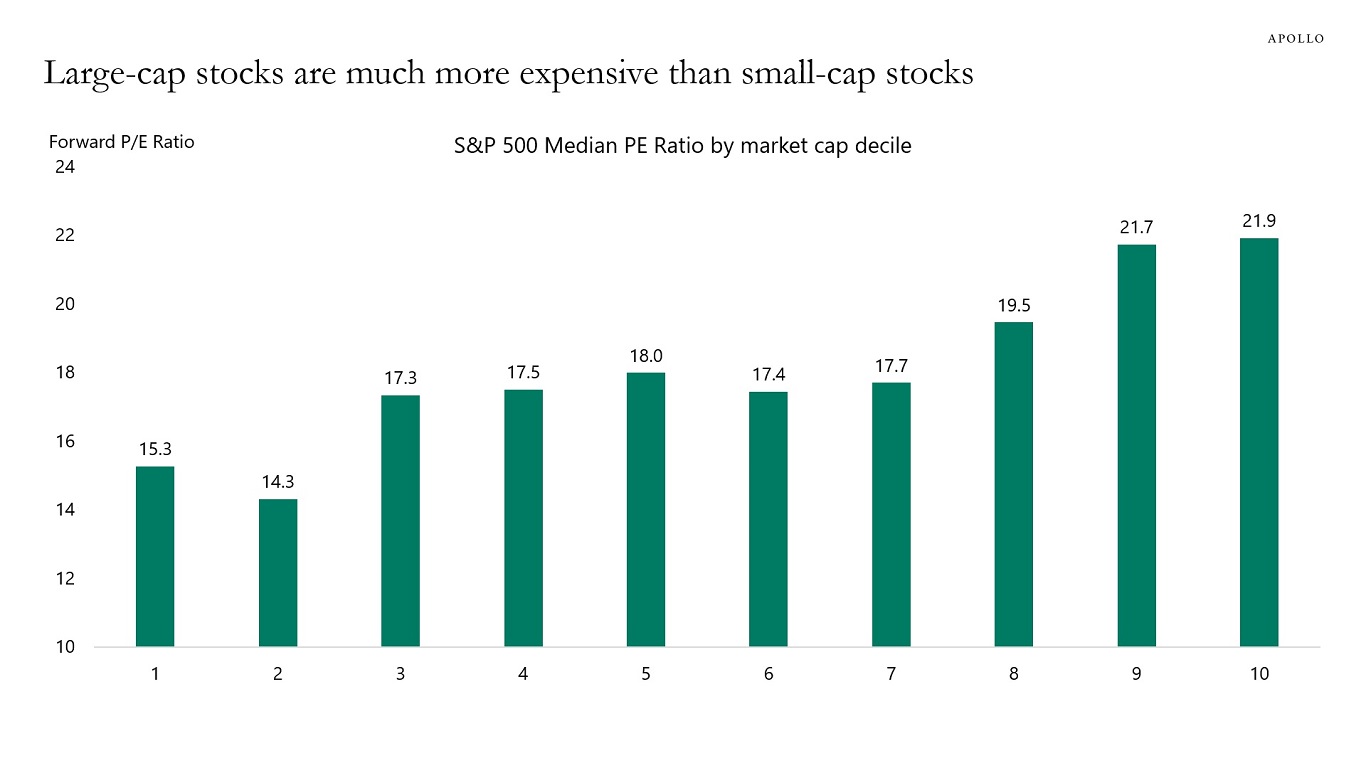
Looking at P/E ratios for companies in the S&P 500 ranked by market cap shows that large-cap companies are much more expensive than small-cap companies, see chart below.

Why are P/E ratios low for small-cap companies and high for large-cap companies?

Because Fed hikes and higher costs of capital are weighing on highly leveraged small-cap companies with low coverage ratios.

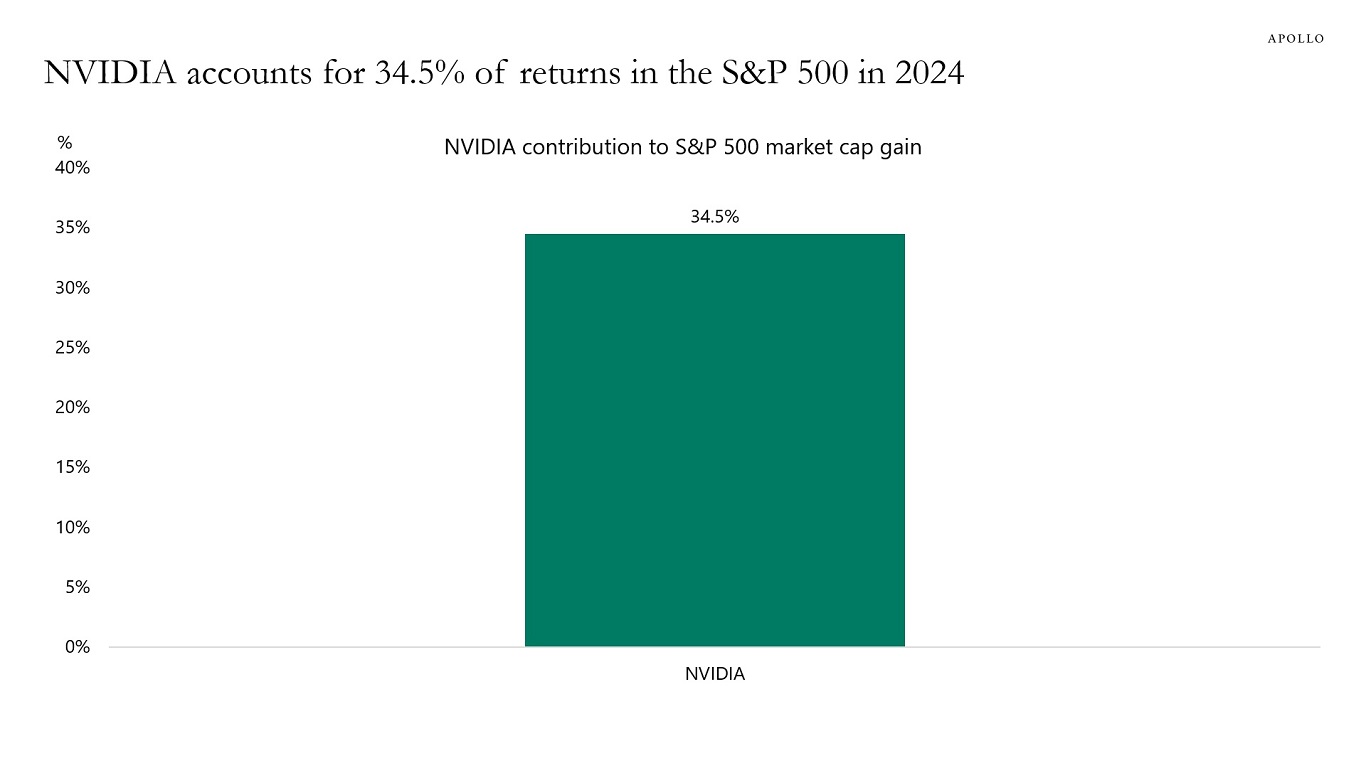
And the AI story has boosted valuations of mega-cap names.

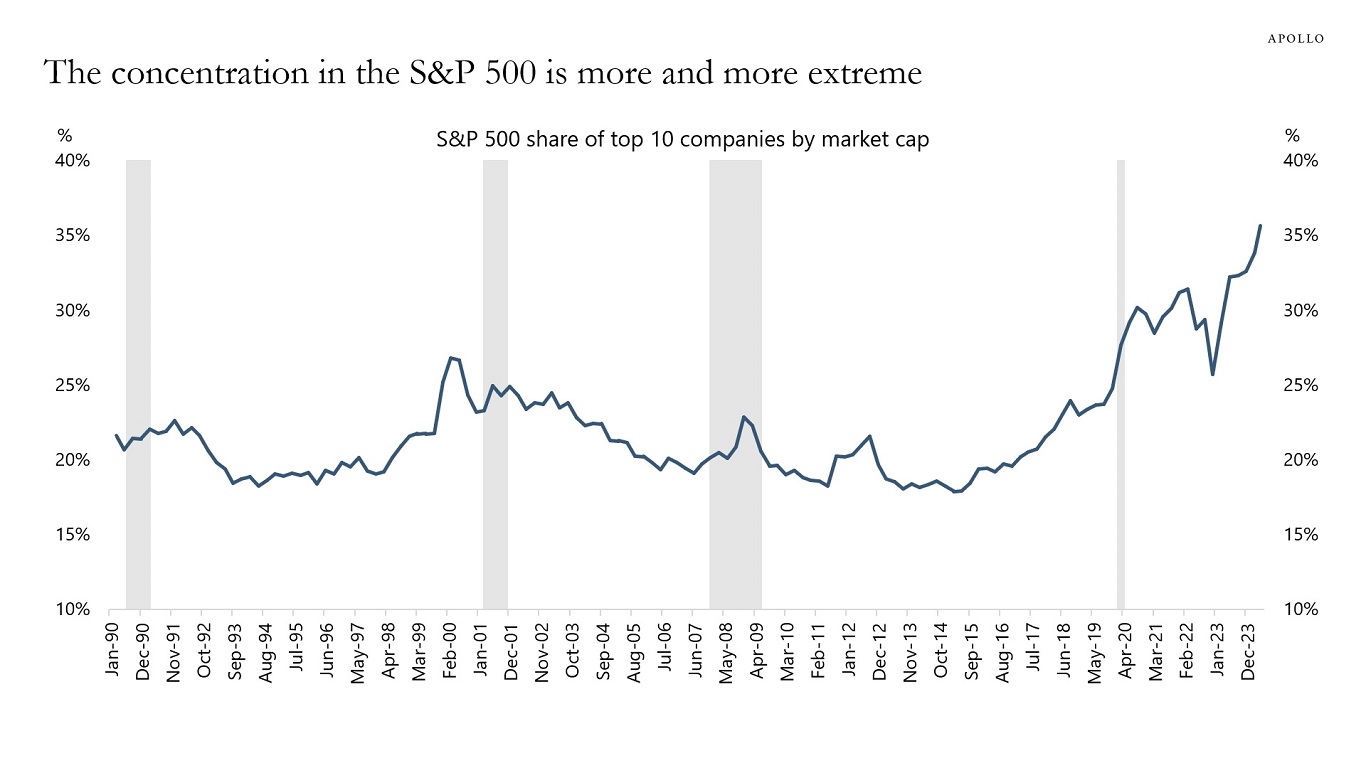
With the Fed keeping interest rates higher for longer, and the AI narrative pushing valuations and index concentration to extreme levels, the downside risks to equities are growing.

Large-cap stocks are much more expensive than small-cap stocks
Source: Bloomberg, Apollo Chief Economist

Download high-res chart(s)

Recent Posts

  • Strong Technical Demand for Credit
  • Fiscal Situation in Germany vs. Spain
  • Hedge Fund Leverage Rising Rapidly
  • The Financing Gap in Sports: Unlocking a $2.5 Trillion Opportunity
  • The US Retirement Crisis

Recent Comments

No comments to show.

Archives

  • December 2025
  • November 2025
  • October 2025
  • September 2025
  • August 2025
  • July 2025
  • June 2025
  • May 2025
  • April 2025
  • March 2025
  • February 2025
  • January 2025
  • December 2024
  • November 2024
  • October 2024
  • September 2024
  • August 2024
  • July 2024
  • June 2024
  • May 2024
  • April 2024
  • March 2024
  • February 2024
  • January 2024
  • December 2023
  • November 2023
  • October 2023
  • September 2023
  • August 2023
  • July 2023
  • June 2023
  • May 2023
  • April 2023
  • March 2023
  • February 2023
  • January 2023
  • December 2022
  • November 2022
  • October 2022
  • September 2022
  • August 2022
  • July 2022
  • June 2022
  • May 2022
  • April 2022
  • March 2022
  • February 2022
  • January 2022
  • December 2021
  • November 2021

Categories

  • Apollo Answers
  • Course Introductions
  • Economic Intelligence
  • Hide from Wordpress Search
  • Investment Knowledge
  • Perspectives
  • Redirecting
  • The Daily Spark
  • The View from Apollo
  • The Weekly Brief
  • Uncategorized
  • White Papers

Flexibility Is Key: Why Invest Opportunistically in Private Credit

As private credit markets continue to expand, we believe that a flexible approach to investing in the asset class can benefit investors, especially in an environment where volatility is expected to remain elevated. We discuss this and more in our new white paper, “Flexibility Is Key: Why Invest Opportunistically in Private Credit.”  

DOWNLOAD THE PAPER

Key Takeaways

  • Capital markets have, in our view, entered a new regime of higher volatility that, when properly managed, can create attractive opportunities for investors who are open to adding flexibility to private credit portfolios.
  • A flexible, relative-value based mandate can allow investors to allocate dynamically across the credit spectrum, capitalizing on opportunities that arise during different market regimes, especially periods of dislocation.
  • An opportunistic approach can lead to more diversified portfolios and, ultimately, potential higher risk-adjusted returns. In today’s environment, we see attractive opportunities to allocate among private corporate credit, asset-backed finance (ABF), and dislocated credit.
  • We see investors deploying flexible strategies alongside private credit, as a multi-asset class strategy, or as an “opportunistic” sleeve of credit portfolios.
DOWNLOAD THE PAPER

The information herein is provided for educational purposes only and should not be construed as financial or investment advice, nor should any information in this document be relied on when making an investment decision. Opinions and views expressed reflect the current opinions and views of the authors and Apollo Analysts as of the date hereof and are subject to change. Please see the end of this document for important disclosure information.


Important Disclosure Information

This presentation is for educational purposes only and should not be treated as research. This presentation may not be distributed, transmitted or otherwise communicated to others, in whole or in part, without the express written consent of Apollo Global Management, Inc. (together with its subsidiaries, “Apollo”).

The views and opinions expressed in this presentation are the views and opinions of the author(s) of the White Paper. They do not necessarily reflect the views and opinions of Apollo and are subject to change at any time without notice. Further, Apollo and its affiliates may have positions (long or short) or engage in securities transactions that are not consistent with the information and views expressed in this presentation. There can be no assurance that an investment strategy will be successful. Historic market trends are not reliable indicators of actual future market behavior or future performance of any particular investment which may differ materially, and should not be relied upon as such. Target allocations contained herein are subject to change. There is no assurance that the target allocations will be achieved, and actual allocations may be significantly different than that shown here. This presentation does not constitute an offer of any service or product of Apollo. It is not an invitation by or on behalf of Apollo to any person to buy or sell any security or to adopt any investment strategy, and shall not form the basis of, nor may it accompany nor form part of, any right or contract to buy or sell any security or to adopt any investment strategy. Nothing herein should be taken as investment advice or a recommendation to enter into any transaction.

Hyperlinks to third-party websites in this presentation are provided for reader convenience only. There can be no assurance that any trends discussed herein will continue. Unless otherwise noted, information included herein is presented as of the dates indicated. This presentation is not complete and the information contained herein may change at any time without notice. Apollo does not have any responsibility to update the presentation to account for such changes. Apollo has not made any representation or warranty, expressed or implied, with respect to fairness, correctness, accuracy, reasonableness, or completeness of any of the information contained herein, and expressly disclaims any responsibility or liability therefore. The information contained herein is not intended to provide, and should not be relied upon for, accounting, legal or tax advice or investment recommendations. Investors should make an independent investigation of the information contained herein, including consulting their tax, legal, accounting or other advisors about such information. Apollo does not act for you and is not responsible for providing you with the protections afforded to its clients.

Certain information contained herein may be “forward-looking” in nature. Due to various risks and uncertainties, actual events or results may differ materially from those reflected or contemplated in such forward-looking information. As such, undue reliance should not be placed on such information. Forward-looking statements may be identified by the use of terminology including, but not limited to, “may”, “will”, “should”, “expect”, “anticipate”, “target”, “project”, “estimate”, “intend”, “continue” or “believe” or the negatives thereof or other variations thereon or comparable terminology.

The Standard & Poor’s 500 (“S&P 500”) Index is a market-capitalization-weighted index of the 500 largest U.S. publicly traded companies by market value.

Additional information may be available upon request.

Recent Posts

  • Strong Technical Demand for Credit
  • Fiscal Situation in Germany vs. Spain
  • Hedge Fund Leverage Rising Rapidly
  • The Financing Gap in Sports: Unlocking a $2.5 Trillion Opportunity
  • The US Retirement Crisis

Recent Comments

No comments to show.

Archives

  • December 2025
  • November 2025
  • October 2025
  • September 2025
  • August 2025
  • July 2025
  • June 2025
  • May 2025
  • April 2025
  • March 2025
  • February 2025
  • January 2025
  • December 2024
  • November 2024
  • October 2024
  • September 2024
  • August 2024
  • July 2024
  • June 2024
  • May 2024
  • April 2024
  • March 2024
  • February 2024
  • January 2024
  • December 2023
  • November 2023
  • October 2023
  • September 2023
  • August 2023
  • July 2023
  • June 2023
  • May 2023
  • April 2023
  • March 2023
  • February 2023
  • January 2023
  • December 2022
  • November 2022
  • October 2022
  • September 2022
  • August 2022
  • July 2022
  • June 2022
  • May 2022
  • April 2022
  • March 2022
  • February 2022
  • January 2022
  • December 2021
  • November 2021

Categories

  • Apollo Answers
  • Course Introductions
  • Economic Intelligence
  • Hide from Wordpress Search
  • Investment Knowledge
  • Perspectives
  • Redirecting
  • The Daily Spark
  • The View from Apollo
  • The Weekly Brief
  • Uncategorized
  • White Papers

Extreme Concentration in Returns in the S&P 500

Thirty-five percent of the increase in the S&P 500’s market cap since the beginning of the year has come from one stock, see the chart below. Such a high concentration implies that if NVIDIA continues to rise, then things are fine. But if it starts to decline, then the S&P 500 will be hit hard.

The bottom line is that the extreme concentration of returns in the S&P 500 makes investors more vulnerable to single headlines impacting the one stock driving index returns.

NVIDIA accounts for 34.5% of returns in the S&P 500 in 2024
Source: Bloomberg, Apollo Chief Economist. Note: Calculated as share of market cap growth since January 1, 2024.

Download high-res chart(s)

Recent Posts

  • Strong Technical Demand for Credit
  • Fiscal Situation in Germany vs. Spain
  • Hedge Fund Leverage Rising Rapidly
  • The Financing Gap in Sports: Unlocking a $2.5 Trillion Opportunity
  • The US Retirement Crisis

Recent Comments

No comments to show.

Archives

  • December 2025
  • November 2025
  • October 2025
  • September 2025
  • August 2025
  • July 2025
  • June 2025
  • May 2025
  • April 2025
  • March 2025
  • February 2025
  • January 2025
  • December 2024
  • November 2024
  • October 2024
  • September 2024
  • August 2024
  • July 2024
  • June 2024
  • May 2024
  • April 2024
  • March 2024
  • February 2024
  • January 2024
  • December 2023
  • November 2023
  • October 2023
  • September 2023
  • August 2023
  • July 2023
  • June 2023
  • May 2023
  • April 2023
  • March 2023
  • February 2023
  • January 2023
  • December 2022
  • November 2022
  • October 2022
  • September 2022
  • August 2022
  • July 2022
  • June 2022
  • May 2022
  • April 2022
  • March 2022
  • February 2022
  • January 2022
  • December 2021
  • November 2021

Categories

  • Apollo Answers
  • Course Introductions
  • Economic Intelligence
  • Hide from Wordpress Search
  • Investment Knowledge
  • Perspectives
  • Redirecting
  • The Daily Spark
  • The View from Apollo
  • The Weekly Brief
  • Uncategorized
  • White Papers

The Pain in Real Estate Continues

It is remarkable how vacancy rates for commercial real estate are moving sideways or higher in a strong economy, see the first chart below. You would have expected that the ongoing strong growth in employment and GDP would push vacancy rates lower. If the Fed succeeds with slowing the economy down, then all these lines will move higher, and potentially very quickly.

Combined with the steep maturity wall for CRE, see the second chart, the bottom line is that the pain in office, apartments, and industrial real estate continues.

Vacancy rates rising for office, apartment, and industrial real estate in a strong economy?
Source: Bloomberg, Apollo Chief Economist
The CRE maturity wall is very steep
Source: MBA, Apollo Chief Economist

Download high-res chart(s)

Recent Posts

  • Strong Technical Demand for Credit
  • Fiscal Situation in Germany vs. Spain
  • Hedge Fund Leverage Rising Rapidly
  • The Financing Gap in Sports: Unlocking a $2.5 Trillion Opportunity
  • The US Retirement Crisis

Recent Comments

No comments to show.

Archives

  • December 2025
  • November 2025
  • October 2025
  • September 2025
  • August 2025
  • July 2025
  • June 2025
  • May 2025
  • April 2025
  • March 2025
  • February 2025
  • January 2025
  • December 2024
  • November 2024
  • October 2024
  • September 2024
  • August 2024
  • July 2024
  • June 2024
  • May 2024
  • April 2024
  • March 2024
  • February 2024
  • January 2024
  • December 2023
  • November 2023
  • October 2023
  • September 2023
  • August 2023
  • July 2023
  • June 2023
  • May 2023
  • April 2023
  • March 2023
  • February 2023
  • January 2023
  • December 2022
  • November 2022
  • October 2022
  • September 2022
  • August 2022
  • July 2022
  • June 2022
  • May 2022
  • April 2022
  • March 2022
  • February 2022
  • January 2022
  • December 2021
  • November 2021

Categories

  • Apollo Answers
  • Course Introductions
  • Economic Intelligence
  • Hide from Wordpress Search
  • Investment Knowledge
  • Perspectives
  • Redirecting
  • The Daily Spark
  • The View from Apollo
  • The Weekly Brief
  • Uncategorized
  • White Papers

Car Sales Very Strong

Although car sales are very sensitive to higher interest rates, the data for auto sales shows no signs of a slowdown. This suggests significant support for auto sales from wealth gains for households via higher stock prices, higher home prices, and higher cash flow from fixed income.

No signs of a slowdown in auto sales
Source: Bloomberg, Apollo Chief Economist

Download high-res chart(s)

Recent Posts

  • Strong Technical Demand for Credit
  • Fiscal Situation in Germany vs. Spain
  • Hedge Fund Leverage Rising Rapidly
  • The Financing Gap in Sports: Unlocking a $2.5 Trillion Opportunity
  • The US Retirement Crisis

Recent Comments

No comments to show.

Archives

  • December 2025
  • November 2025
  • October 2025
  • September 2025
  • August 2025
  • July 2025
  • June 2025
  • May 2025
  • April 2025
  • March 2025
  • February 2025
  • January 2025
  • December 2024
  • November 2024
  • October 2024
  • September 2024
  • August 2024
  • July 2024
  • June 2024
  • May 2024
  • April 2024
  • March 2024
  • February 2024
  • January 2024
  • December 2023
  • November 2023
  • October 2023
  • September 2023
  • August 2023
  • July 2023
  • June 2023
  • May 2023
  • April 2023
  • March 2023
  • February 2023
  • January 2023
  • December 2022
  • November 2022
  • October 2022
  • September 2022
  • August 2022
  • July 2022
  • June 2022
  • May 2022
  • April 2022
  • March 2022
  • February 2022
  • January 2022
  • December 2021
  • November 2021

Categories

  • Apollo Answers
  • Course Introductions
  • Economic Intelligence
  • Hide from Wordpress Search
  • Investment Knowledge
  • Perspectives
  • Redirecting
  • The Daily Spark
  • The View from Apollo
  • The Weekly Brief
  • Uncategorized
  • White Papers

Extreme Concentration in the S&P 500

The top 10 stocks in the S&P 500 now make up a record-high 35% of the index, see chart below.

The concentration in the S&P 500 is more and more extreme
Source: Bloomberg, Apollo Chief Economist

Download high-res chart(s)

Recent Posts

  • Strong Technical Demand for Credit
  • Fiscal Situation in Germany vs. Spain
  • Hedge Fund Leverage Rising Rapidly
  • The Financing Gap in Sports: Unlocking a $2.5 Trillion Opportunity
  • The US Retirement Crisis

Recent Comments

No comments to show.

Archives

  • December 2025
  • November 2025
  • October 2025
  • September 2025
  • August 2025
  • July 2025
  • June 2025
  • May 2025
  • April 2025
  • March 2025
  • February 2025
  • January 2025
  • December 2024
  • November 2024
  • October 2024
  • September 2024
  • August 2024
  • July 2024
  • June 2024
  • May 2024
  • April 2024
  • March 2024
  • February 2024
  • January 2024
  • December 2023
  • November 2023
  • October 2023
  • September 2023
  • August 2023
  • July 2023
  • June 2023
  • May 2023
  • April 2023
  • March 2023
  • February 2023
  • January 2023
  • December 2022
  • November 2022
  • October 2022
  • September 2022
  • August 2022
  • July 2022
  • June 2022
  • May 2022
  • April 2022
  • March 2022
  • February 2022
  • January 2022
  • December 2021
  • November 2021

Categories

  • Apollo Answers
  • Course Introductions
  • Economic Intelligence
  • Hide from Wordpress Search
  • Investment Knowledge
  • Perspectives
  • Redirecting
  • The Daily Spark
  • The View from Apollo
  • The Weekly Brief
  • Uncategorized
  • White Papers

CRE in Trouble

There are a lot of commercial real estate investments that need to be refinanced in 2024, see chart below. And rates higher for longer continue to have a negative impact across CRE.

The CRE maturity wall is very steep
Source: MBA, Apollo Chief Economist

Download high-res chart(s)

Recent Posts

  • Strong Technical Demand for Credit
  • Fiscal Situation in Germany vs. Spain
  • Hedge Fund Leverage Rising Rapidly
  • The Financing Gap in Sports: Unlocking a $2.5 Trillion Opportunity
  • The US Retirement Crisis

Recent Comments

No comments to show.

Archives

  • December 2025
  • November 2025
  • October 2025
  • September 2025
  • August 2025
  • July 2025
  • June 2025
  • May 2025
  • April 2025
  • March 2025
  • February 2025
  • January 2025
  • December 2024
  • November 2024
  • October 2024
  • September 2024
  • August 2024
  • July 2024
  • June 2024
  • May 2024
  • April 2024
  • March 2024
  • February 2024
  • January 2024
  • December 2023
  • November 2023
  • October 2023
  • September 2023
  • August 2023
  • July 2023
  • June 2023
  • May 2023
  • April 2023
  • March 2023
  • February 2023
  • January 2023
  • December 2022
  • November 2022
  • October 2022
  • September 2022
  • August 2022
  • July 2022
  • June 2022
  • May 2022
  • April 2022
  • March 2022
  • February 2022
  • January 2022
  • December 2021
  • November 2021

Categories

  • Apollo Answers
  • Course Introductions
  • Economic Intelligence
  • Hide from Wordpress Search
  • Investment Knowledge
  • Perspectives
  • Redirecting
  • The Daily Spark
  • The View from Apollo
  • The Weekly Brief
  • Uncategorized
  • White Papers

Global Economic Outlook Improving

The consensus probability of a recession has declined significantly in recent months and now stands at 30% for the US, Europe, and UK, see chart below.

The consensus probability of a recession in Europe, UK, and the US has declined significantly in recent months
Source: Bloomberg, Apollo Chief Economist

Download high-res chart(s)

Recent Posts

  • Strong Technical Demand for Credit
  • Fiscal Situation in Germany vs. Spain
  • Hedge Fund Leverage Rising Rapidly
  • The Financing Gap in Sports: Unlocking a $2.5 Trillion Opportunity
  • The US Retirement Crisis

Recent Comments

No comments to show.

Archives

  • December 2025
  • November 2025
  • October 2025
  • September 2025
  • August 2025
  • July 2025
  • June 2025
  • May 2025
  • April 2025
  • March 2025
  • February 2025
  • January 2025
  • December 2024
  • November 2024
  • October 2024
  • September 2024
  • August 2024
  • July 2024
  • June 2024
  • May 2024
  • April 2024
  • March 2024
  • February 2024
  • January 2024
  • December 2023
  • November 2023
  • October 2023
  • September 2023
  • August 2023
  • July 2023
  • June 2023
  • May 2023
  • April 2023
  • March 2023
  • February 2023
  • January 2023
  • December 2022
  • November 2022
  • October 2022
  • September 2022
  • August 2022
  • July 2022
  • June 2022
  • May 2022
  • April 2022
  • March 2022
  • February 2022
  • January 2022
  • December 2021
  • November 2021

Categories

  • Apollo Answers
  • Course Introductions
  • Economic Intelligence
  • Hide from Wordpress Search
  • Investment Knowledge
  • Perspectives
  • Redirecting
  • The Daily Spark
  • The View from Apollo
  • The Weekly Brief
  • Uncategorized
  • White Papers

Daily TSA Travel Data Still Strong

The TSA has daily data for the number of people scanning their boarding pass with a TSA agent, and it continues to show no signs of the economy slowing down, see chart below.

US air travel: No signs of a slowdown
Source: TSA, Bloomberg, Apollo Chief Economist

Download high-res chart(s)

Recent Posts

  • Strong Technical Demand for Credit
  • Fiscal Situation in Germany vs. Spain
  • Hedge Fund Leverage Rising Rapidly
  • The Financing Gap in Sports: Unlocking a $2.5 Trillion Opportunity
  • The US Retirement Crisis

Recent Comments

No comments to show.

Archives

  • December 2025
  • November 2025
  • October 2025
  • September 2025
  • August 2025
  • July 2025
  • June 2025
  • May 2025
  • April 2025
  • March 2025
  • February 2025
  • January 2025
  • December 2024
  • November 2024
  • October 2024
  • September 2024
  • August 2024
  • July 2024
  • June 2024
  • May 2024
  • April 2024
  • March 2024
  • February 2024
  • January 2024
  • December 2023
  • November 2023
  • October 2023
  • September 2023
  • August 2023
  • July 2023
  • June 2023
  • May 2023
  • April 2023
  • March 2023
  • February 2023
  • January 2023
  • December 2022
  • November 2022
  • October 2022
  • September 2022
  • August 2022
  • July 2022
  • June 2022
  • May 2022
  • April 2022
  • March 2022
  • February 2022
  • January 2022
  • December 2021
  • November 2021

Categories

  • Apollo Answers
  • Course Introductions
  • Economic Intelligence
  • Hide from Wordpress Search
  • Investment Knowledge
  • Perspectives
  • Redirecting
  • The Daily Spark
  • The View from Apollo
  • The Weekly Brief
  • Uncategorized
  • White Papers

Credit Yield Levels Unchanged For 12 Months and Counting

For the past 12 months, the yield level for IG has been 5.5%, and the yield level for HY has been 8%, see chart below.

The economic data over this period have been strong, so one conclusion is that firms and consumers have gotten used to a permanently higher cost of financing.

However, higher rates will continue to negatively impact leveraged investments done when interest rates were zero, particularly CRE and REITs, where the pain will be felt for many more years.

IG yield has been 5.5% for the past 12 months and HY yield has been 8%
Source: ICE BofA, Haver Analytics, Apollo Chief Economist

Download high-res chart(s)

Recent Posts

  • Strong Technical Demand for Credit
  • Fiscal Situation in Germany vs. Spain
  • Hedge Fund Leverage Rising Rapidly
  • The Financing Gap in Sports: Unlocking a $2.5 Trillion Opportunity
  • The US Retirement Crisis

Recent Comments

No comments to show.

Archives

  • December 2025
  • November 2025
  • October 2025
  • September 2025
  • August 2025
  • July 2025
  • June 2025
  • May 2025
  • April 2025
  • March 2025
  • February 2025
  • January 2025
  • December 2024
  • November 2024
  • October 2024
  • September 2024
  • August 2024
  • July 2024
  • June 2024
  • May 2024
  • April 2024
  • March 2024
  • February 2024
  • January 2024
  • December 2023
  • November 2023
  • October 2023
  • September 2023
  • August 2023
  • July 2023
  • June 2023
  • May 2023
  • April 2023
  • March 2023
  • February 2023
  • January 2023
  • December 2022
  • November 2022
  • October 2022
  • September 2022
  • August 2022
  • July 2022
  • June 2022
  • May 2022
  • April 2022
  • March 2022
  • February 2022
  • January 2022
  • December 2021
  • November 2021

Categories

  • Apollo Answers
  • Course Introductions
  • Economic Intelligence
  • Hide from Wordpress Search
  • Investment Knowledge
  • Perspectives
  • Redirecting
  • The Daily Spark
  • The View from Apollo
  • The Weekly Brief
  • Uncategorized
  • White Papers

Posts navigation

←Previous page Page 1 Page 2 Page 3 Page 4 Next page→
  • Privacy Notice
  • Terms of Use
  • Forward-Looking Statements
Apollo
© Apollo Global Management, Inc. All Rights Reserved.

The Apollo Academy is for informational and educational purposes only and nothing contained herein should be taken as investment advice or a recommendation to enter into any transaction. They are not an invitation by or on behalf of Apollo to any person to buy or sell any security or to adopt any investment strategy, and shall not form the basis of, nor may it accompany nor form part of, any right or contract to buy or sell any security or to adopt any investment strategy. There is no guarantee that the views and opinions expressed in this website will come to pass. For additional information, please see the disclaimers included in each piece of content or the legal page of our website here.