• Apollo.com
  • Login
  • Register Now
light site-logo
  • The Academy
  • Upcoming Events
        • Upcoming Events

  • Learning Center
        • New & UpdatedAlternative Investing Course 2.0

        • Alternative Investing Essentials Part OnePrivate Equity, Venture Capital, Private Credit
        • Alternative Investing Essentials Part TwoReal Estate, Infrastructure, Digital Assets, Hedge Funds
        • Practical ConsiderationsAsset Allocation, Risk Considerations, Fund Structures, Fees
        • Introductory Videos

          View All Videos

        •  Recent Classes & Videos

        • • 2026 Outlook
        • • Private Equity’s Edge: Delivering Alpha in a Changing Market
        • • Powering Innovation: Infrastructure Investing Across the AI Value Chain
        • • Mid-Year Outlook: At the Crossroads of Stagflation — What’s Next?
        • • Hybrid Investments: Flexible Structures for Volatile Times
        • • Private Credit Investing in Volatile Times
        • View All Classes

  • Alternative Perspectives
        • Investment Knowledge
        • The View from Apollo
          • Investment Knowledge White Papers

            After 60/40: In Private Markets, Manager Selection Matters

            February 27, 2026
          • The View From Apollo

            Allocation Insights: Asset-Backed Finance Is the Engine Behind Private Credit’s Next Chapter

            February 17, 2026
          • Investment Knowledge White Papers

            Private Equity Returns to Its Roots

            January 29, 2026
  • The Daily Spark
        • Read The Daily Spark Blog


        • Want it delivered daily to your inbox?
          • The Daily Spark

            Strong Net Foreign Buying of US Assets

            March 2, 2026
          • The Daily Spark

            Average Tenure of Companies in the S&P 500 Index: 15 Years

            March 1, 2026
          • The Daily Spark

            Fed Pricing Reveals Market Expectations About the AI Adoption Pace

            February 28, 2026
  • Register for Apollo Academy: Alternative Investing Course
  • Login
  • About Apollo Academy
  • Upcoming Events
  • Learning Center
  • Alternative Perspectives
  • The Daily Spark
  • Register for Apollo Academy: Alternative Investing Course
  • Login
  • Alternative Investing Course 2.0
  • 2026 Outlook
  • Private Equity’s Edge: Delivering Alpha in a Changing Market
  • Powering Innovation: Infrastructure Investing Across the AI Value Chain
  • Mid-Year Outlook: At the Crossroads of Stagflation — What’s Next?
  • Hybrid Investments: Flexible Structures for Volatile Times
  • Private Credit Investing in Volatile Times
  • View All Classes
  • Introductory Videos
  • Alternative Investing Essentials Part One • Now Available On Demand
  • Alternative Investing Essentials Part Two • Now Available On Demand
  • Practical Considerations • Now Available On Demand
  • Investment Knowledge
  • The View from Apollo
Home October 2024

Broadway Show Attendance Strong

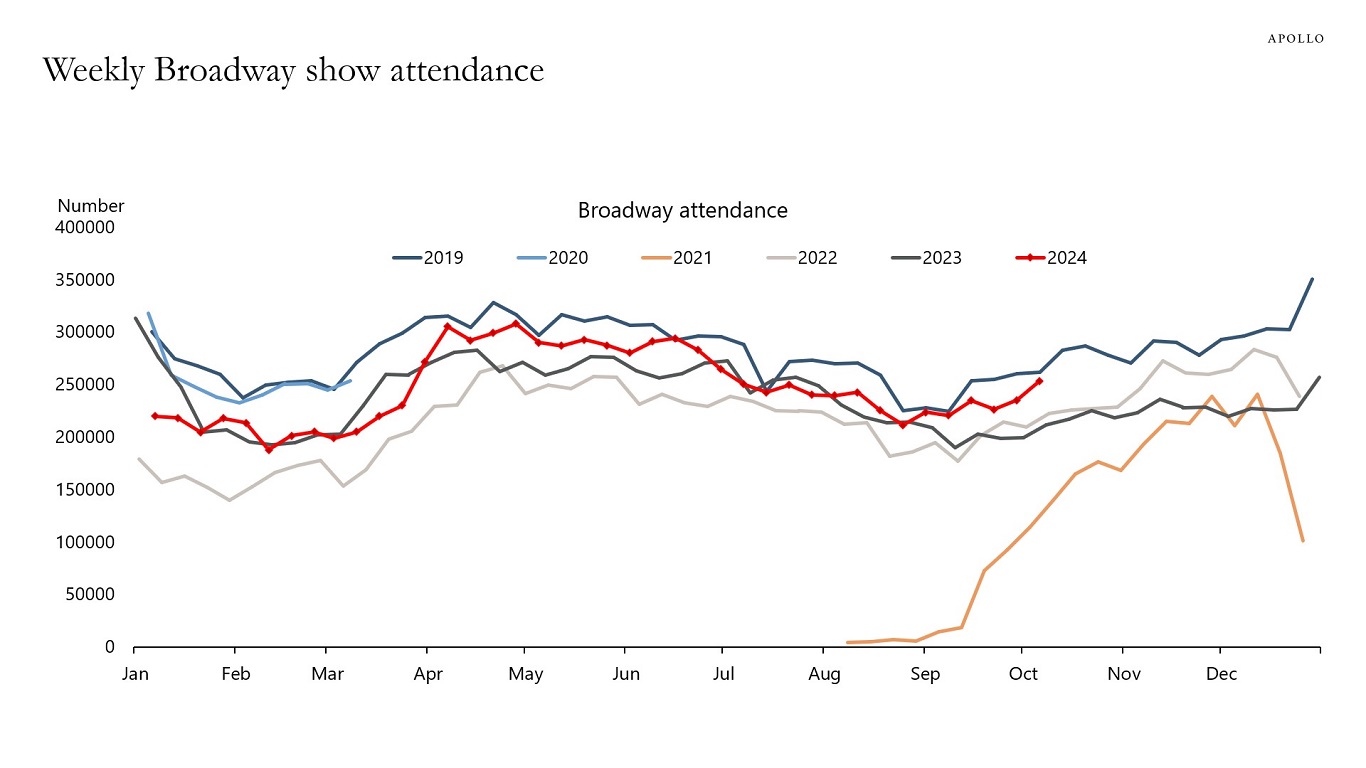
Going to a Broadway show can cost up to $200, and the latest weekly data shows that consumers are still happy to pay this discretionary expense, see the first chart below.

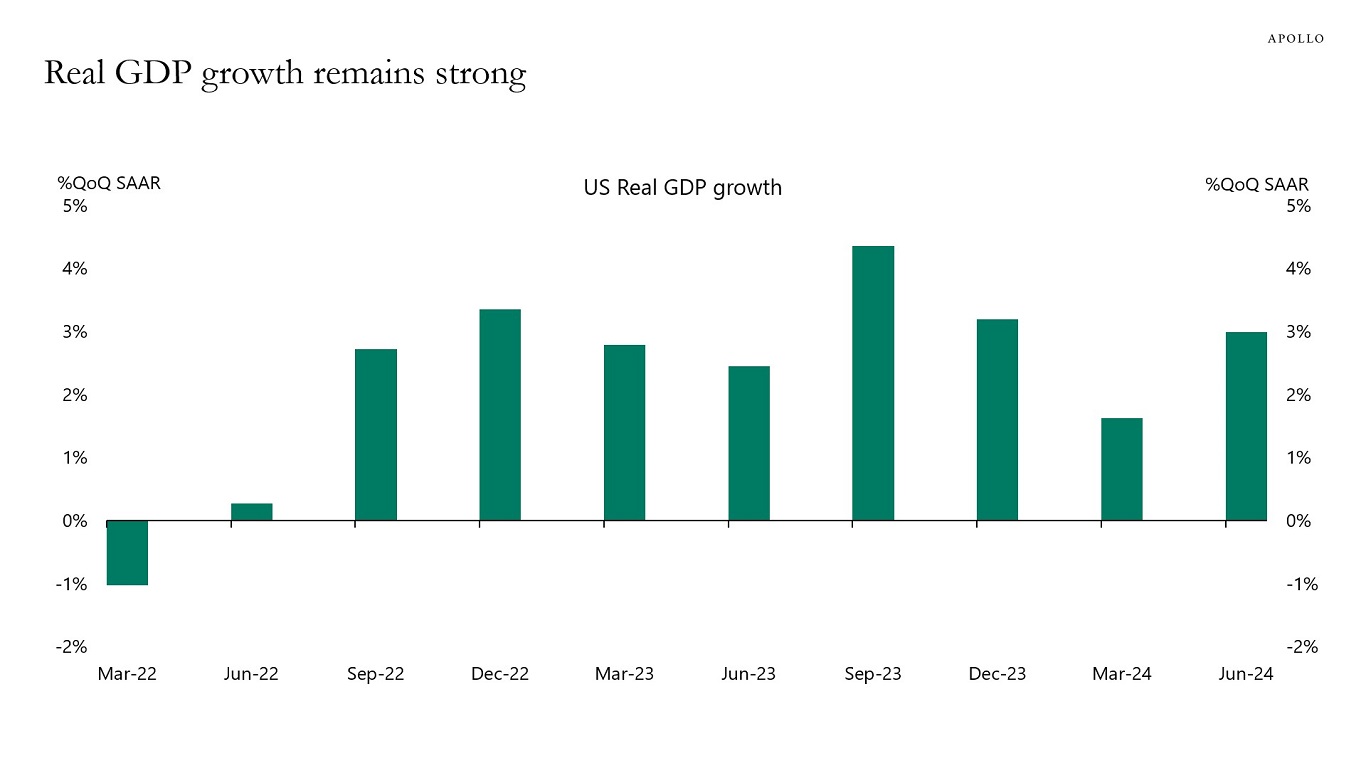
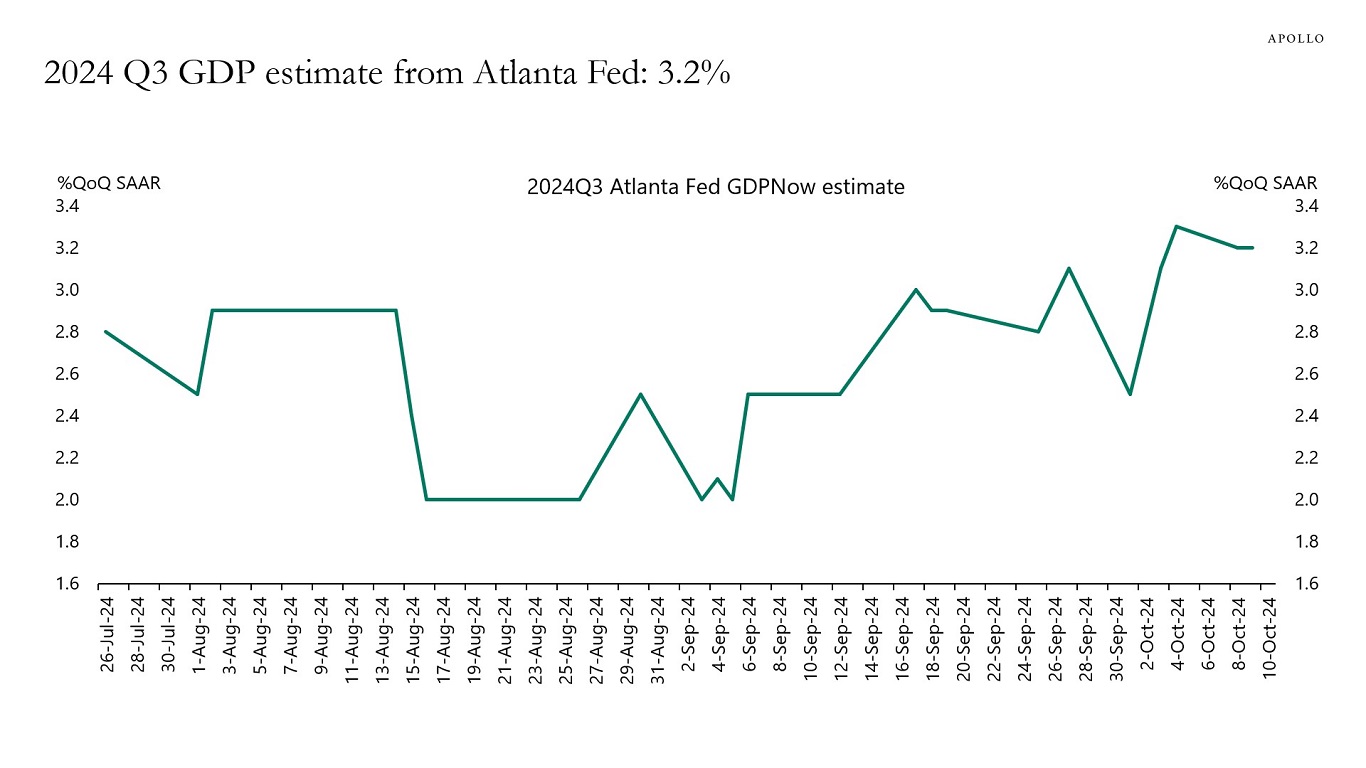
More broadly, GDP growth in the second quarter was 3.0%, and the Atlanta Fed GDP estimate for the third quarter is 3.2%, see the second and third chart.

Why is the economy so strong? Because of lower interest rate sensitivity for households and firms because of locked-in low interest rates, strong AI spending, and strong fiscal spending driven by the CHIPS Act, the IRA, and the Infrastructure Act. Combined with high stock prices and tight credit spreads, these forces are offsetting the long and variable lags of monetary policy.

See our chart book with daily and weekly indicators.

Weekly Broadway show attendance
Source: Internet Broadway Database, Apollo Chief Economist
Real GDP growth remains strong
Source: BEA, Haver Analytics, Apollo Chief Economist
2024 Q3 GDP estimate from Atlanta Fed: 3.2%
Source: Federal Reserve Bank of Atlanta, Haver Analytics, Apollo Chief Economist

Download high-res chart(s)

Recent Posts

  • Strong Net Foreign Buying of US Assets
  • Average Tenure of Companies in the S&P 500 Index: 15 Years
  • Fed Pricing Reveals Market Expectations About the AI Adoption Pace
  • After 60/40: In Private Markets, Manager Selection Matters
  • Equity Market Trading Volumes Rising

Recent Comments

No comments to show.

Archives

  • March 2026
  • February 2026
  • January 2026
  • December 2025
  • November 2025
  • October 2025
  • September 2025
  • August 2025
  • July 2025
  • June 2025
  • May 2025
  • April 2025
  • March 2025
  • February 2025
  • January 2025
  • December 2024
  • November 2024
  • October 2024
  • September 2024
  • August 2024
  • July 2024
  • June 2024
  • May 2024
  • April 2024
  • March 2024
  • February 2024
  • January 2024
  • December 2023
  • November 2023
  • October 2023
  • September 2023
  • August 2023
  • July 2023
  • June 2023
  • May 2023
  • April 2023
  • March 2023
  • February 2023
  • January 2023
  • December 2022
  • November 2022
  • October 2022
  • September 2022
  • August 2022
  • July 2022
  • June 2022
  • May 2022
  • April 2022
  • March 2022
  • February 2022
  • January 2022
  • December 2021
  • November 2021

Categories

  • Apollo Answers
  • Course Introductions
  • Economic Intelligence
  • Hide from Wordpress Search
  • Investment Knowledge
  • Perspectives
  • Redirecting
  • The Daily Spark
  • The View from Apollo
  • The Weekly Brief
  • Uncategorized
  • White Papers

S&P 500 Sector Returns During Soft Landings

Healthcare, financials, and consumer staples outperform during Fed cut episodes that end with a soft landing, see chart below.

S&P 500 sector returns during soft landing Fed cut episodes
Note: The data represents cumulative total returns of each sector during the two rate cut cycles (July 1995-January 1996 and September 1998-November 1998) that did not overlap with a recession. Source: Bloomberg, Apollo Chief Economist

Download high-res chart

Recent Posts

  • Strong Net Foreign Buying of US Assets
  • Average Tenure of Companies in the S&P 500 Index: 15 Years
  • Fed Pricing Reveals Market Expectations About the AI Adoption Pace
  • After 60/40: In Private Markets, Manager Selection Matters
  • Equity Market Trading Volumes Rising

Recent Comments

No comments to show.

Archives

  • March 2026
  • February 2026
  • January 2026
  • December 2025
  • November 2025
  • October 2025
  • September 2025
  • August 2025
  • July 2025
  • June 2025
  • May 2025
  • April 2025
  • March 2025
  • February 2025
  • January 2025
  • December 2024
  • November 2024
  • October 2024
  • September 2024
  • August 2024
  • July 2024
  • June 2024
  • May 2024
  • April 2024
  • March 2024
  • February 2024
  • January 2024
  • December 2023
  • November 2023
  • October 2023
  • September 2023
  • August 2023
  • July 2023
  • June 2023
  • May 2023
  • April 2023
  • March 2023
  • February 2023
  • January 2023
  • December 2022
  • November 2022
  • October 2022
  • September 2022
  • August 2022
  • July 2022
  • June 2022
  • May 2022
  • April 2022
  • March 2022
  • February 2022
  • January 2022
  • December 2021
  • November 2021

Categories

  • Apollo Answers
  • Course Introductions
  • Economic Intelligence
  • Hide from Wordpress Search
  • Investment Knowledge
  • Perspectives
  • Redirecting
  • The Daily Spark
  • The View from Apollo
  • The Weekly Brief
  • Uncategorized
  • White Papers

Share of the Population Voting in Elections

Voter turnout rates differ dramatically across states, with a 70% participation rate in Oregon and 38% in West Virginia, see chart below.

How many people vote is US elections, by state
Note: Data for Midterm elections 2022. Source: The Brookings Institution, Apollo Chief Economist

Download high-res chart

Recent Posts

  • Strong Net Foreign Buying of US Assets
  • Average Tenure of Companies in the S&P 500 Index: 15 Years
  • Fed Pricing Reveals Market Expectations About the AI Adoption Pace
  • After 60/40: In Private Markets, Manager Selection Matters
  • Equity Market Trading Volumes Rising

Recent Comments

No comments to show.

Archives

  • March 2026
  • February 2026
  • January 2026
  • December 2025
  • November 2025
  • October 2025
  • September 2025
  • August 2025
  • July 2025
  • June 2025
  • May 2025
  • April 2025
  • March 2025
  • February 2025
  • January 2025
  • December 2024
  • November 2024
  • October 2024
  • September 2024
  • August 2024
  • July 2024
  • June 2024
  • May 2024
  • April 2024
  • March 2024
  • February 2024
  • January 2024
  • December 2023
  • November 2023
  • October 2023
  • September 2023
  • August 2023
  • July 2023
  • June 2023
  • May 2023
  • April 2023
  • March 2023
  • February 2023
  • January 2023
  • December 2022
  • November 2022
  • October 2022
  • September 2022
  • August 2022
  • July 2022
  • June 2022
  • May 2022
  • April 2022
  • March 2022
  • February 2022
  • January 2022
  • December 2021
  • November 2021

Categories

  • Apollo Answers
  • Course Introductions
  • Economic Intelligence
  • Hide from Wordpress Search
  • Investment Knowledge
  • Perspectives
  • Redirecting
  • The Daily Spark
  • The View from Apollo
  • The Weekly Brief
  • Uncategorized
  • White Papers

Prime Brokerage a Growing Risk to Financial Stability

Prime brokerage borrowing is now at $2.3 trillion, up from around $1 trillion before the pandemic, see chart below.

More than $2 trillion in prime brokerage borrowing
Note: The data are aggregated responses to SEC Form PF question 43. Only responses from Qualifying Hedge Funds are included.
Source: Data for the US Office of Financial Research, Apollo Chief Economist

Download high-res chart

Recent Posts

  • Strong Net Foreign Buying of US Assets
  • Average Tenure of Companies in the S&P 500 Index: 15 Years
  • Fed Pricing Reveals Market Expectations About the AI Adoption Pace
  • After 60/40: In Private Markets, Manager Selection Matters
  • Equity Market Trading Volumes Rising

Recent Comments

No comments to show.

Archives

  • March 2026
  • February 2026
  • January 2026
  • December 2025
  • November 2025
  • October 2025
  • September 2025
  • August 2025
  • July 2025
  • June 2025
  • May 2025
  • April 2025
  • March 2025
  • February 2025
  • January 2025
  • December 2024
  • November 2024
  • October 2024
  • September 2024
  • August 2024
  • July 2024
  • June 2024
  • May 2024
  • April 2024
  • March 2024
  • February 2024
  • January 2024
  • December 2023
  • November 2023
  • October 2023
  • September 2023
  • August 2023
  • July 2023
  • June 2023
  • May 2023
  • April 2023
  • March 2023
  • February 2023
  • January 2023
  • December 2022
  • November 2022
  • October 2022
  • September 2022
  • August 2022
  • July 2022
  • June 2022
  • May 2022
  • April 2022
  • March 2022
  • February 2022
  • January 2022
  • December 2021
  • November 2021

Categories

  • Apollo Answers
  • Course Introductions
  • Economic Intelligence
  • Hide from Wordpress Search
  • Investment Knowledge
  • Perspectives
  • Redirecting
  • The Daily Spark
  • The View from Apollo
  • The Weekly Brief
  • Uncategorized
  • White Papers

Data Centers’ Share of Total Power Consumption

Data centers use 26% of Virginia’s total power consumption, and there is a significant need for long-term investments in energy to power the ongoing AI revolution, see map below.

Data centers’ share of total power consumption
Note: There is no data available for states shaded in grey. Source: Electric Power Research Institute (EPRI), Apollo Chief Economist

Download map

Recent Posts

  • Strong Net Foreign Buying of US Assets
  • Average Tenure of Companies in the S&P 500 Index: 15 Years
  • Fed Pricing Reveals Market Expectations About the AI Adoption Pace
  • After 60/40: In Private Markets, Manager Selection Matters
  • Equity Market Trading Volumes Rising

Recent Comments

No comments to show.

Archives

  • March 2026
  • February 2026
  • January 2026
  • December 2025
  • November 2025
  • October 2025
  • September 2025
  • August 2025
  • July 2025
  • June 2025
  • May 2025
  • April 2025
  • March 2025
  • February 2025
  • January 2025
  • December 2024
  • November 2024
  • October 2024
  • September 2024
  • August 2024
  • July 2024
  • June 2024
  • May 2024
  • April 2024
  • March 2024
  • February 2024
  • January 2024
  • December 2023
  • November 2023
  • October 2023
  • September 2023
  • August 2023
  • July 2023
  • June 2023
  • May 2023
  • April 2023
  • March 2023
  • February 2023
  • January 2023
  • December 2022
  • November 2022
  • October 2022
  • September 2022
  • August 2022
  • July 2022
  • June 2022
  • May 2022
  • April 2022
  • March 2022
  • February 2022
  • January 2022
  • December 2021
  • November 2021

Categories

  • Apollo Answers
  • Course Introductions
  • Economic Intelligence
  • Hide from Wordpress Search
  • Investment Knowledge
  • Perspectives
  • Redirecting
  • The Daily Spark
  • The View from Apollo
  • The Weekly Brief
  • Uncategorized
  • White Papers

Share of Land in Each State That Is Federally Owned

The share of land owned by the federal government varies dramatically across states, see chart below.

85% of the land in Nevada is federally owned. In California it is 46%, and in New York it is 0%.
Source: World Population Review, Apollo Chief Economist

Download high-res chart

Recent Posts

  • Strong Net Foreign Buying of US Assets
  • Average Tenure of Companies in the S&P 500 Index: 15 Years
  • Fed Pricing Reveals Market Expectations About the AI Adoption Pace
  • After 60/40: In Private Markets, Manager Selection Matters
  • Equity Market Trading Volumes Rising

Recent Comments

No comments to show.

Archives

  • March 2026
  • February 2026
  • January 2026
  • December 2025
  • November 2025
  • October 2025
  • September 2025
  • August 2025
  • July 2025
  • June 2025
  • May 2025
  • April 2025
  • March 2025
  • February 2025
  • January 2025
  • December 2024
  • November 2024
  • October 2024
  • September 2024
  • August 2024
  • July 2024
  • June 2024
  • May 2024
  • April 2024
  • March 2024
  • February 2024
  • January 2024
  • December 2023
  • November 2023
  • October 2023
  • September 2023
  • August 2023
  • July 2023
  • June 2023
  • May 2023
  • April 2023
  • March 2023
  • February 2023
  • January 2023
  • December 2022
  • November 2022
  • October 2022
  • September 2022
  • August 2022
  • July 2022
  • June 2022
  • May 2022
  • April 2022
  • March 2022
  • February 2022
  • January 2022
  • December 2021
  • November 2021

Categories

  • Apollo Answers
  • Course Introductions
  • Economic Intelligence
  • Hide from Wordpress Search
  • Investment Knowledge
  • Perspectives
  • Redirecting
  • The Daily Spark
  • The View from Apollo
  • The Weekly Brief
  • Uncategorized
  • White Papers

Processing Times Declining for US Citizenship Applications

The time it takes for applications for US citizenship has declined from 12 months to four months, which contributes to accelerating immigration growth at the moment.

Median Processing Times for application for Naturalization
Note: Year indicates fiscal year. Source: US Citizenship and Immigration Services, Apollo Chief Economist

Download high-res chart

Recent Posts

  • Strong Net Foreign Buying of US Assets
  • Average Tenure of Companies in the S&P 500 Index: 15 Years
  • Fed Pricing Reveals Market Expectations About the AI Adoption Pace
  • After 60/40: In Private Markets, Manager Selection Matters
  • Equity Market Trading Volumes Rising

Recent Comments

No comments to show.

Archives

  • March 2026
  • February 2026
  • January 2026
  • December 2025
  • November 2025
  • October 2025
  • September 2025
  • August 2025
  • July 2025
  • June 2025
  • May 2025
  • April 2025
  • March 2025
  • February 2025
  • January 2025
  • December 2024
  • November 2024
  • October 2024
  • September 2024
  • August 2024
  • July 2024
  • June 2024
  • May 2024
  • April 2024
  • March 2024
  • February 2024
  • January 2024
  • December 2023
  • November 2023
  • October 2023
  • September 2023
  • August 2023
  • July 2023
  • June 2023
  • May 2023
  • April 2023
  • March 2023
  • February 2023
  • January 2023
  • December 2022
  • November 2022
  • October 2022
  • September 2022
  • August 2022
  • July 2022
  • June 2022
  • May 2022
  • April 2022
  • March 2022
  • February 2022
  • January 2022
  • December 2021
  • November 2021

Categories

  • Apollo Answers
  • Course Introductions
  • Economic Intelligence
  • Hide from Wordpress Search
  • Investment Knowledge
  • Perspectives
  • Redirecting
  • The Daily Spark
  • The View from Apollo
  • The Weekly Brief
  • Uncategorized
  • White Papers

No Need for Fed Cuts

The incoming data continues to remain robust. The US economy added 254,000 jobs in September versus a consensus expectation of 150,000 jobs, the unemployment rate fell from 4.2% to 4.1%, wage growth is solid and remains sticky, job openings are going up, and the ISM services reading is also strong.

Why is the economy still strong? Because of lower sensitivity to Fed hikes for consumers and firms with locked-in low interest rates. Because of strong AI spending. Because of strong fiscal and defense spending. These tailwinds are countering the long and variable lags of monetary policy. And now the Fed is cutting rates, which is boosting growth and inflation further. Combined with very easy financial conditions, the bottom line remains that rates will stay higher for longer.

Our chart book with daily and weekly data is available here.

Wage growth went up in September and remains sticky above pre-pandemic levels
Source: BLS, Haver Analytics, Apollo Chief Economist

WARN data points to lower claims in coming months
Note: The Worker Adjustment and Retraining Notification (WARN) Act helps ensure 60 to 90 days advance notice in cases of qualified plant closings and mass layoffs. WARN factor is the Cleveland Fed estimate for WARN notices (https://www.clevelandfed.org/publications/working-paper/wp-2003r-advance-layoff-notices-and-aggregate-job-loss). Source: Department of Labor, Haver Analytics, Federal Reserve Bank of Cleveland, Apollo Chief Economist

Default rates declining
Source: PitchBook LCD, Apollo Chief Economist

Download high-res chart(s)

Recent Posts

  • Strong Net Foreign Buying of US Assets
  • Average Tenure of Companies in the S&P 500 Index: 15 Years
  • Fed Pricing Reveals Market Expectations About the AI Adoption Pace
  • After 60/40: In Private Markets, Manager Selection Matters
  • Equity Market Trading Volumes Rising

Recent Comments

No comments to show.

Archives

  • March 2026
  • February 2026
  • January 2026
  • December 2025
  • November 2025
  • October 2025
  • September 2025
  • August 2025
  • July 2025
  • June 2025
  • May 2025
  • April 2025
  • March 2025
  • February 2025
  • January 2025
  • December 2024
  • November 2024
  • October 2024
  • September 2024
  • August 2024
  • July 2024
  • June 2024
  • May 2024
  • April 2024
  • March 2024
  • February 2024
  • January 2024
  • December 2023
  • November 2023
  • October 2023
  • September 2023
  • August 2023
  • July 2023
  • June 2023
  • May 2023
  • April 2023
  • March 2023
  • February 2023
  • January 2023
  • December 2022
  • November 2022
  • October 2022
  • September 2022
  • August 2022
  • July 2022
  • June 2022
  • May 2022
  • April 2022
  • March 2022
  • February 2022
  • January 2022
  • December 2021
  • November 2021

Categories

  • Apollo Answers
  • Course Introductions
  • Economic Intelligence
  • Hide from Wordpress Search
  • Investment Knowledge
  • Perspectives
  • Redirecting
  • The Daily Spark
  • The View from Apollo
  • The Weekly Brief
  • Uncategorized
  • White Papers

Asymmetric Policymaking

When FOMC members put together their forecasts, they are asked about the risks to their projections.

You would think that the risks to your forecast were symmetric over time. But, as the chart below shows, FOMC members are always much more worried about the risk that the unemployment rate is rising than the risk that the unemployment rate is falling. 

This preference for unemployment staying low suggests that policymakers would prefer to cut interest rates too much too quickly to minimize the risk that the unemployment rate will move higher. Which of course increases the risk that inflation starts to move up again.

Fed officials are much more worried about rising unemployment than falling unemployment
Note: No survey was conducted in March 2020. Source: Federal Reserve, Apollo Chief Economist

Download high-res chart

Recent Posts

  • Strong Net Foreign Buying of US Assets
  • Average Tenure of Companies in the S&P 500 Index: 15 Years
  • Fed Pricing Reveals Market Expectations About the AI Adoption Pace
  • After 60/40: In Private Markets, Manager Selection Matters
  • Equity Market Trading Volumes Rising

Recent Comments

No comments to show.

Archives

  • March 2026
  • February 2026
  • January 2026
  • December 2025
  • November 2025
  • October 2025
  • September 2025
  • August 2025
  • July 2025
  • June 2025
  • May 2025
  • April 2025
  • March 2025
  • February 2025
  • January 2025
  • December 2024
  • November 2024
  • October 2024
  • September 2024
  • August 2024
  • July 2024
  • June 2024
  • May 2024
  • April 2024
  • March 2024
  • February 2024
  • January 2024
  • December 2023
  • November 2023
  • October 2023
  • September 2023
  • August 2023
  • July 2023
  • June 2023
  • May 2023
  • April 2023
  • March 2023
  • February 2023
  • January 2023
  • December 2022
  • November 2022
  • October 2022
  • September 2022
  • August 2022
  • July 2022
  • June 2022
  • May 2022
  • April 2022
  • March 2022
  • February 2022
  • January 2022
  • December 2021
  • November 2021

Categories

  • Apollo Answers
  • Course Introductions
  • Economic Intelligence
  • Hide from Wordpress Search
  • Investment Knowledge
  • Perspectives
  • Redirecting
  • The Daily Spark
  • The View from Apollo
  • The Weekly Brief
  • Uncategorized
  • White Papers

India: Share of the Population Using the Internet

The share of the population using the internet in India has increased over the past decade from 14% to 52%, see chart below.

Internet adoption rising rapidly in India
Note: Internet adoption rate is defined as number of individuals using the internet as a % of total population. Source: Kepois Analysis via datareportal.com

Download high-res chart

Recent Posts

  • Strong Net Foreign Buying of US Assets
  • Average Tenure of Companies in the S&P 500 Index: 15 Years
  • Fed Pricing Reveals Market Expectations About the AI Adoption Pace
  • After 60/40: In Private Markets, Manager Selection Matters
  • Equity Market Trading Volumes Rising

Recent Comments

No comments to show.

Archives

  • March 2026
  • February 2026
  • January 2026
  • December 2025
  • November 2025
  • October 2025
  • September 2025
  • August 2025
  • July 2025
  • June 2025
  • May 2025
  • April 2025
  • March 2025
  • February 2025
  • January 2025
  • December 2024
  • November 2024
  • October 2024
  • September 2024
  • August 2024
  • July 2024
  • June 2024
  • May 2024
  • April 2024
  • March 2024
  • February 2024
  • January 2024
  • December 2023
  • November 2023
  • October 2023
  • September 2023
  • August 2023
  • July 2023
  • June 2023
  • May 2023
  • April 2023
  • March 2023
  • February 2023
  • January 2023
  • December 2022
  • November 2022
  • October 2022
  • September 2022
  • August 2022
  • July 2022
  • June 2022
  • May 2022
  • April 2022
  • March 2022
  • February 2022
  • January 2022
  • December 2021
  • November 2021

Categories

  • Apollo Answers
  • Course Introductions
  • Economic Intelligence
  • Hide from Wordpress Search
  • Investment Knowledge
  • Perspectives
  • Redirecting
  • The Daily Spark
  • The View from Apollo
  • The Weekly Brief
  • Uncategorized
  • White Papers

Posts navigation

←Previous page Page 1 Page 2 Page 3 Page 4 Next page→
  • Privacy Notice
  • Terms of Use
  • Forward-Looking Statements
Apollo
© Apollo Global Management, Inc. All Rights Reserved.

The Apollo Academy is for informational and educational purposes only and nothing contained herein should be taken as investment advice or a recommendation to enter into any transaction. They are not an invitation by or on behalf of Apollo to any person to buy or sell any security or to adopt any investment strategy, and shall not form the basis of, nor may it accompany nor form part of, any right or contract to buy or sell any security or to adopt any investment strategy. There is no guarantee that the views and opinions expressed in this website will come to pass. For additional information, please see the disclaimers included in each piece of content or the legal page of our website here.