• Apollo.com
  • Login
  • Register Now
light site-logo
  • The Academy
  • Upcoming Events
        • Upcoming Events

        • 2026 OutlookTuesday, December 16, 2025 • 11:00am ET
  • Learning Center
        • New & UpdatedAlternative Investing Course 2.0

        • Alternative Investing Essentials Part OnePrivate Equity, Venture Capital, Private Credit
        • Alternative Investing Essentials Part TwoReal Estate, Infrastructure, Digital Assets, Hedge Funds
        • Practical ConsiderationsAsset Allocation, Risk Considerations, Fund Structures, Fees
        • Introductory Videos

          View All Videos

        •  Recent Classes & Videos

        • • Private Equity’s Edge: Delivering Alpha in a Changing Market
        • • Powering Innovation: Infrastructure Investing Across the AI Value Chain
        • • Mid-Year Outlook: At the Crossroads of Stagflation — What’s Next?
        • • Hybrid Investments: Flexible Structures for Volatile Times
        • • Private Credit Investing in Volatile Times
        • • Potential Implications of the Latest US Administration Policy Proposals
        • View All Classes

  • Alternative Perspectives
        • Investment Knowledge
        • The View from Apollo
          • Investment Knowledge White Papers

            The Financing Gap in Sports: Unlocking a $2.5 Trillion Opportunity

            December 12, 2025
          • The View From Apollo

            Private Equity: Alpha in an Evolving Market

            November 24, 2025
          • Investment Knowledge

            Hybrid in Action: Delivering Bespoke Capital Solutions in a New Market Paradigm

            December 4, 2025
  • The Daily Spark
        • Read The Daily Spark Blog


        • Want it delivered daily to your inbox?
          • The Daily Spark

            Strong Technical Demand for Credit

            December 15, 2025
          • The Daily Spark

            Fiscal Situation in Germany vs. Spain

            December 14, 2025
          • The Daily Spark

            Hedge Fund Leverage Rising Rapidly

            December 13, 2025
  • Register for Apollo Academy: Alternative Investing Course
  • Login
  • About Apollo Academy
  • Upcoming Events
  • Learning Center
  • Alternative Perspectives
  • The Daily Spark
  • Register for Apollo Academy: Alternative Investing Course
  • Login
  • 2026 Outlook
  • Alternative Investing Course 2.0
  • Private Equity’s Edge: Delivering Alpha in a Changing Market
  • Powering Innovation: Infrastructure Investing Across the AI Value Chain
  • Mid-Year Outlook: At the Crossroads of Stagflation — What’s Next?
  • Hybrid Investments: Flexible Structures for Volatile Times
  • Private Credit Investing in Volatile Times
  • Potential Implications of the Latest US Administration Policy Proposals
  • View All Classes
  • Introductory Videos
  • Alternative Investing Essentials Part One • Now Available On Demand
  • Alternative Investing Essentials Part Two • Now Available On Demand
  • Practical Considerations • Now Available On Demand
  • Investment Knowledge
  • The View from Apollo
Home January 2025

Few Countries in Recession in 2025 and 2026

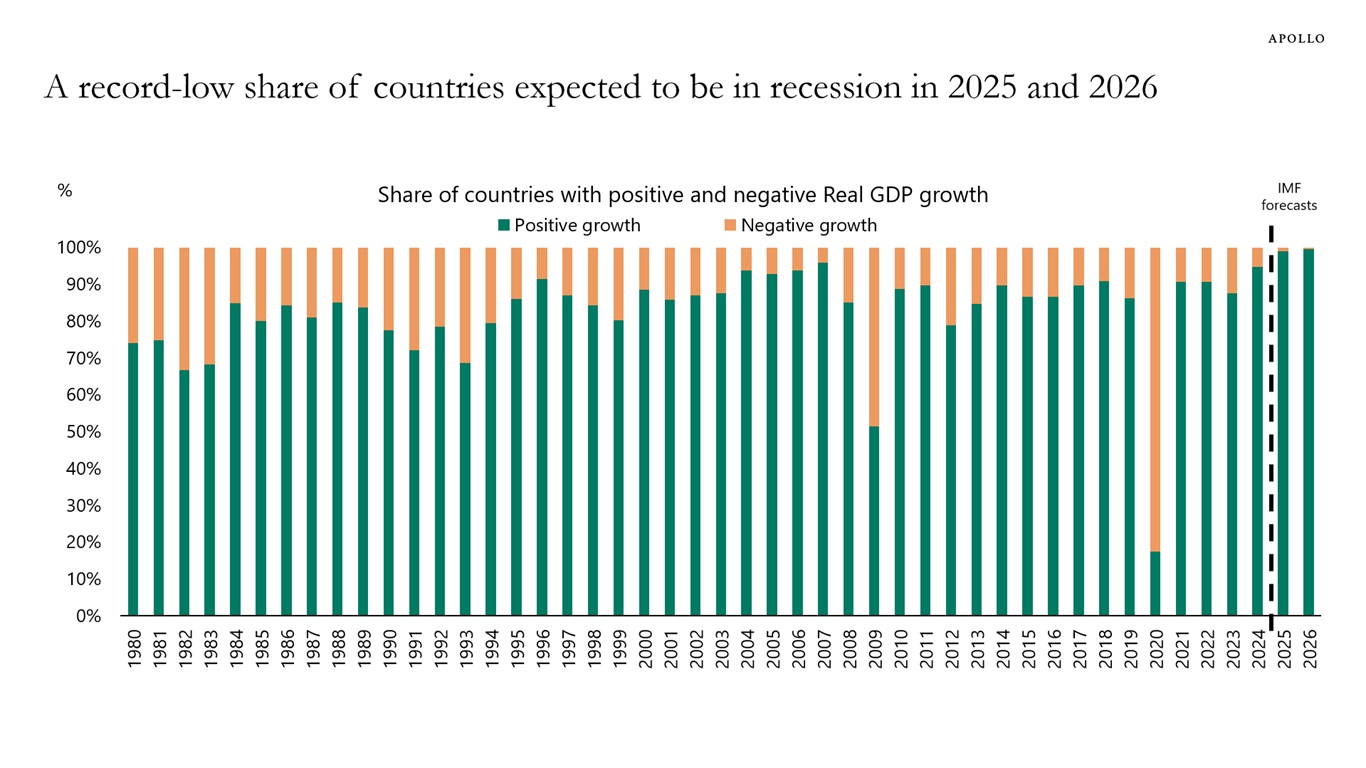
The IMF produces forecasts for 196 countries in the world, and their latest forecast shows that a record-low share of countries are expected to be in recession in 2025 and 2026, see chart below.

A record-low share of countries expected to be in recession in 2025 and 2026
Note: Sample includes 196 countries in the IMF WEO database. Source: IMF WEO, Apollo Chief Economist

Download high-res chart

Recent Posts

  • Strong Technical Demand for Credit
  • Fiscal Situation in Germany vs. Spain
  • Hedge Fund Leverage Rising Rapidly
  • The Financing Gap in Sports: Unlocking a $2.5 Trillion Opportunity
  • The US Retirement Crisis

Recent Comments

No comments to show.

Archives

  • December 2025
  • November 2025
  • October 2025
  • September 2025
  • August 2025
  • July 2025
  • June 2025
  • May 2025
  • April 2025
  • March 2025
  • February 2025
  • January 2025
  • December 2024
  • November 2024
  • October 2024
  • September 2024
  • August 2024
  • July 2024
  • June 2024
  • May 2024
  • April 2024
  • March 2024
  • February 2024
  • January 2024
  • December 2023
  • November 2023
  • October 2023
  • September 2023
  • August 2023
  • July 2023
  • June 2023
  • May 2023
  • April 2023
  • March 2023
  • February 2023
  • January 2023
  • December 2022
  • November 2022
  • October 2022
  • September 2022
  • August 2022
  • July 2022
  • June 2022
  • May 2022
  • April 2022
  • March 2022
  • February 2022
  • January 2022
  • December 2021
  • November 2021

Categories

  • Apollo Answers
  • Course Introductions
  • Economic Intelligence
  • Hide from Wordpress Search
  • Investment Knowledge
  • Perspectives
  • Redirecting
  • The Daily Spark
  • The View from Apollo
  • The Weekly Brief
  • Uncategorized
  • White Papers

The US Household Sector Enters 2025 in Excellent Shape

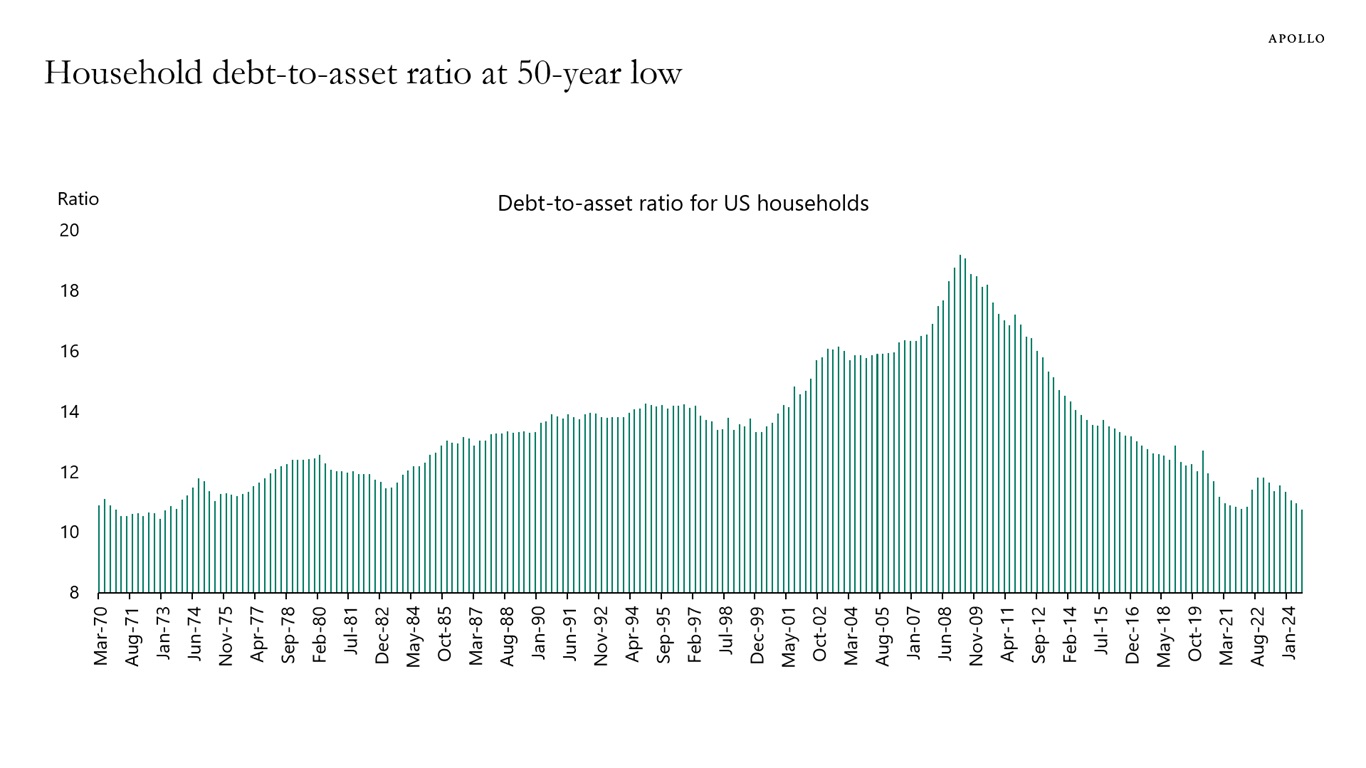
US stock prices and home prices have increased much faster than US household debt over the past 15 years, see chart below.

As a result, debt in the US household sector is at the lowest level in 50 years relative to assets.

In other words, US households benefit tremendously from the exceptional performance in US financial markets and the continued rise in US home prices.

Household debt-to-asset ratio at 50-year low
Source: Federal Reserve, Haver Analytics, Apollo Chief Economist

Download high-res chart

Recent Posts

  • Strong Technical Demand for Credit
  • Fiscal Situation in Germany vs. Spain
  • Hedge Fund Leverage Rising Rapidly
  • The Financing Gap in Sports: Unlocking a $2.5 Trillion Opportunity
  • The US Retirement Crisis

Recent Comments

No comments to show.

Archives

  • December 2025
  • November 2025
  • October 2025
  • September 2025
  • August 2025
  • July 2025
  • June 2025
  • May 2025
  • April 2025
  • March 2025
  • February 2025
  • January 2025
  • December 2024
  • November 2024
  • October 2024
  • September 2024
  • August 2024
  • July 2024
  • June 2024
  • May 2024
  • April 2024
  • March 2024
  • February 2024
  • January 2024
  • December 2023
  • November 2023
  • October 2023
  • September 2023
  • August 2023
  • July 2023
  • June 2023
  • May 2023
  • April 2023
  • March 2023
  • February 2023
  • January 2023
  • December 2022
  • November 2022
  • October 2022
  • September 2022
  • August 2022
  • July 2022
  • June 2022
  • May 2022
  • April 2022
  • March 2022
  • February 2022
  • January 2022
  • December 2021
  • November 2021

Categories

  • Apollo Answers
  • Course Introductions
  • Economic Intelligence
  • Hide from Wordpress Search
  • Investment Knowledge
  • Perspectives
  • Redirecting
  • The Daily Spark
  • The View from Apollo
  • The Weekly Brief
  • Uncategorized
  • White Papers

The Problem with the Current S&P 500 Narrative

The narrative in markets is that the outlook for the US is great, and the outlook for Europe, UK, and China is not good.

For markets, the problem with this narrative is that 41% of revenues in the S&P 500 come from abroad. If we have a recession in Europe and a continued slowdown in China, it will have a significant negative impact on earnings for S&P 500 companies.

41% of revenue in S&P 500 companies comes from abroad
Source: FactSet, Apollo Chief Economist

Download high-res chart

Recent Posts

  • Strong Technical Demand for Credit
  • Fiscal Situation in Germany vs. Spain
  • Hedge Fund Leverage Rising Rapidly
  • The Financing Gap in Sports: Unlocking a $2.5 Trillion Opportunity
  • The US Retirement Crisis

Recent Comments

No comments to show.

Archives

  • December 2025
  • November 2025
  • October 2025
  • September 2025
  • August 2025
  • July 2025
  • June 2025
  • May 2025
  • April 2025
  • March 2025
  • February 2025
  • January 2025
  • December 2024
  • November 2024
  • October 2024
  • September 2024
  • August 2024
  • July 2024
  • June 2024
  • May 2024
  • April 2024
  • March 2024
  • February 2024
  • January 2024
  • December 2023
  • November 2023
  • October 2023
  • September 2023
  • August 2023
  • July 2023
  • June 2023
  • May 2023
  • April 2023
  • March 2023
  • February 2023
  • January 2023
  • December 2022
  • November 2022
  • October 2022
  • September 2022
  • August 2022
  • July 2022
  • June 2022
  • May 2022
  • April 2022
  • March 2022
  • February 2022
  • January 2022
  • December 2021
  • November 2021

Categories

  • Apollo Answers
  • Course Introductions
  • Economic Intelligence
  • Hide from Wordpress Search
  • Investment Knowledge
  • Perspectives
  • Redirecting
  • The Daily Spark
  • The View from Apollo
  • The Weekly Brief
  • Uncategorized
  • White Papers

The Economy Is Re-Accelerating

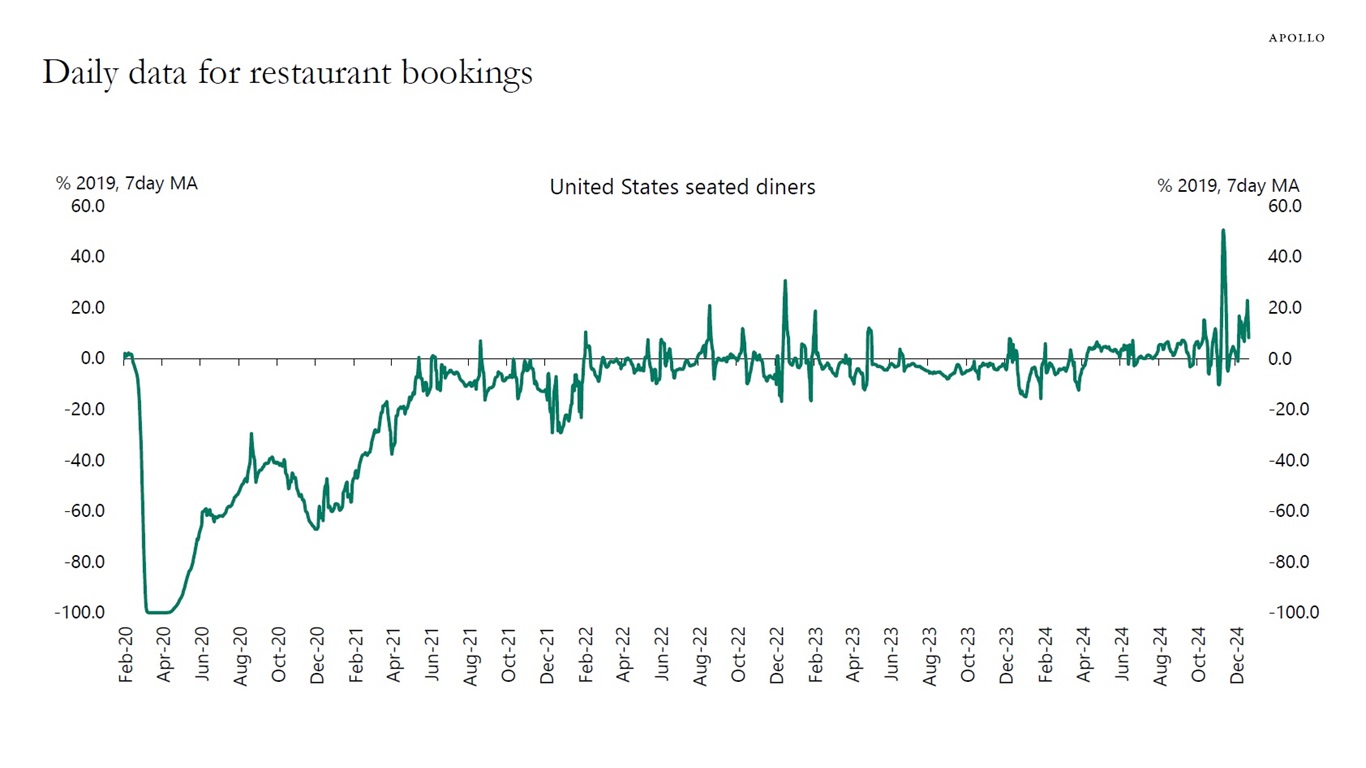
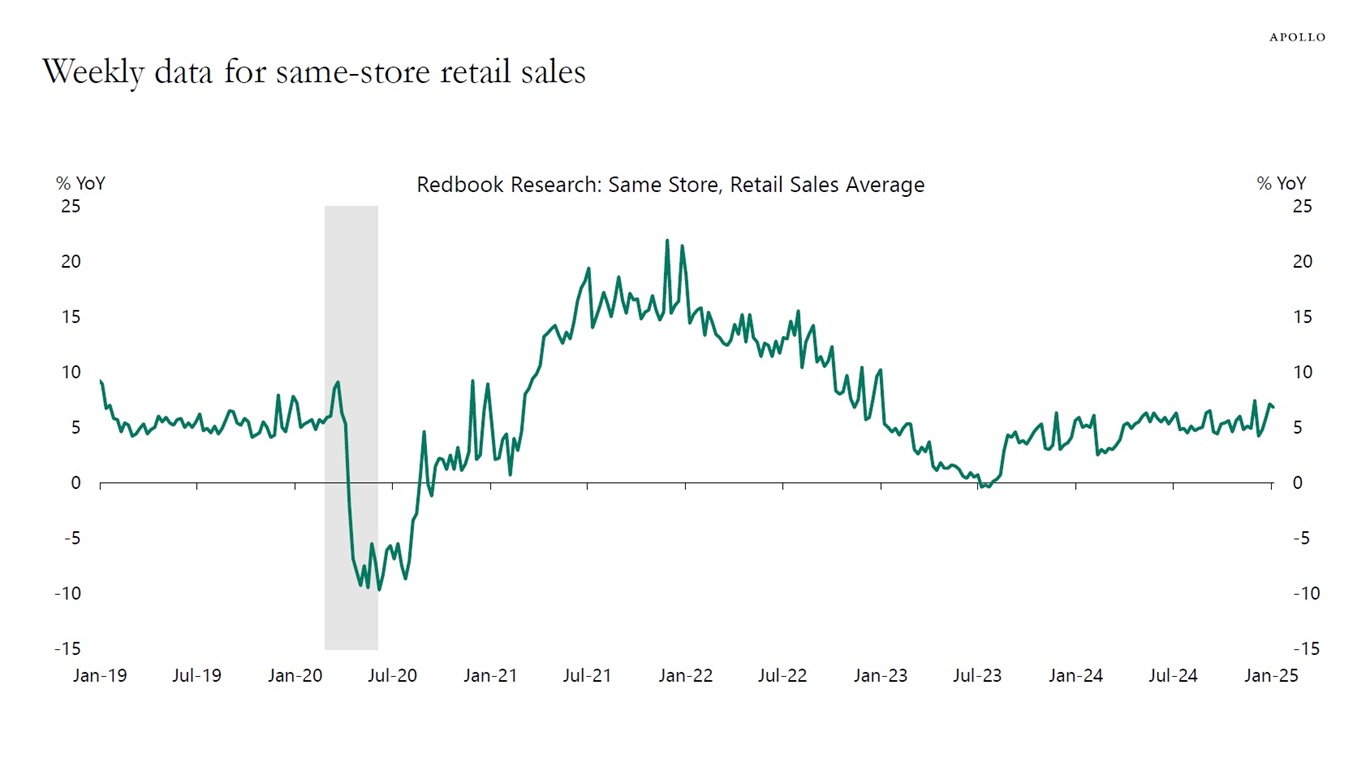
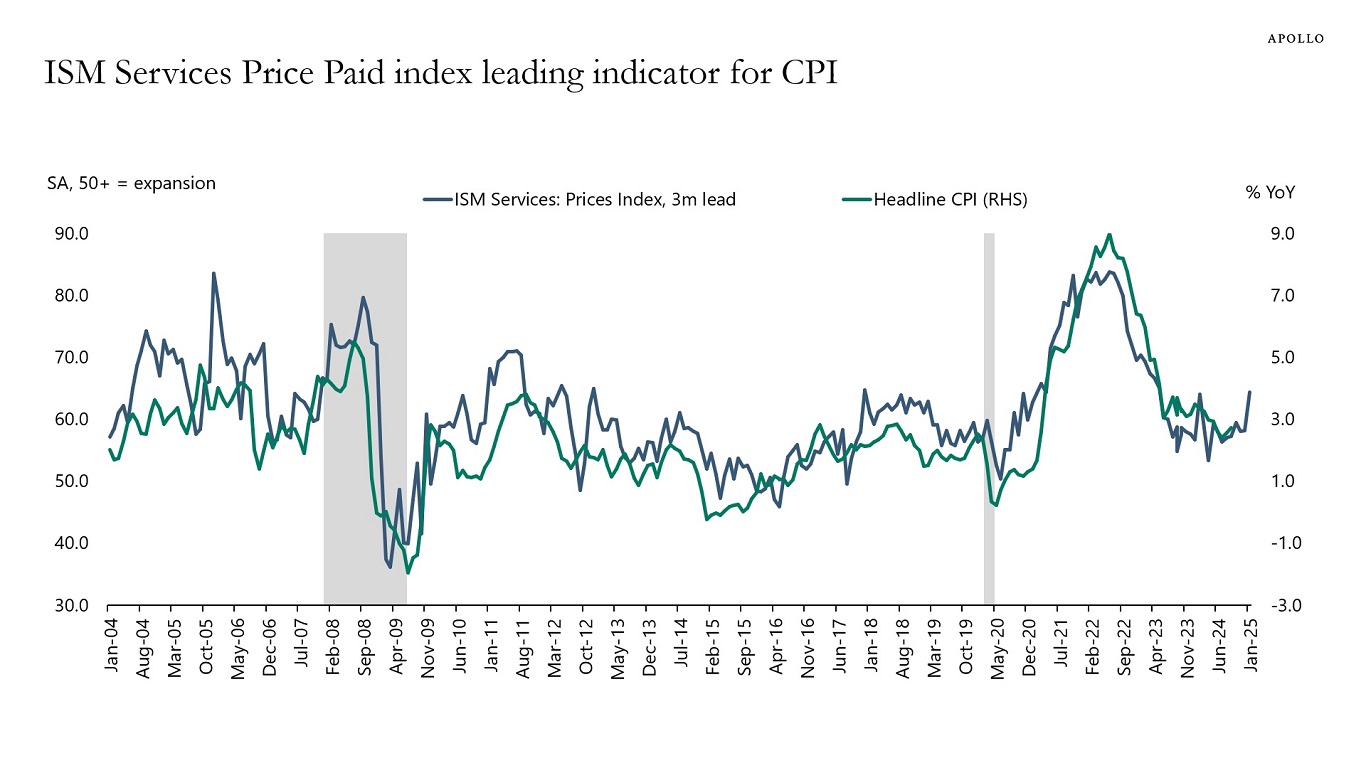
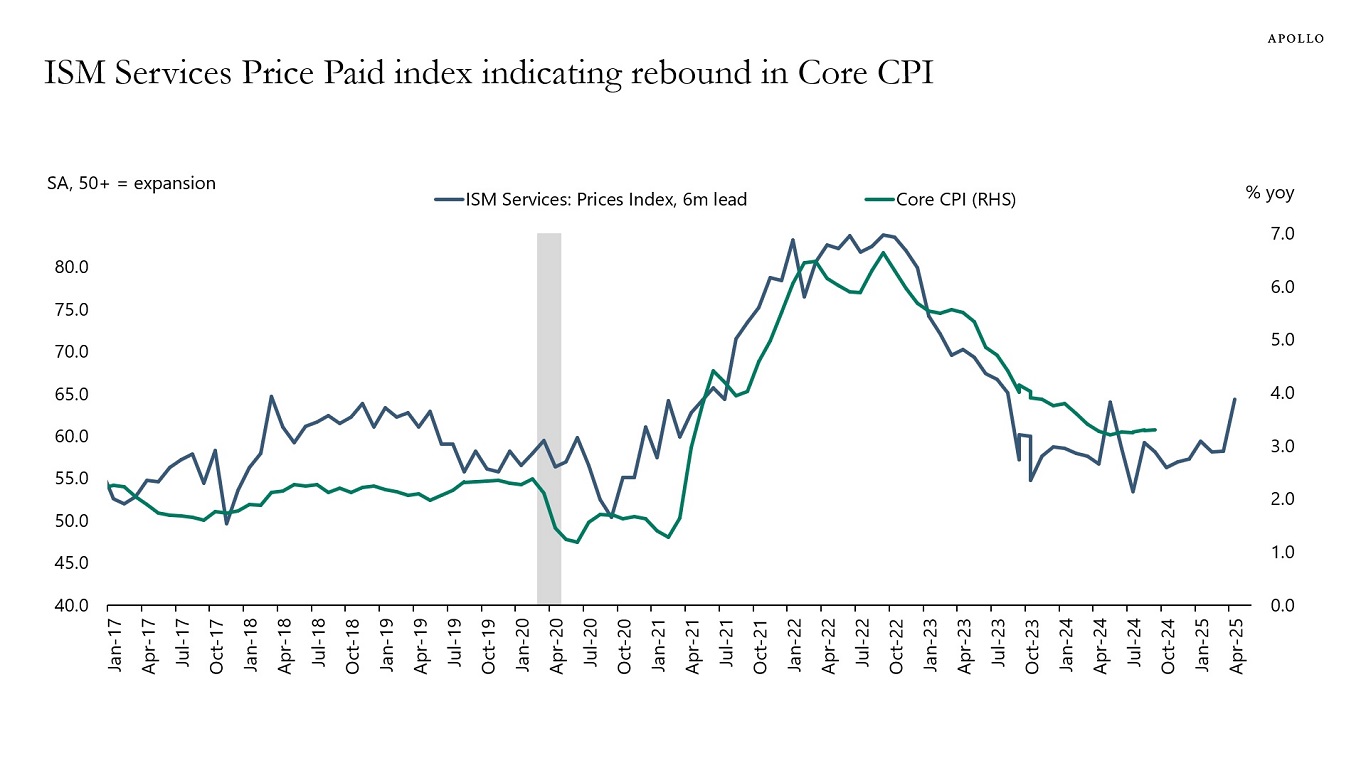
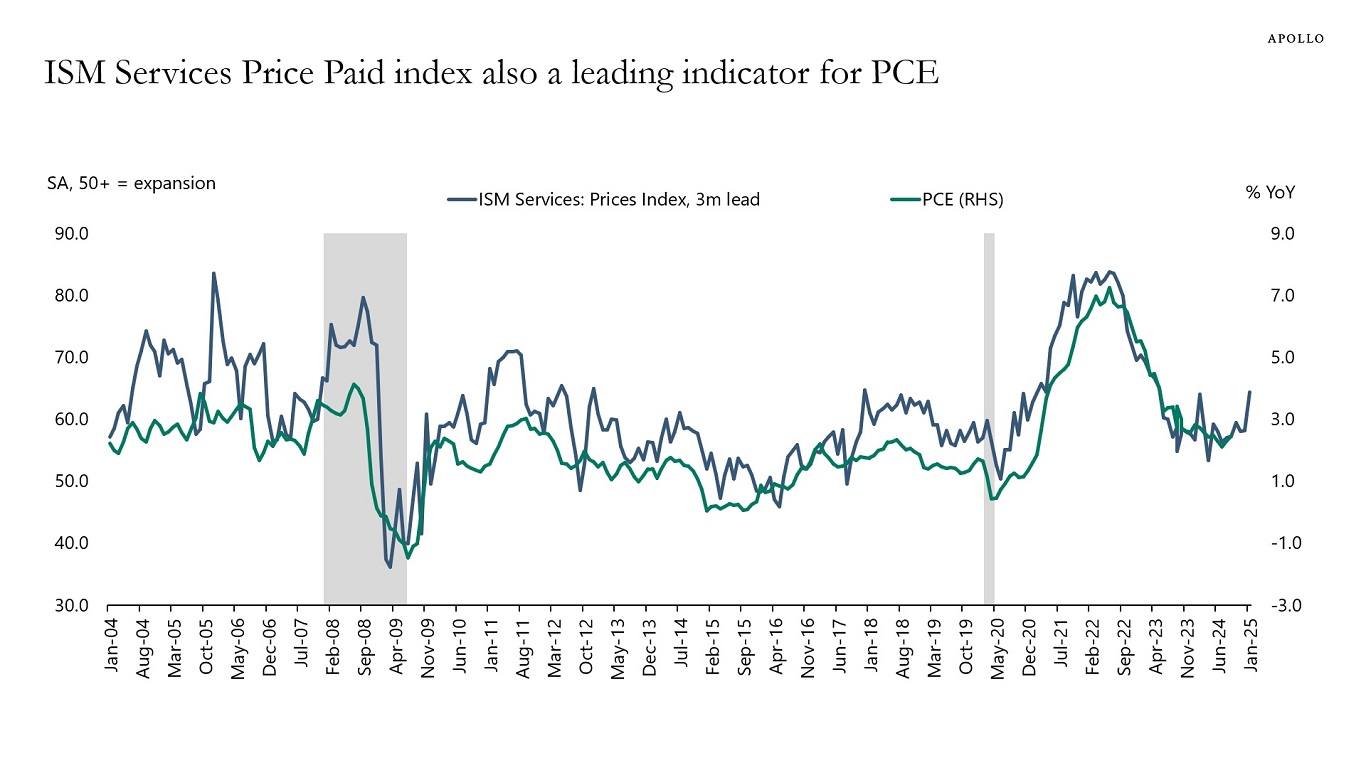
This week, the employment report came in stronger than expected, weekly same-store retail sales were better than expected, and Prices Paid for ISM Services came in higher than expected.

The bottom line is that momentum in the economy is strong, and the narrative that monetary policy is restrictive is wrong.

Combined with higher animal spirits and the latest Atlanta Fed GDP estimate at 2.7%, we see a 40% probability that the Fed will hike rates in 2025.

Our latest chart book with daily and weekly indicators for the US economy is available here.

Daily data for restaurant bookings
Source: OpenTable, Apollo Chief Economist
Weekly data for same-store retail sales
Source: Redbook, Haver Analytics, Apollo Chief Economist
Weekly bankruptcy filings
For week ending on January 10th, 2025. Note: Filings are for companies with more than $50 million in liabilities. Source: Bloomberg, Apollo Chief Economist
Weekly business formation statistics
Source: Census, Haver Analytics, Apollo Chief Economist
Weekly economic indicators for New York, California, and Texas trending higher
Note: The economic conditions indices are computed with mixed-frequency dynamic factor models with weekly, monthly, and quarterly variables that cover multiple dimensions of state economies. The indices are scaled to 4-quarter growth rates of U.S. real GDP and normalized such that a value of zero indicates national long-run growth. Source: Baumeister, Christiane, Danilo Leiva-Leon, and Eric Sims (2024), “Tracking Weekly State-Level Economic Conditions,” “Review of Economics and Statistics, 106(2), 483-504,” Apollo Chief Economist
Daily data for debit card transactions
Note: Consists largely of debit card transactions. Source: Bloomberg, Apollo Chief Economist
Financial conditions today are easier than when the Fed started raising interest rates
Source: Bloomberg, Apollo Chief Economist
Daily NYC mobility indicators
Source: MTA, Apollo Chief Economist

Download high-res chart book

Recent Posts

  • Strong Technical Demand for Credit
  • Fiscal Situation in Germany vs. Spain
  • Hedge Fund Leverage Rising Rapidly
  • The Financing Gap in Sports: Unlocking a $2.5 Trillion Opportunity
  • The US Retirement Crisis

Recent Comments

No comments to show.

Archives

  • December 2025
  • November 2025
  • October 2025
  • September 2025
  • August 2025
  • July 2025
  • June 2025
  • May 2025
  • April 2025
  • March 2025
  • February 2025
  • January 2025
  • December 2024
  • November 2024
  • October 2024
  • September 2024
  • August 2024
  • July 2024
  • June 2024
  • May 2024
  • April 2024
  • March 2024
  • February 2024
  • January 2024
  • December 2023
  • November 2023
  • October 2023
  • September 2023
  • August 2023
  • July 2023
  • June 2023
  • May 2023
  • April 2023
  • March 2023
  • February 2023
  • January 2023
  • December 2022
  • November 2022
  • October 2022
  • September 2022
  • August 2022
  • July 2022
  • June 2022
  • May 2022
  • April 2022
  • March 2022
  • February 2022
  • January 2022
  • December 2021
  • November 2021

Categories

  • Apollo Answers
  • Course Introductions
  • Economic Intelligence
  • Hide from Wordpress Search
  • Investment Knowledge
  • Perspectives
  • Redirecting
  • The Daily Spark
  • The View from Apollo
  • The Weekly Brief
  • Uncategorized
  • White Papers

Americans Are Optimistic About the US Economic Outlook

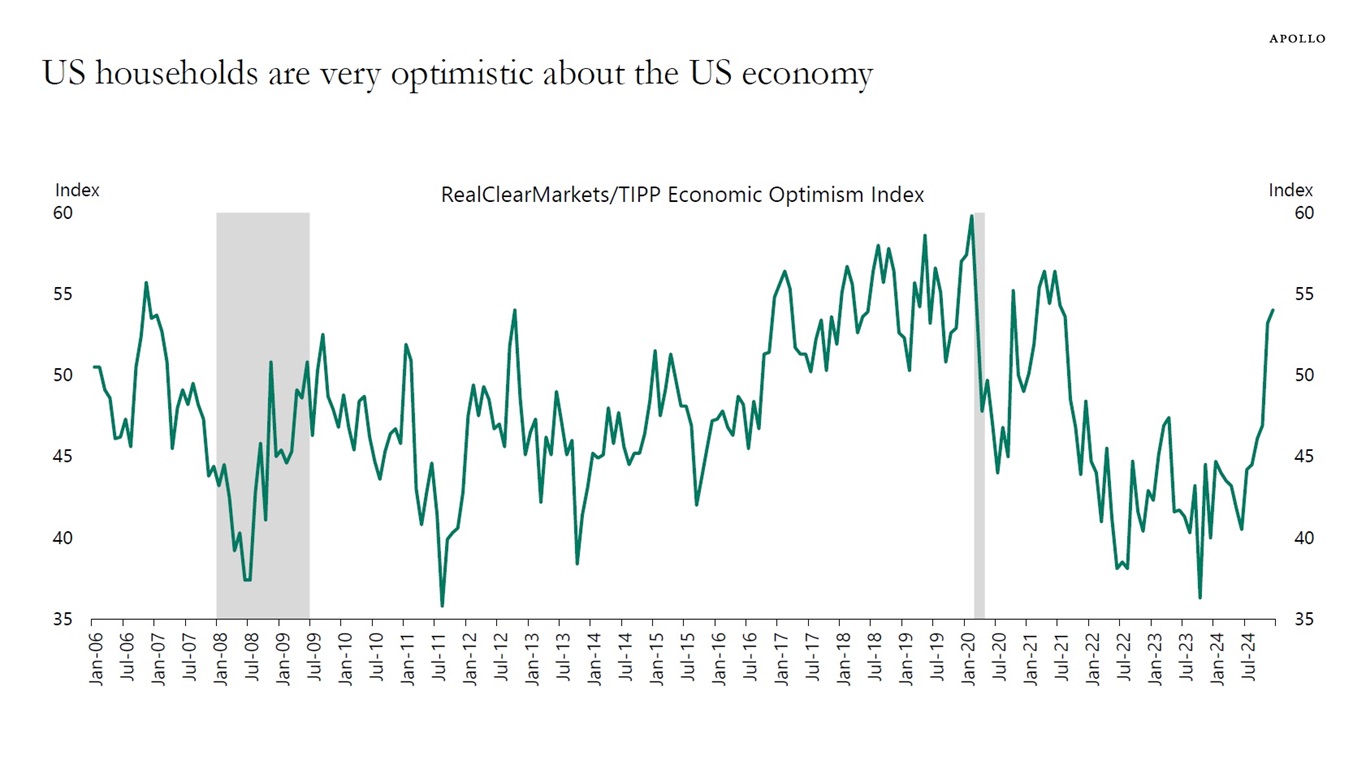
The RealClearMarkets/TIPP Economic Optimism Index measures Americans’ optimism about the US economy.

Specifically, the index is based on a nationwide survey of 1,300 adults and is made up of three subindexes, including one for the respondent’s economic outlook six months into the future, the respondent’s personal financial outlook, and how the respondent views current federal policies.

The latest data shows that US households have turned very optimistic about the US economic outlook in recent months, see chart below.

US households are very optimistic about the US economy
Source: Technometrica Market Intelligence/RealClearMarkets, Apollo Chief Economist

Download high-res chart

Recent Posts

  • Strong Technical Demand for Credit
  • Fiscal Situation in Germany vs. Spain
  • Hedge Fund Leverage Rising Rapidly
  • The Financing Gap in Sports: Unlocking a $2.5 Trillion Opportunity
  • The US Retirement Crisis

Recent Comments

No comments to show.

Archives

  • December 2025
  • November 2025
  • October 2025
  • September 2025
  • August 2025
  • July 2025
  • June 2025
  • May 2025
  • April 2025
  • March 2025
  • February 2025
  • January 2025
  • December 2024
  • November 2024
  • October 2024
  • September 2024
  • August 2024
  • July 2024
  • June 2024
  • May 2024
  • April 2024
  • March 2024
  • February 2024
  • January 2024
  • December 2023
  • November 2023
  • October 2023
  • September 2023
  • August 2023
  • July 2023
  • June 2023
  • May 2023
  • April 2023
  • March 2023
  • February 2023
  • January 2023
  • December 2022
  • November 2022
  • October 2022
  • September 2022
  • August 2022
  • July 2022
  • June 2022
  • May 2022
  • April 2022
  • March 2022
  • February 2022
  • January 2022
  • December 2021
  • November 2021

Categories

  • Apollo Answers
  • Course Introductions
  • Economic Intelligence
  • Hide from Wordpress Search
  • Investment Knowledge
  • Perspectives
  • Redirecting
  • The Daily Spark
  • The View from Apollo
  • The Weekly Brief
  • Uncategorized
  • White Papers

Inflation Reaccelerating

The recent jump in ISM Prices Paid points to a coming reacceleration in both headline and core inflation, see charts below. 

ISM Services Price Paid index leading indicator for CPI
Source: BLS, ISM, Haver Analytics, Apollo Chief Economist
ISM Services Price Paid index indicating rebound in Core CPI
Source: BLS, ISM, Haver Analytics, Apollo Chief Economist
ISM Services Price Paid index also a leading indicator for PCE
Source: BEA, ISM, Haver Analytics, Apollo Chief Economist
ISM Services Price Paid index also indicating rebound in Core PCE
Source: BEA, ISM, Haver Analytics, Apollo Chief Economist

Download high-res charts

Recent Posts

  • Strong Technical Demand for Credit
  • Fiscal Situation in Germany vs. Spain
  • Hedge Fund Leverage Rising Rapidly
  • The Financing Gap in Sports: Unlocking a $2.5 Trillion Opportunity
  • The US Retirement Crisis

Recent Comments

No comments to show.

Archives

  • December 2025
  • November 2025
  • October 2025
  • September 2025
  • August 2025
  • July 2025
  • June 2025
  • May 2025
  • April 2025
  • March 2025
  • February 2025
  • January 2025
  • December 2024
  • November 2024
  • October 2024
  • September 2024
  • August 2024
  • July 2024
  • June 2024
  • May 2024
  • April 2024
  • March 2024
  • February 2024
  • January 2024
  • December 2023
  • November 2023
  • October 2023
  • September 2023
  • August 2023
  • July 2023
  • June 2023
  • May 2023
  • April 2023
  • March 2023
  • February 2023
  • January 2023
  • December 2022
  • November 2022
  • October 2022
  • September 2022
  • August 2022
  • July 2022
  • June 2022
  • May 2022
  • April 2022
  • March 2022
  • February 2022
  • January 2022
  • December 2021
  • November 2021

Categories

  • Apollo Answers
  • Course Introductions
  • Economic Intelligence
  • Hide from Wordpress Search
  • Investment Knowledge
  • Perspectives
  • Redirecting
  • The Daily Spark
  • The View from Apollo
  • The Weekly Brief
  • Uncategorized
  • White Papers

Japan Accelerating, China Decelerating

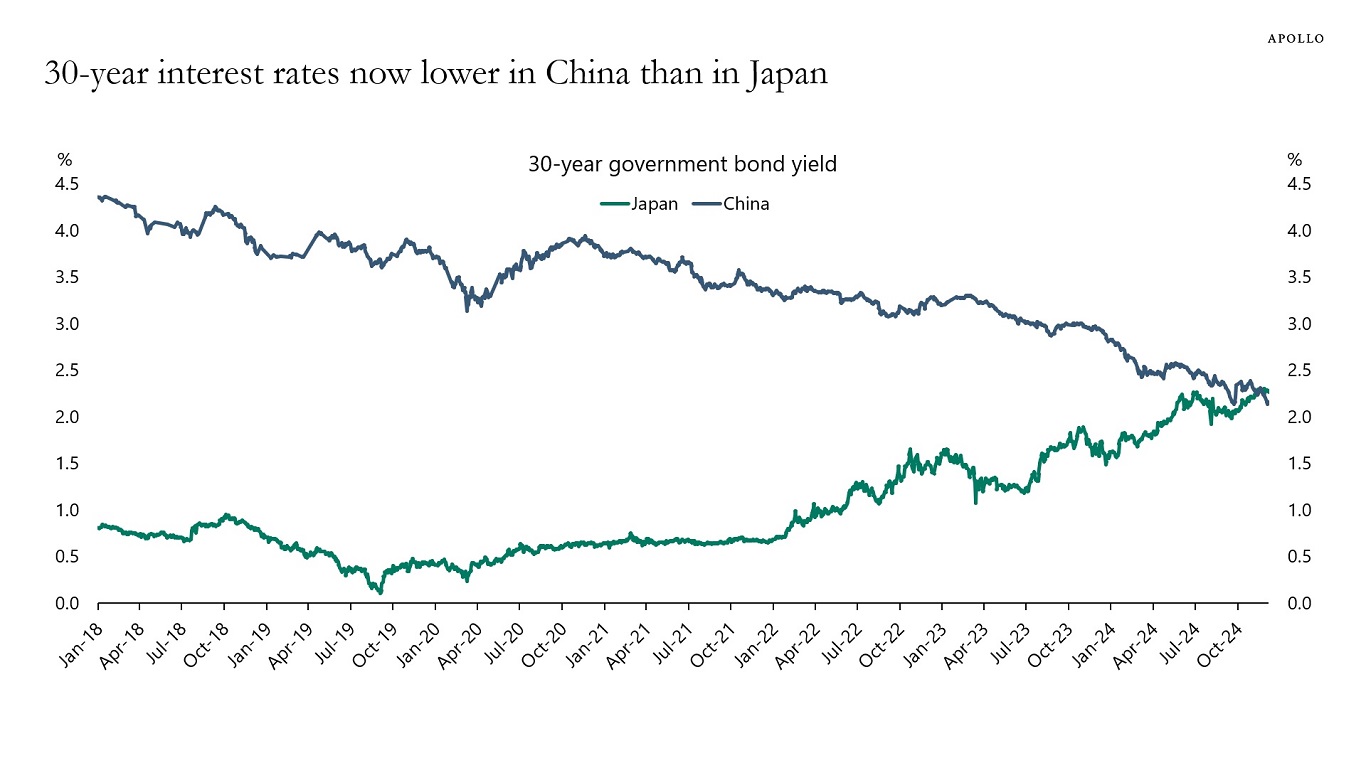
Growth and inflation are rising in Japan and falling in China. As a result, 30-year government bond yields are now lower in China than in Japan, see chart below.

30-year interest rates now lower in China than in Japan
Source: Bloomberg, Apollo Chief Economist

Download high-res chart

Recent Posts

  • Strong Technical Demand for Credit
  • Fiscal Situation in Germany vs. Spain
  • Hedge Fund Leverage Rising Rapidly
  • The Financing Gap in Sports: Unlocking a $2.5 Trillion Opportunity
  • The US Retirement Crisis

Recent Comments

No comments to show.

Archives

  • December 2025
  • November 2025
  • October 2025
  • September 2025
  • August 2025
  • July 2025
  • June 2025
  • May 2025
  • April 2025
  • March 2025
  • February 2025
  • January 2025
  • December 2024
  • November 2024
  • October 2024
  • September 2024
  • August 2024
  • July 2024
  • June 2024
  • May 2024
  • April 2024
  • March 2024
  • February 2024
  • January 2024
  • December 2023
  • November 2023
  • October 2023
  • September 2023
  • August 2023
  • July 2023
  • June 2023
  • May 2023
  • April 2023
  • March 2023
  • February 2023
  • January 2023
  • December 2022
  • November 2022
  • October 2022
  • September 2022
  • August 2022
  • July 2022
  • June 2022
  • May 2022
  • April 2022
  • March 2022
  • February 2022
  • January 2022
  • December 2021
  • November 2021

Categories

  • Apollo Answers
  • Course Introductions
  • Economic Intelligence
  • Hide from Wordpress Search
  • Investment Knowledge
  • Perspectives
  • Redirecting
  • The Daily Spark
  • The View from Apollo
  • The Weekly Brief
  • Uncategorized
  • White Papers

The Move in Long Rates Is Very Unusual

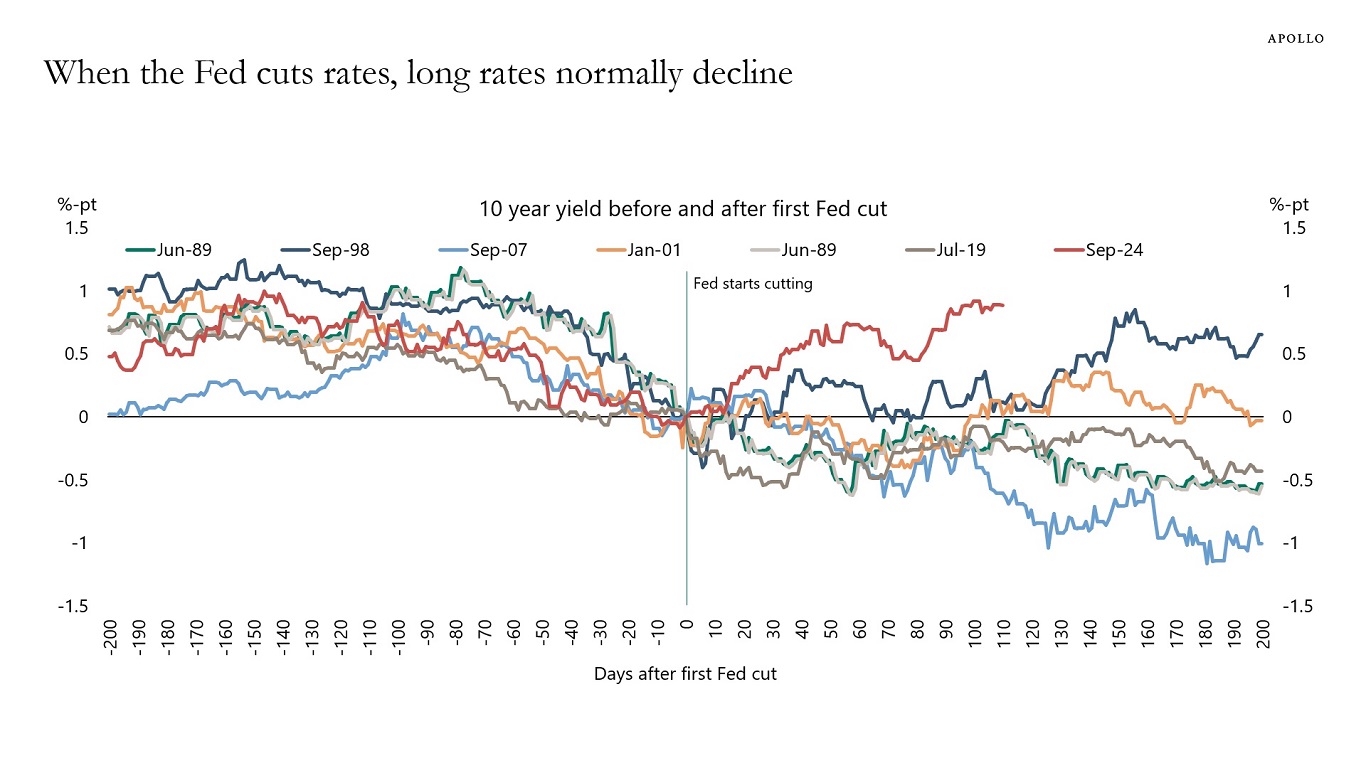
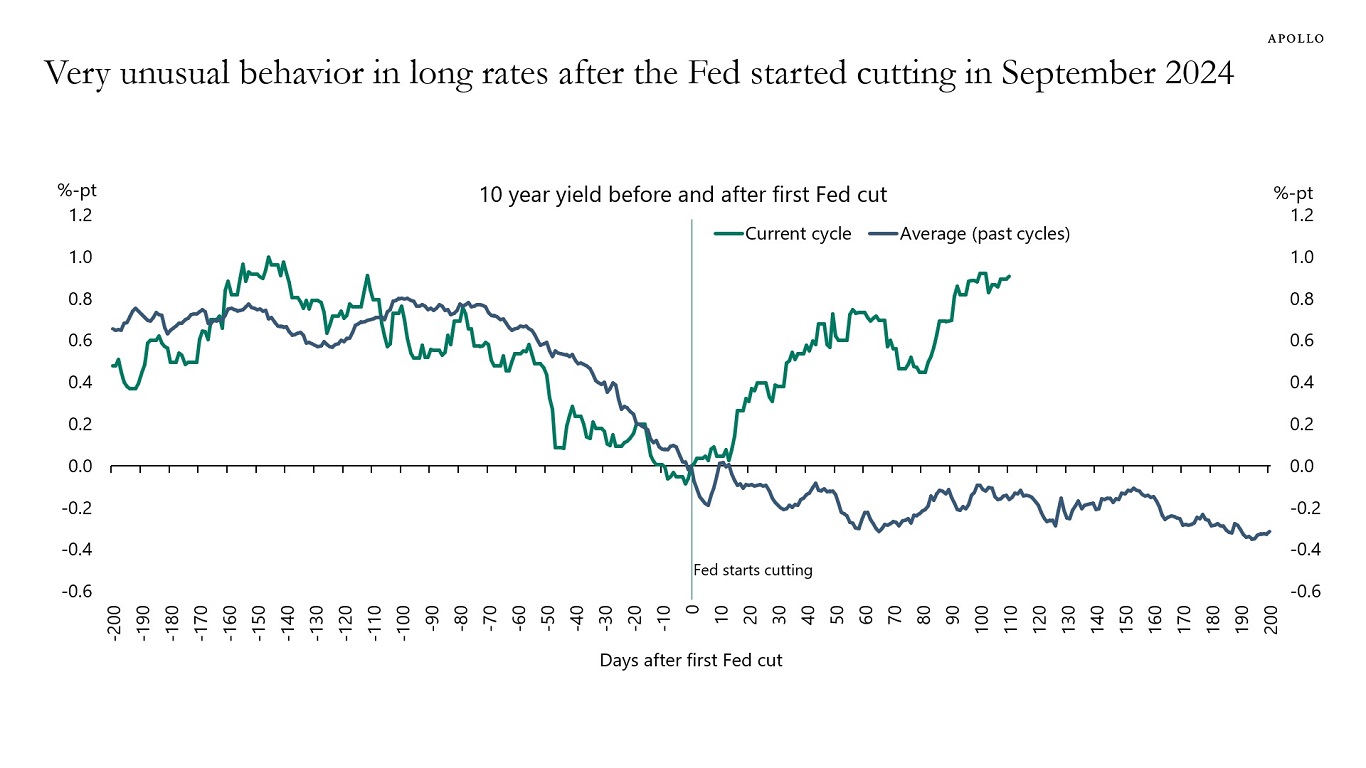
The Fed has cut interest rates 100 basis points since September, and over the same period, 10-year interest rates are up 100 basis points. This is highly unusual, see charts below. Is it fiscal worries? Is it less demand from abroad? Or maybe Fed cuts were not justified? The market is telling us something, and it is very important for investors to have a view on why long rates are going up when the Fed is cutting.

When the Fed cuts rates, long rates normally decline
Source: Bloomberg, Apollo Chief Economist
Very unusual behavior in long rates after the Fed started cutting in September 2024
Source: Bloomberg, Apollo Chief Economist

Download high-res charts

Recent Posts

  • Strong Technical Demand for Credit
  • Fiscal Situation in Germany vs. Spain
  • Hedge Fund Leverage Rising Rapidly
  • The Financing Gap in Sports: Unlocking a $2.5 Trillion Opportunity
  • The US Retirement Crisis

Recent Comments

No comments to show.

Archives

  • December 2025
  • November 2025
  • October 2025
  • September 2025
  • August 2025
  • July 2025
  • June 2025
  • May 2025
  • April 2025
  • March 2025
  • February 2025
  • January 2025
  • December 2024
  • November 2024
  • October 2024
  • September 2024
  • August 2024
  • July 2024
  • June 2024
  • May 2024
  • April 2024
  • March 2024
  • February 2024
  • January 2024
  • December 2023
  • November 2023
  • October 2023
  • September 2023
  • August 2023
  • July 2023
  • June 2023
  • May 2023
  • April 2023
  • March 2023
  • February 2023
  • January 2023
  • December 2022
  • November 2022
  • October 2022
  • September 2022
  • August 2022
  • July 2022
  • June 2022
  • May 2022
  • April 2022
  • March 2022
  • February 2022
  • January 2022
  • December 2021
  • November 2021

Categories

  • Apollo Answers
  • Course Introductions
  • Economic Intelligence
  • Hide from Wordpress Search
  • Investment Knowledge
  • Perspectives
  • Redirecting
  • The Daily Spark
  • The View from Apollo
  • The Weekly Brief
  • Uncategorized
  • White Papers

Price-to-Book Ratio for the S&P 500 at All-Time Highs

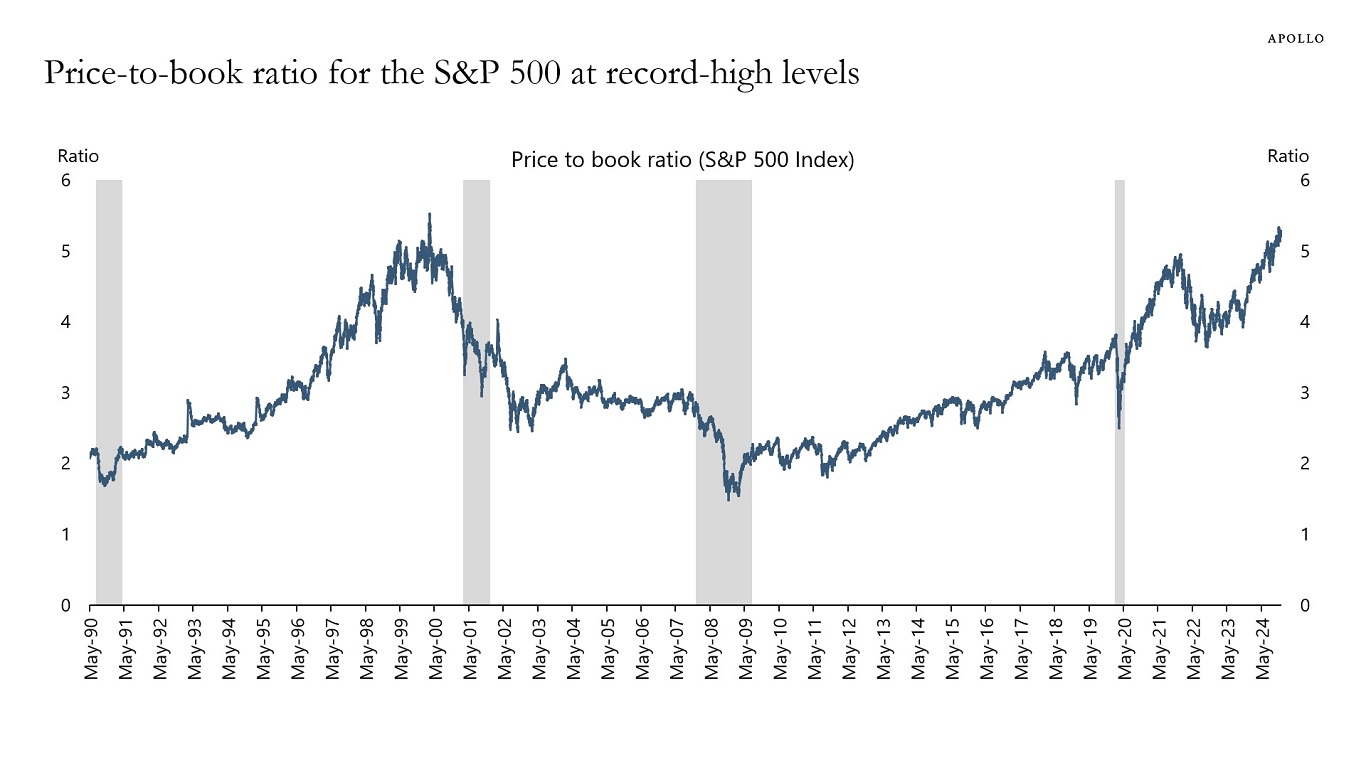
The price-to-book ratio for the S&P 500 is at record-high levels, see chart below. This is another piece of evidence that stocks are expensive at the moment.

Price-to-book ratio for the S&P 500 at record-high levels
Source: Bloomberg, Apollo Chief Economist

Download high-res chart

Recent Posts

  • Strong Technical Demand for Credit
  • Fiscal Situation in Germany vs. Spain
  • Hedge Fund Leverage Rising Rapidly
  • The Financing Gap in Sports: Unlocking a $2.5 Trillion Opportunity
  • The US Retirement Crisis

Recent Comments

No comments to show.

Archives

  • December 2025
  • November 2025
  • October 2025
  • September 2025
  • August 2025
  • July 2025
  • June 2025
  • May 2025
  • April 2025
  • March 2025
  • February 2025
  • January 2025
  • December 2024
  • November 2024
  • October 2024
  • September 2024
  • August 2024
  • July 2024
  • June 2024
  • May 2024
  • April 2024
  • March 2024
  • February 2024
  • January 2024
  • December 2023
  • November 2023
  • October 2023
  • September 2023
  • August 2023
  • July 2023
  • June 2023
  • May 2023
  • April 2023
  • March 2023
  • February 2023
  • January 2023
  • December 2022
  • November 2022
  • October 2022
  • September 2022
  • August 2022
  • July 2022
  • June 2022
  • May 2022
  • April 2022
  • March 2022
  • February 2022
  • January 2022
  • December 2021
  • November 2021

Categories

  • Apollo Answers
  • Course Introductions
  • Economic Intelligence
  • Hide from Wordpress Search
  • Investment Knowledge
  • Perspectives
  • Redirecting
  • The Daily Spark
  • The View from Apollo
  • The Weekly Brief
  • Uncategorized
  • White Papers

10 Charts Showing the US Consumer Is in Excellent Shape

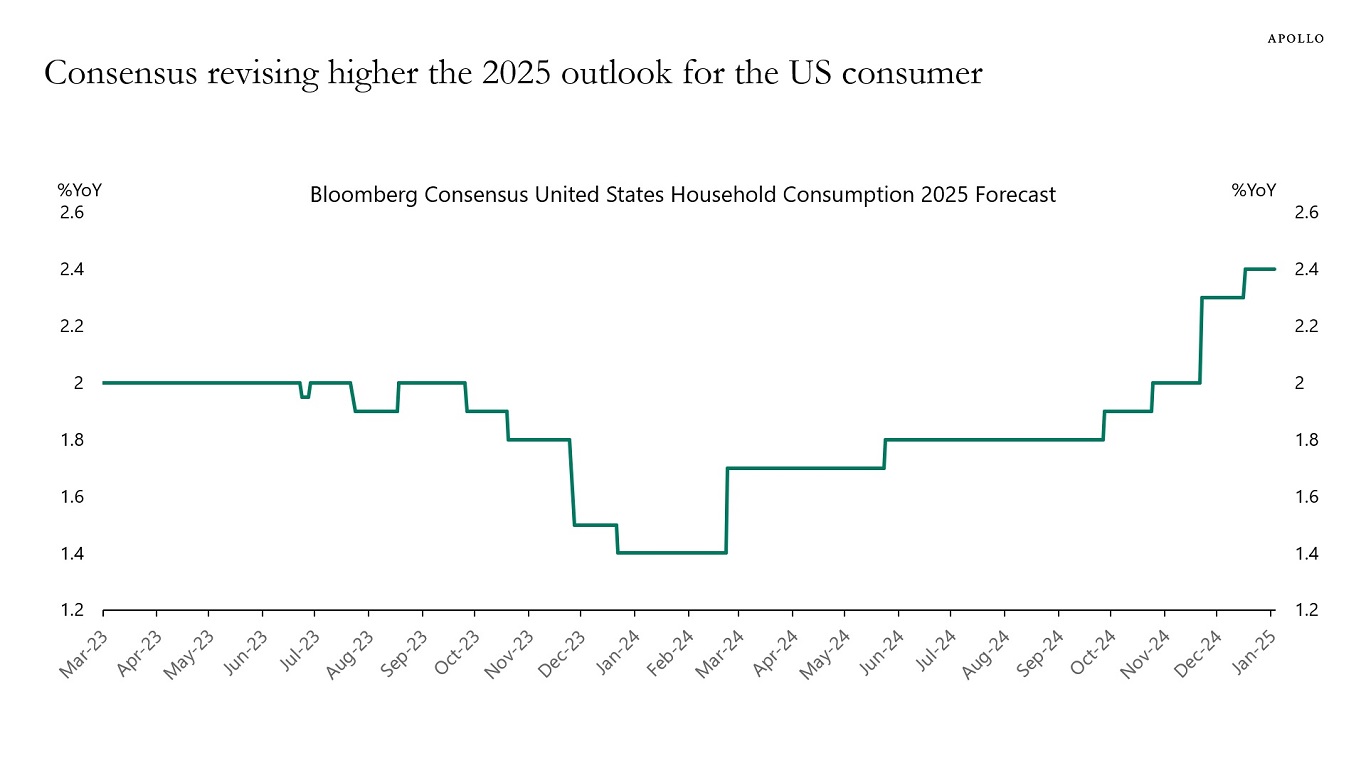
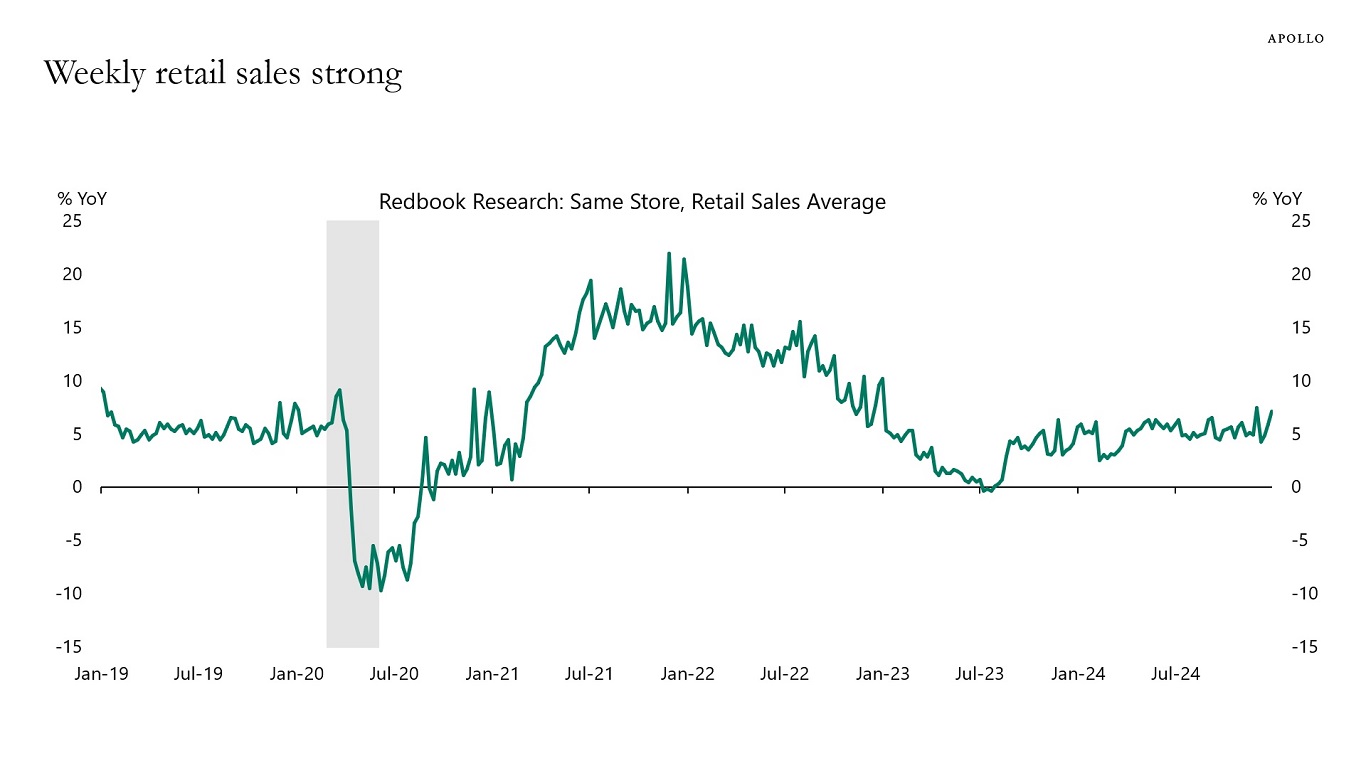
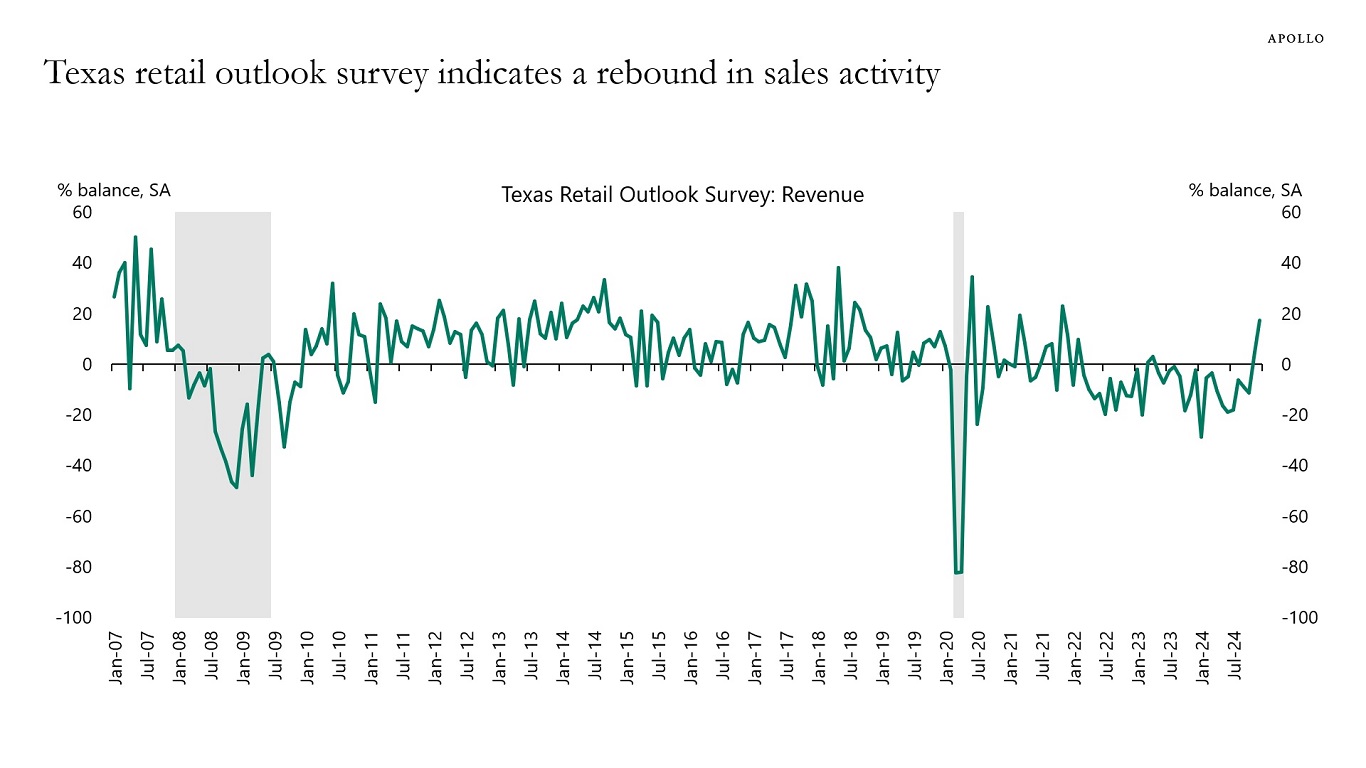
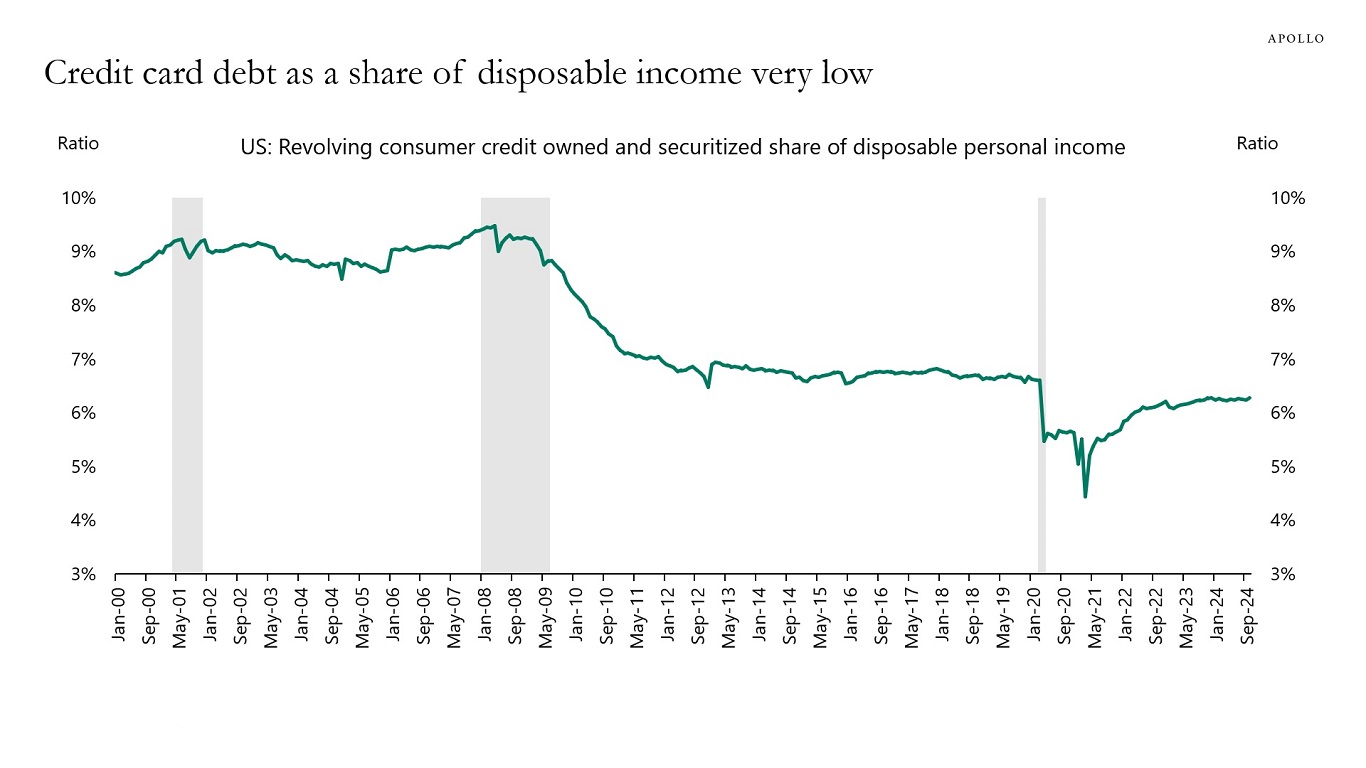
The US consumer is in incredible shape.

Specifically:

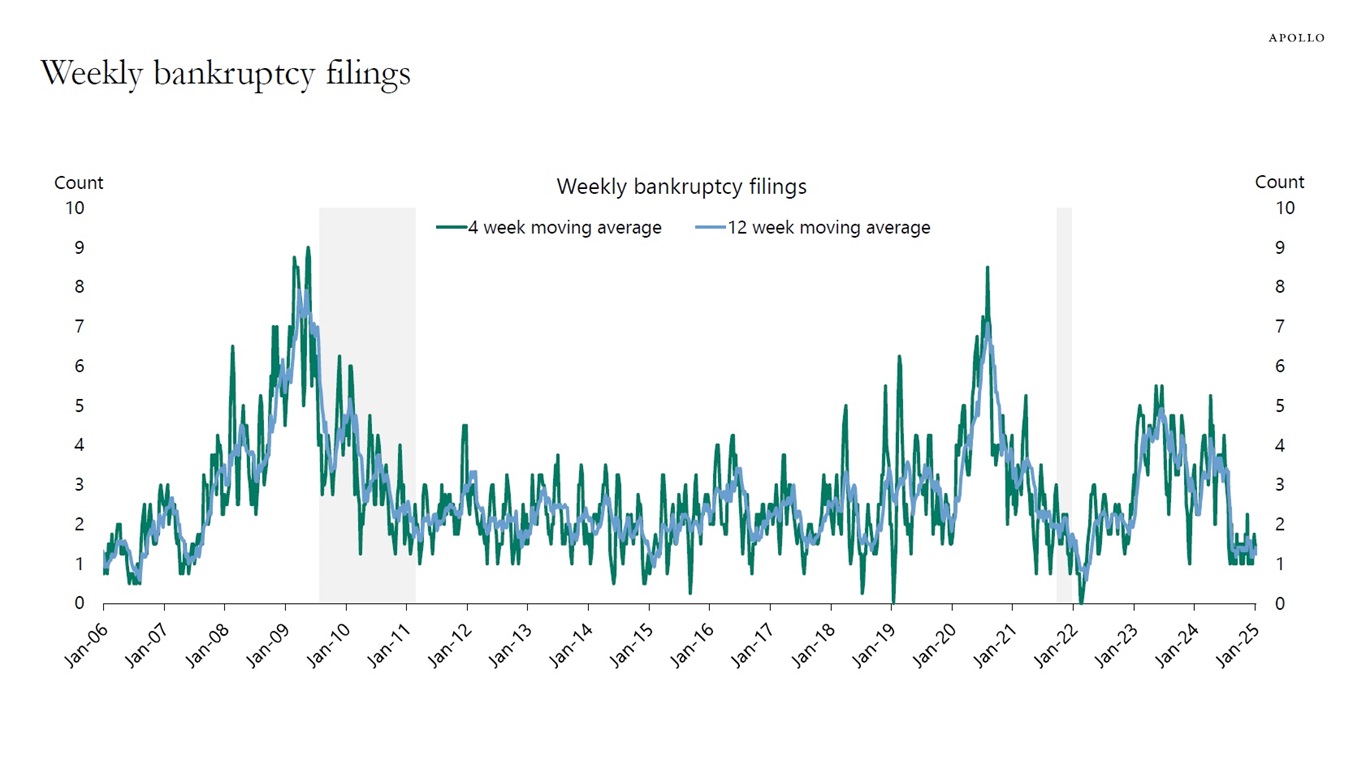
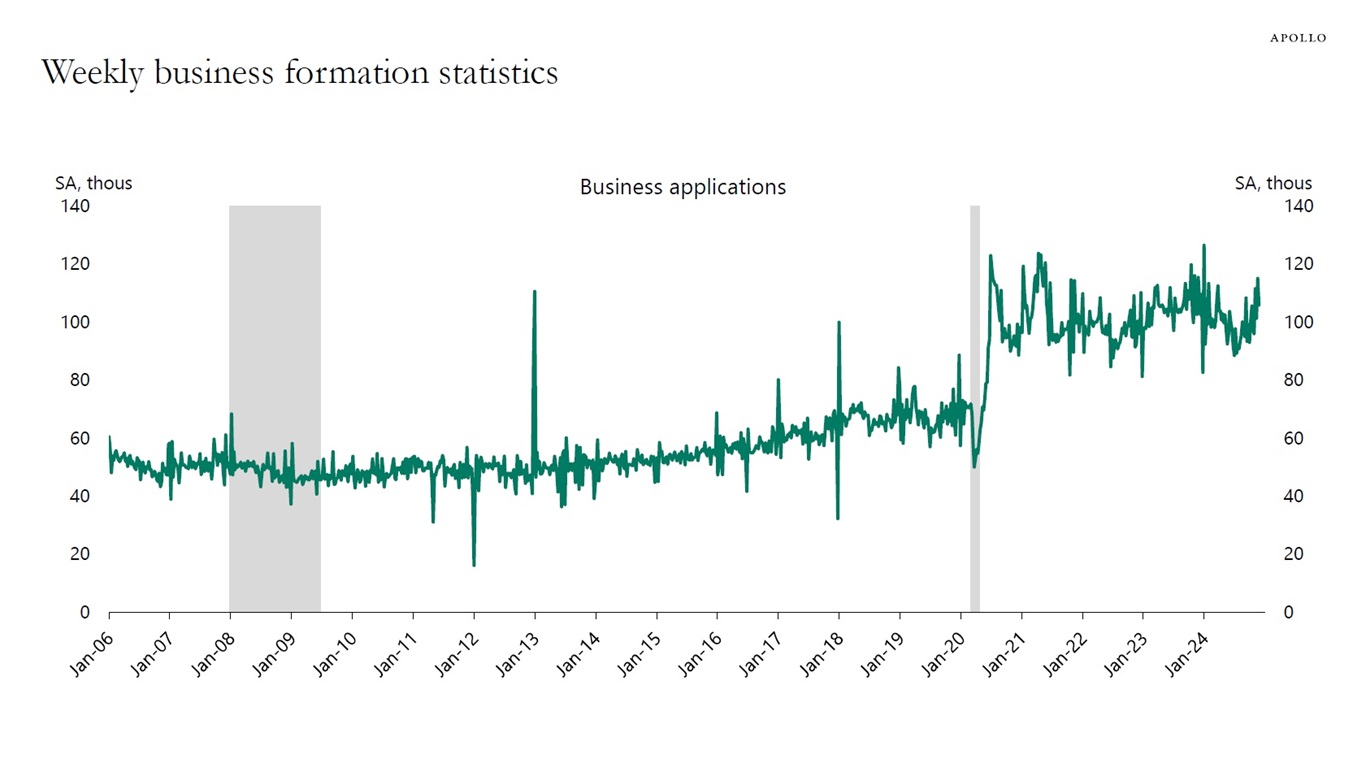
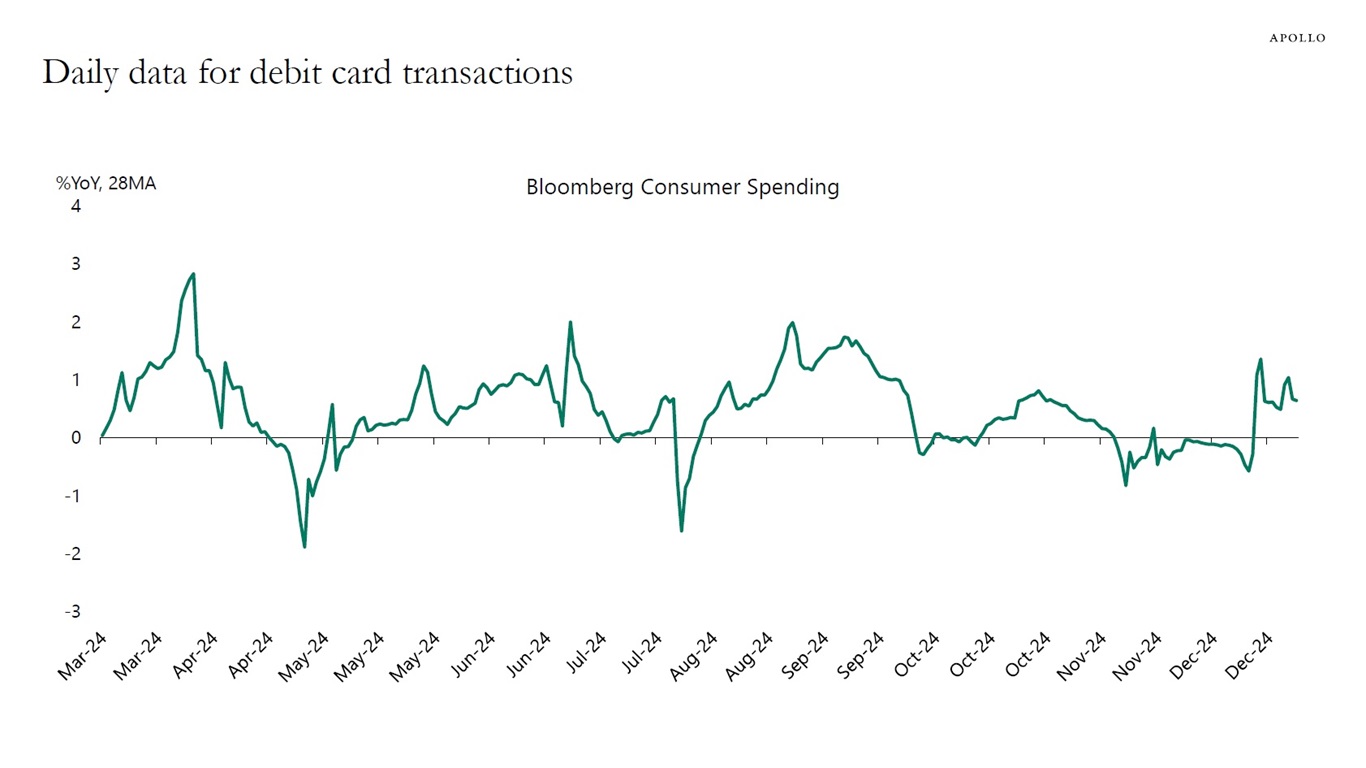
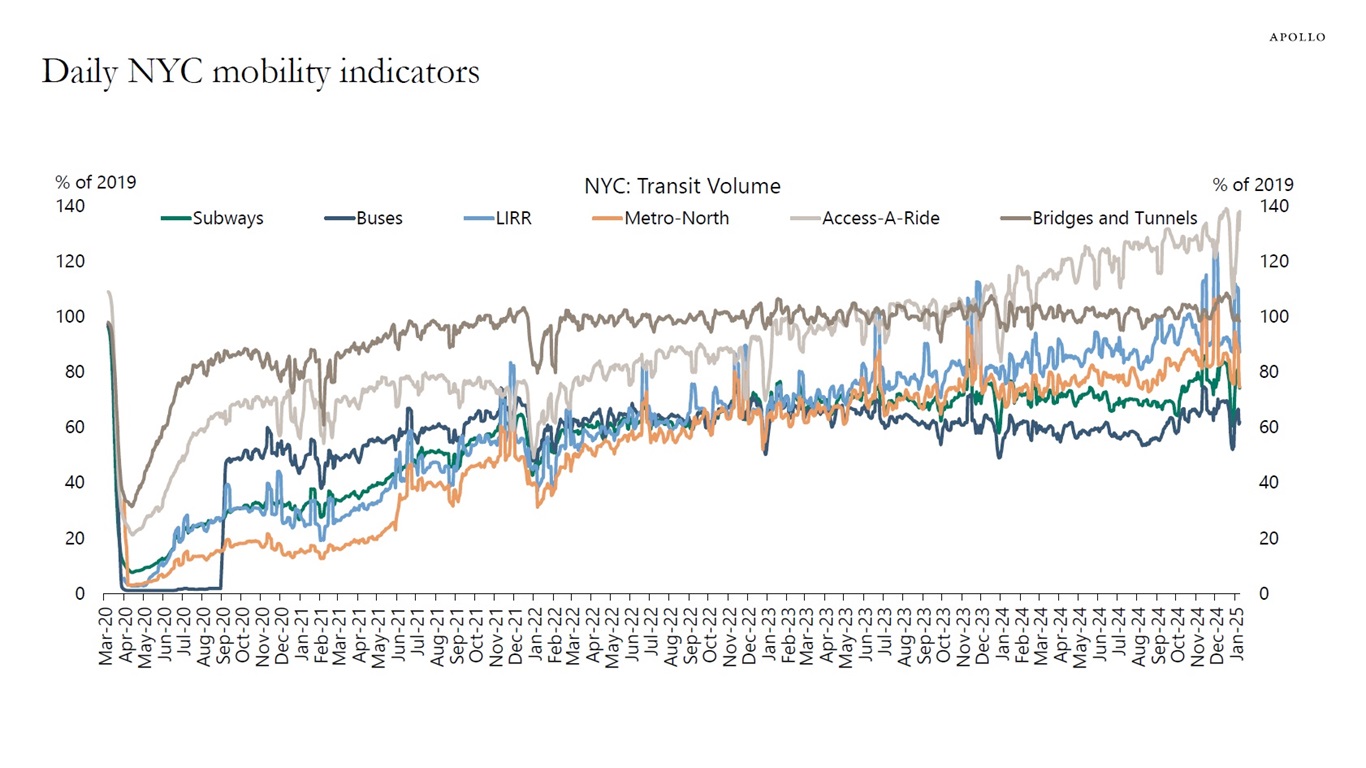
– The incoming weekly data shows continued strength in consumer spending, and outlook surveys show continued strength ahead (Charts 1 to 3).

– Credit card debt as a share of disposable income is below pre-pandemic levels (Chart 4).

– The effective interest rate on mortgage debt outstanding is only 4% (Chart 5).

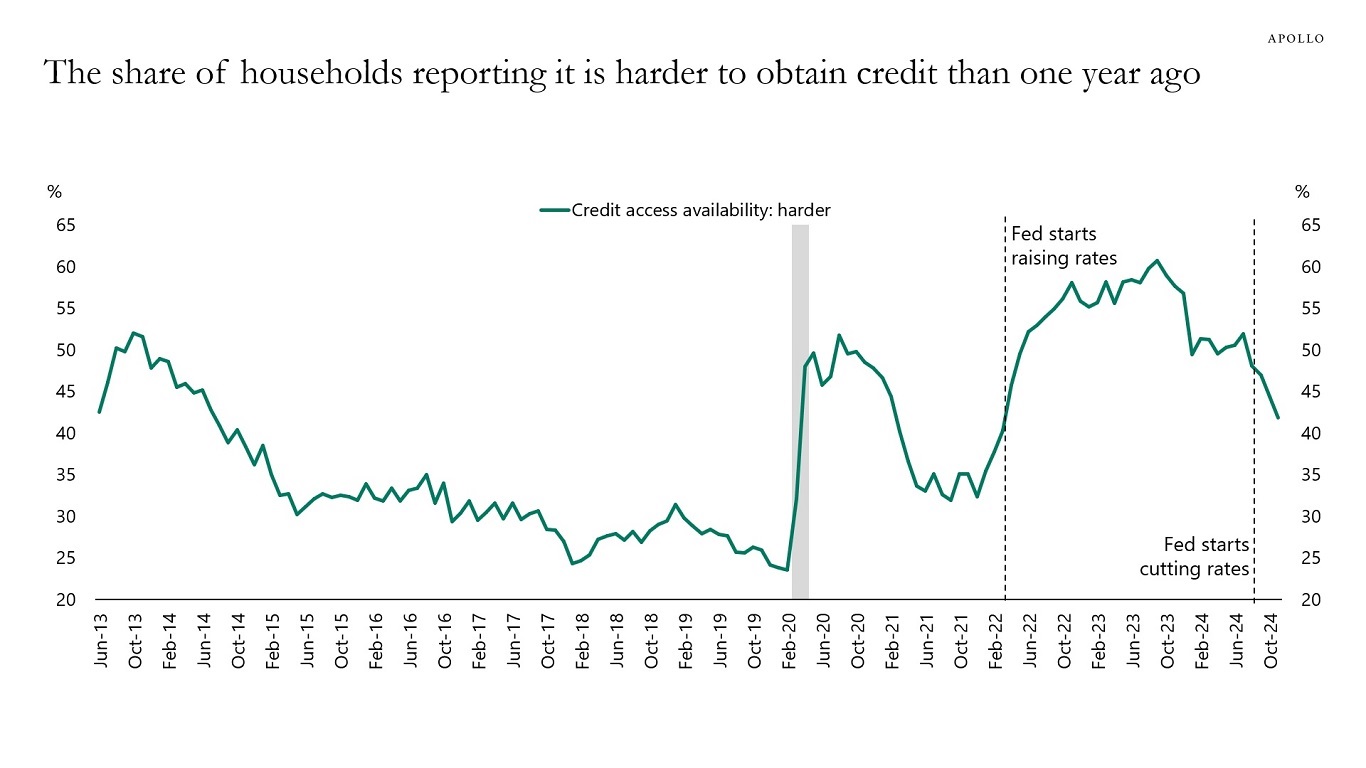
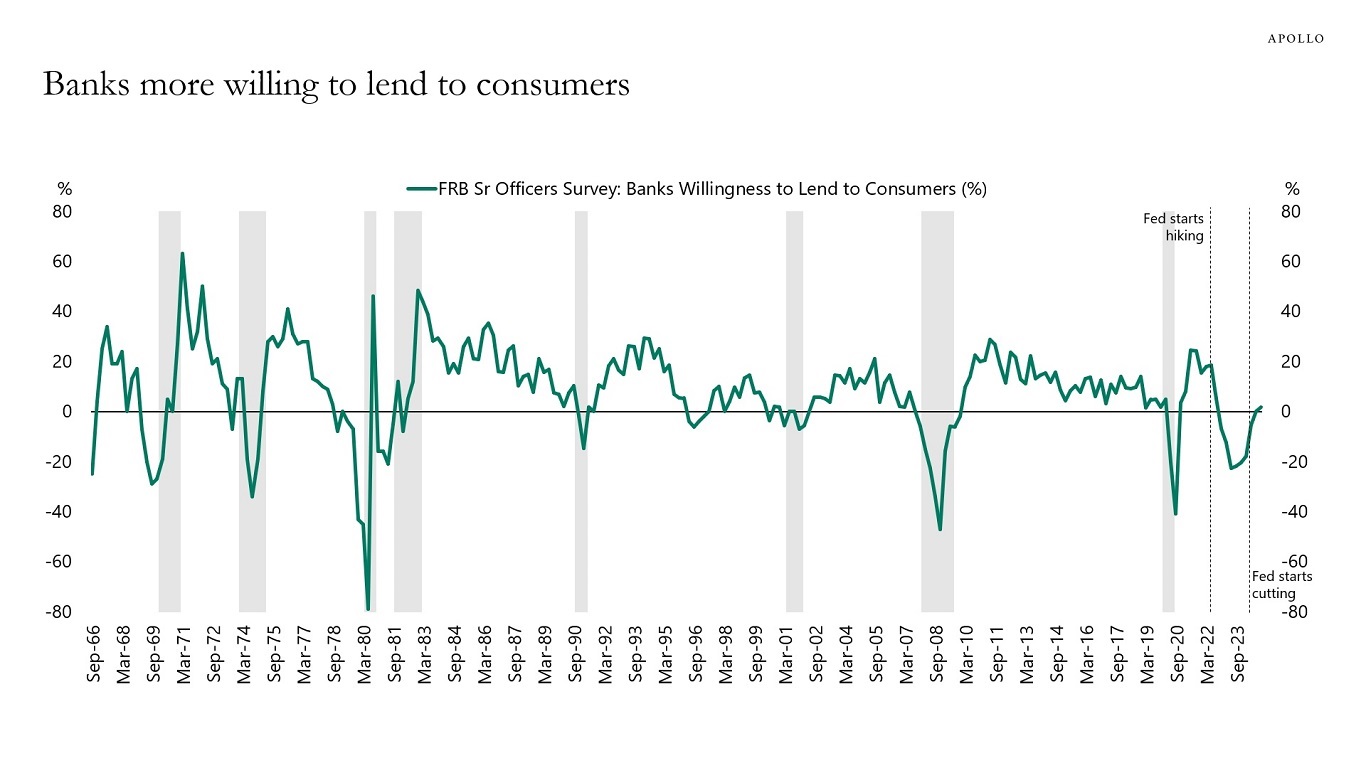
– Households are reporting that it is easier to get access to credit, and banks are more willing to lend to consumers (Charts 6 and 7).

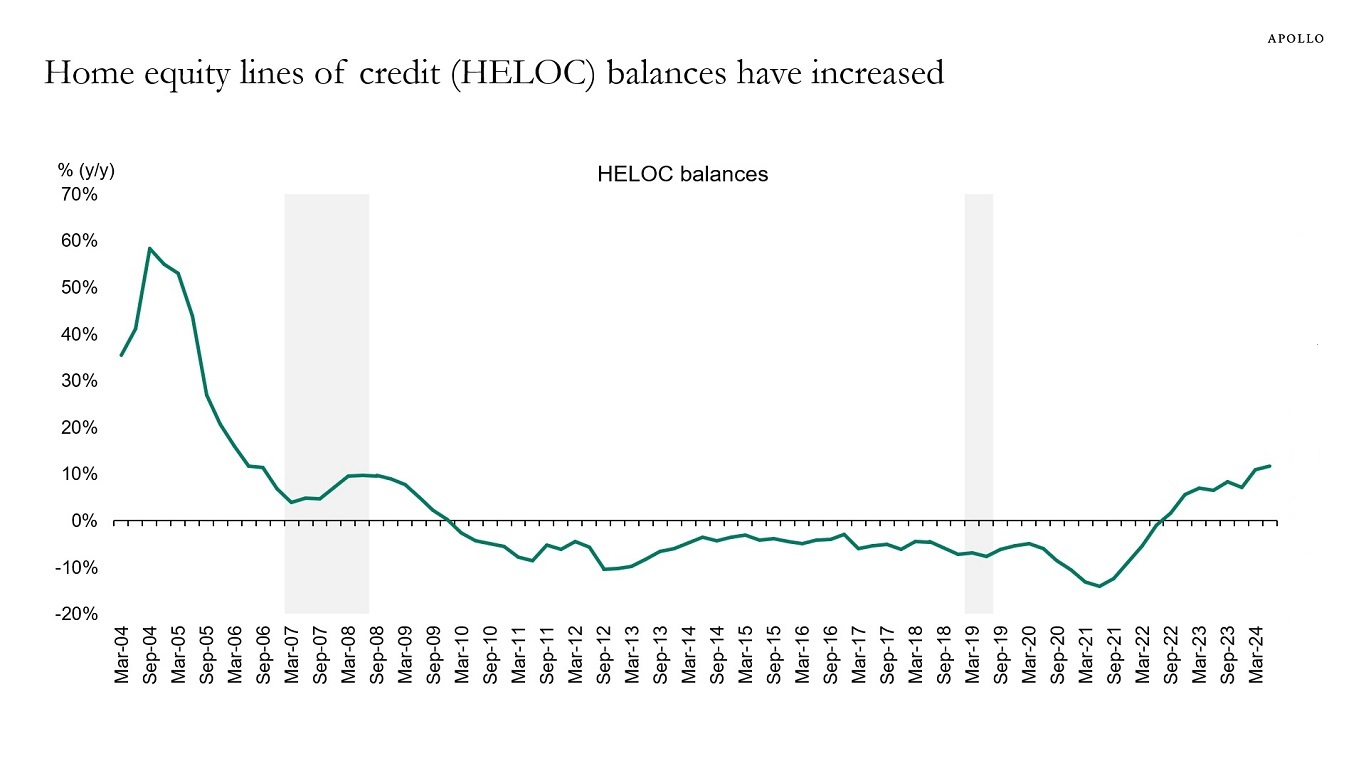
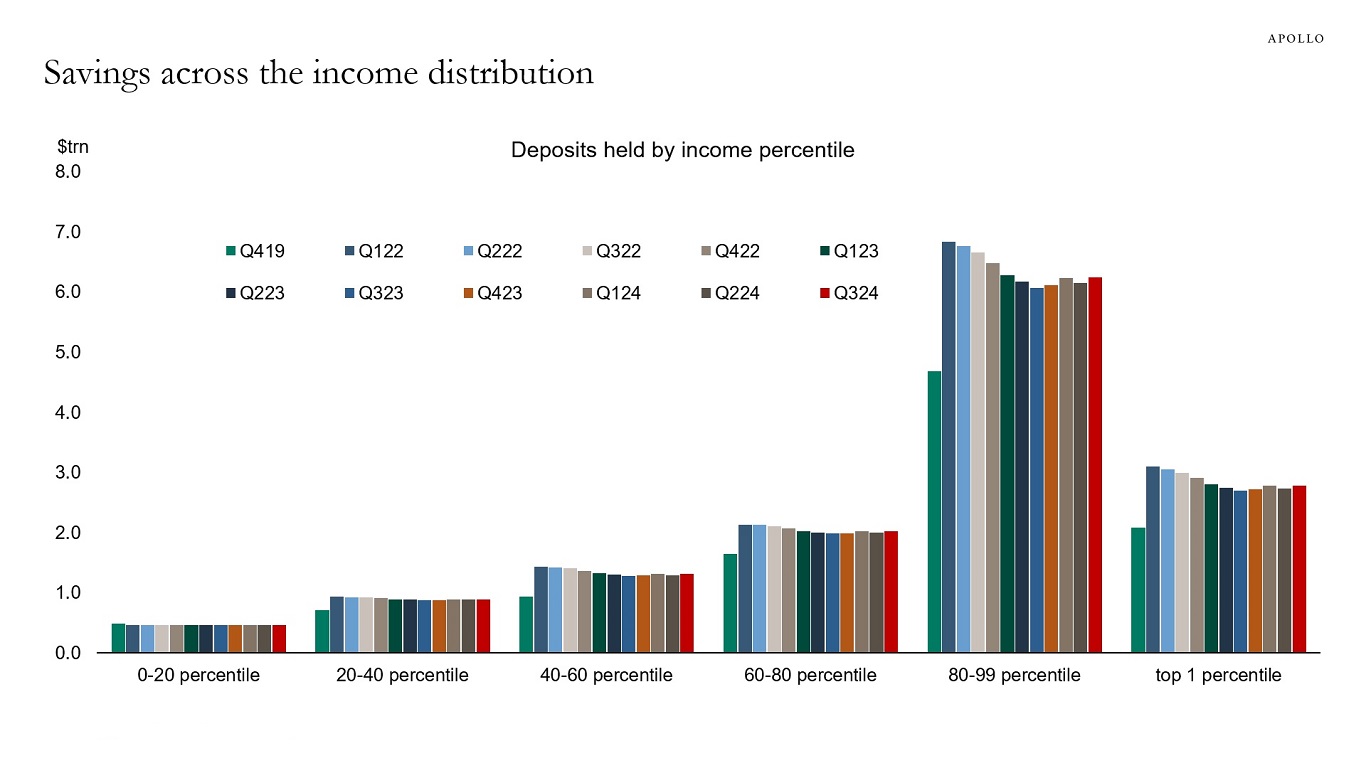
– HELOC balances are rising, and savings are rising for most households across the income distribution (Charts 8 and 9).

– Debt to disposable income is declining, and US households are in much better shape than households in Canada and Australia (Chart 10).

The bottom line is that incomes are high, stock prices are high, home prices are high, debt levels are low, interest rate sensitivity is low, and banks are more willing to lend to households.

There are significant upside risks to US growth, inflation, and interest rates as we enter 2025.

Consensus revising higher the 2025 outlook for the US consumer
Source: Bloomberg, Apollo Chief Economist
Weekly retail sales strong
Source: Redbook, Haver Analytics, Apollo Chief Economist
Texas retail outlook survey indicates a rebound in sales activity
Note: Data was collected December 17–25, and 271 of the 379 Texas service sector business executives surveyed submitted responses. The Dallas Fed conducts the Texas Service Sector Outlook Survey monthly to obtain a timely assessment of the state’s service sector activity. Firms are asked whether revenue, employment, prices, general business activity and other indicators increased, decreased or remained unchanged over the previous month. Source: Federal Reserve Bank of Dallas, Haver Analytics, Apollo Chief Economist
Credit card debt as a share of disposable income very low
Source: FRB, BEA, Haver Analytics, Apollo Chief Economist
Effective outstanding mortgage rate is 4%
Note: The effective interest rate (%) reflects the amortization of initial fees and charges over a 10-year period, which is the historical assumption of the average life of a mortgage loan. Source: Freddie Mac, BEA, Bloomberg, Apollo Chief Economist
The share of households reporting it is harder to obtain credit than one year ago
Note: Harder = much harder + somewhat harder. Source: FRBNY, Haver Analytics, Apollo Chief Economist
Banks more willing to lend to consumers
Source: FRB, Bloomberg, Apollo Chief Economist
Home equity lines of credit (HELOC) balances have increased
Source: New York Fed Consumer Credit Panel/ Equifax, Apollo Chief Economist
Savings across the income distribution
Source: FRB, Haver Analytics, Apollo Chief Economist
US household balance sheets are in excellent shape
Source: Statistics Canada, Reserve Bank of Australia, Bloomberg, Apollo Chief Economist

Download high-res charts

Recent Posts

  • Strong Technical Demand for Credit
  • Fiscal Situation in Germany vs. Spain
  • Hedge Fund Leverage Rising Rapidly
  • The Financing Gap in Sports: Unlocking a $2.5 Trillion Opportunity
  • The US Retirement Crisis

Recent Comments

No comments to show.

Archives

  • December 2025
  • November 2025
  • October 2025
  • September 2025
  • August 2025
  • July 2025
  • June 2025
  • May 2025
  • April 2025
  • March 2025
  • February 2025
  • January 2025
  • December 2024
  • November 2024
  • October 2024
  • September 2024
  • August 2024
  • July 2024
  • June 2024
  • May 2024
  • April 2024
  • March 2024
  • February 2024
  • January 2024
  • December 2023
  • November 2023
  • October 2023
  • September 2023
  • August 2023
  • July 2023
  • June 2023
  • May 2023
  • April 2023
  • March 2023
  • February 2023
  • January 2023
  • December 2022
  • November 2022
  • October 2022
  • September 2022
  • August 2022
  • July 2022
  • June 2022
  • May 2022
  • April 2022
  • March 2022
  • February 2022
  • January 2022
  • December 2021
  • November 2021

Categories

  • Apollo Answers
  • Course Introductions
  • Economic Intelligence
  • Hide from Wordpress Search
  • Investment Knowledge
  • Perspectives
  • Redirecting
  • The Daily Spark
  • The View from Apollo
  • The Weekly Brief
  • Uncategorized
  • White Papers

Posts navigation

←Previous page Page 1 Page 2 Page 3 Page 4 Next page→
  • Privacy Notice
  • Terms of Use
  • Forward-Looking Statements
Apollo
© Apollo Global Management, Inc. All Rights Reserved.

The Apollo Academy is for informational and educational purposes only and nothing contained herein should be taken as investment advice or a recommendation to enter into any transaction. They are not an invitation by or on behalf of Apollo to any person to buy or sell any security or to adopt any investment strategy, and shall not form the basis of, nor may it accompany nor form part of, any right or contract to buy or sell any security or to adopt any investment strategy. There is no guarantee that the views and opinions expressed in this website will come to pass. For additional information, please see the disclaimers included in each piece of content or the legal page of our website here.