• Apollo.com
  • Login
  • Register Now
light site-logo
  • The Academy
  • Upcoming Events
        • Upcoming Events

        • 2026 OutlookTuesday, December 16, 2025 • 11:00am ET
  • Learning Center
        • New & UpdatedAlternative Investing Course 2.0

        • Alternative Investing Essentials Part OnePrivate Equity, Venture Capital, Private Credit
        • Alternative Investing Essentials Part TwoReal Estate, Infrastructure, Digital Assets, Hedge Funds
        • Practical ConsiderationsAsset Allocation, Risk Considerations, Fund Structures, Fees
        • Introductory Videos

          View All Videos

        •  Recent Classes & Videos

        • • Private Equity’s Edge: Delivering Alpha in a Changing Market
        • • Powering Innovation: Infrastructure Investing Across the AI Value Chain
        • • Mid-Year Outlook: At the Crossroads of Stagflation — What’s Next?
        • • Hybrid Investments: Flexible Structures for Volatile Times
        • • Private Credit Investing in Volatile Times
        • • Potential Implications of the Latest US Administration Policy Proposals
        • View All Classes

  • Alternative Perspectives
        • Investment Knowledge
        • The View from Apollo
          • Investment Knowledge

            Hybrid in Action: Delivering Bespoke Capital Solutions in a New Market Paradigm

            December 4, 2025
          • The View From Apollo

            Private Equity: Alpha in an Evolving Market

            November 24, 2025
          • Apollo Answers Investment Knowledge

            Apollo Answers: What’s Missing in Private Credit? Integrating Asset-Backed Finance

            October 27, 2025
  • The Daily Spark
        • Read The Daily Spark Blog


        • Want it delivered daily to your inbox?
          • The Daily Spark

            The Duration Mismatch in the Banking Sector Is a Risk to Financial Stability

            December 6, 2025
          • The Daily Spark

            Default Rates Are Falling

            December 5, 2025
          • The Daily Spark

            Top 5 Risks in 2026

            December 4, 2025
  • Register for Apollo Academy: Alternative Investing Course
  • Login
  • About Apollo Academy
  • Upcoming Events
  • Learning Center
  • Alternative Perspectives
  • The Daily Spark
  • Register for Apollo Academy: Alternative Investing Course
  • Login
  • 2026 Outlook
  • Alternative Investing Course 2.0
  • Private Equity’s Edge: Delivering Alpha in a Changing Market
  • Powering Innovation: Infrastructure Investing Across the AI Value Chain
  • Mid-Year Outlook: At the Crossroads of Stagflation — What’s Next?
  • Hybrid Investments: Flexible Structures for Volatile Times
  • Private Credit Investing in Volatile Times
  • Potential Implications of the Latest US Administration Policy Proposals
  • View All Classes
  • Introductory Videos
  • Alternative Investing Essentials Part One • Now Available On Demand
  • Alternative Investing Essentials Part Two • Now Available On Demand
  • Practical Considerations • Now Available On Demand
  • Investment Knowledge
  • The View from Apollo
Home February 2025

The Growing Number of Retirees

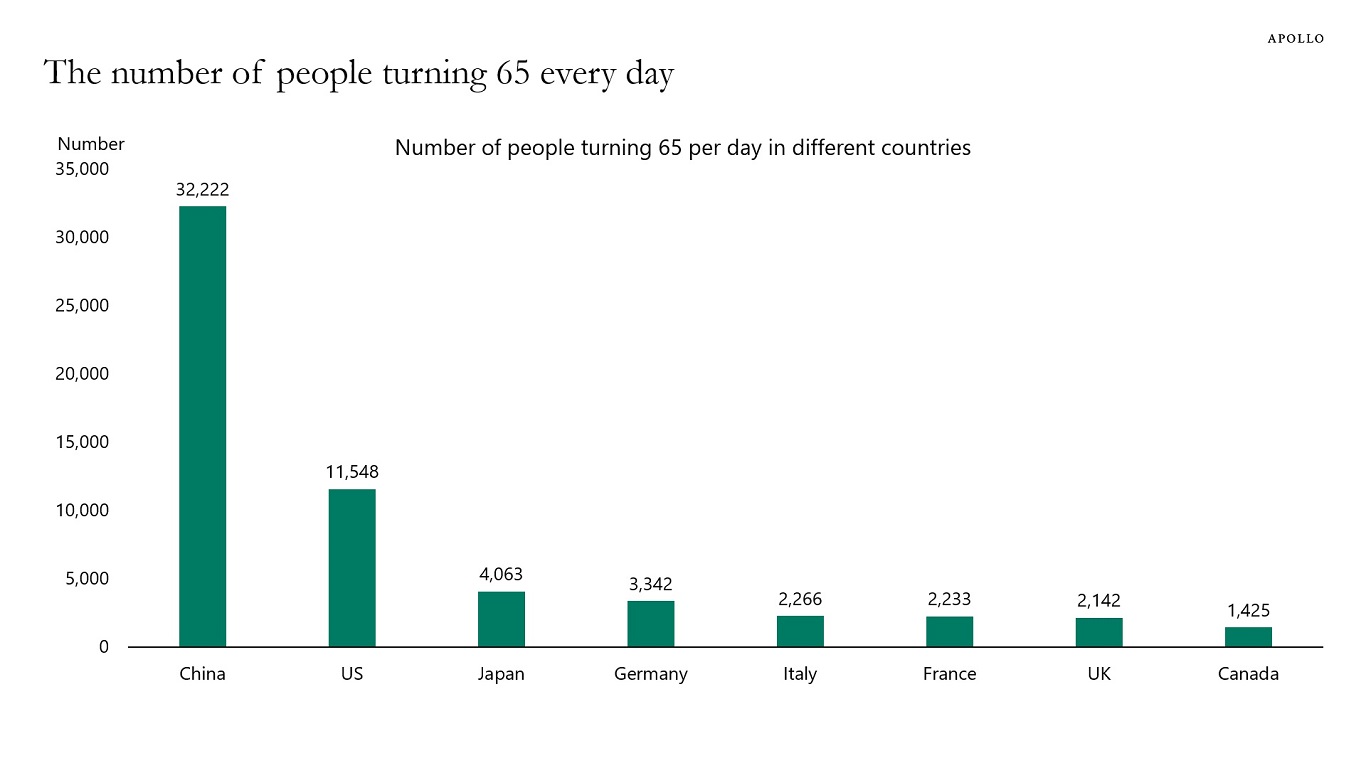
There are 11,500 people who turn 65 years old every day in the US.

In China, it is 32,000; in Japan, it is 4,000; and in Germany, it is 3,300—see the chart below.

The bottom line is that the number of retirees globally is growing rapidly, and there is a need to provide retirement savings for all of them.

The number of people turning 65 every day
Source: UN Population Statistics, Haver Analytics, Apollo Chief Economist

Download high-res chart

Recent Posts

  • The Duration Mismatch in the Banking Sector Is a Risk to Financial Stability
  • Default Rates Are Falling
  • Hybrid in Action: Delivering Bespoke Capital Solutions in a New Market Paradigm
  • Top 5 Risks in 2026
  • Swaption Volatility Remains Remarkably Low Despite Ongoing Fed Debate

Recent Comments

No comments to show.

Archives

  • December 2025
  • November 2025
  • October 2025
  • September 2025
  • August 2025
  • July 2025
  • June 2025
  • May 2025
  • April 2025
  • March 2025
  • February 2025
  • January 2025
  • December 2024
  • November 2024
  • October 2024
  • September 2024
  • August 2024
  • July 2024
  • June 2024
  • May 2024
  • April 2024
  • March 2024
  • February 2024
  • January 2024
  • December 2023
  • November 2023
  • October 2023
  • September 2023
  • August 2023
  • July 2023
  • June 2023
  • May 2023
  • April 2023
  • March 2023
  • February 2023
  • January 2023
  • December 2022
  • November 2022
  • October 2022
  • September 2022
  • August 2022
  • July 2022
  • June 2022
  • May 2022
  • April 2022
  • March 2022
  • February 2022
  • January 2022
  • December 2021
  • November 2021

Categories

  • Apollo Answers
  • Course Introductions
  • Economic Intelligence
  • Hide from Wordpress Search
  • Investment Knowledge
  • Perspectives
  • Redirecting
  • The Daily Spark
  • The View from Apollo
  • The Weekly Brief
  • Uncategorized
  • White Papers

Growth Is Accelerating

Corporate capex spending plans are moving higher after the election, see chart below. This points to upside risks to growth and hiring.

Our chart book with high frequency indicators for the US economy is available here.

Corporate capex spending plans
Source: Business Roundtable, NFIB, Federal Reserve Bank of Philadelphia, Dallas, New York, Kansas and Richmond; Apollo Chief Economist
Weekly data for same-store retail sales
Source: Redbook, Haver Analytics, Apollo Chief Economist

Download high-res chart book

Recent Posts

  • The Duration Mismatch in the Banking Sector Is a Risk to Financial Stability
  • Default Rates Are Falling
  • Hybrid in Action: Delivering Bespoke Capital Solutions in a New Market Paradigm
  • Top 5 Risks in 2026
  • Swaption Volatility Remains Remarkably Low Despite Ongoing Fed Debate

Recent Comments

No comments to show.

Archives

  • December 2025
  • November 2025
  • October 2025
  • September 2025
  • August 2025
  • July 2025
  • June 2025
  • May 2025
  • April 2025
  • March 2025
  • February 2025
  • January 2025
  • December 2024
  • November 2024
  • October 2024
  • September 2024
  • August 2024
  • July 2024
  • June 2024
  • May 2024
  • April 2024
  • March 2024
  • February 2024
  • January 2024
  • December 2023
  • November 2023
  • October 2023
  • September 2023
  • August 2023
  • July 2023
  • June 2023
  • May 2023
  • April 2023
  • March 2023
  • February 2023
  • January 2023
  • December 2022
  • November 2022
  • October 2022
  • September 2022
  • August 2022
  • July 2022
  • June 2022
  • May 2022
  • April 2022
  • March 2022
  • February 2022
  • January 2022
  • December 2021
  • November 2021

Categories

  • Apollo Answers
  • Course Introductions
  • Economic Intelligence
  • Hide from Wordpress Search
  • Investment Knowledge
  • Perspectives
  • Redirecting
  • The Daily Spark
  • The View from Apollo
  • The Weekly Brief
  • Uncategorized
  • White Papers

Months from Final Rate Cut to First Rate Hike

The last Fed cut was in December, and the number of months from the final Fed cut to the first Fed hike has historically been as low as seven months, implying that the Fed could hike rates already in June, see chart below.

Months from final Fed cut to first Fed hike
Source: Federal Reserve, Haver Analytics, Apollo Chief Economist

Download high-res chart

Recent Posts

  • The Duration Mismatch in the Banking Sector Is a Risk to Financial Stability
  • Default Rates Are Falling
  • Hybrid in Action: Delivering Bespoke Capital Solutions in a New Market Paradigm
  • Top 5 Risks in 2026
  • Swaption Volatility Remains Remarkably Low Despite Ongoing Fed Debate

Recent Comments

No comments to show.

Archives

  • December 2025
  • November 2025
  • October 2025
  • September 2025
  • August 2025
  • July 2025
  • June 2025
  • May 2025
  • April 2025
  • March 2025
  • February 2025
  • January 2025
  • December 2024
  • November 2024
  • October 2024
  • September 2024
  • August 2024
  • July 2024
  • June 2024
  • May 2024
  • April 2024
  • March 2024
  • February 2024
  • January 2024
  • December 2023
  • November 2023
  • October 2023
  • September 2023
  • August 2023
  • July 2023
  • June 2023
  • May 2023
  • April 2023
  • March 2023
  • February 2023
  • January 2023
  • December 2022
  • November 2022
  • October 2022
  • September 2022
  • August 2022
  • July 2022
  • June 2022
  • May 2022
  • April 2022
  • March 2022
  • February 2022
  • January 2022
  • December 2021
  • November 2021

Categories

  • Apollo Answers
  • Course Introductions
  • Economic Intelligence
  • Hide from Wordpress Search
  • Investment Knowledge
  • Perspectives
  • Redirecting
  • The Daily Spark
  • The View from Apollo
  • The Weekly Brief
  • Uncategorized
  • White Papers

Investors Spending Too Much Time on the S&P 500

Companies are waiting longer and longer to go public, and some companies never go public, see chart below.

There are 6 million businesses with employment in the US, and the norm for companies is to not be publicly listed in the S&P 500.

Companies are waiting longer to go public
Source: Jay Ritter, IPO Data – Jay R. Ritter, Apollo Chief Economist

Download high-res chart

Recent Posts

  • The Duration Mismatch in the Banking Sector Is a Risk to Financial Stability
  • Default Rates Are Falling
  • Hybrid in Action: Delivering Bespoke Capital Solutions in a New Market Paradigm
  • Top 5 Risks in 2026
  • Swaption Volatility Remains Remarkably Low Despite Ongoing Fed Debate

Recent Comments

No comments to show.

Archives

  • December 2025
  • November 2025
  • October 2025
  • September 2025
  • August 2025
  • July 2025
  • June 2025
  • May 2025
  • April 2025
  • March 2025
  • February 2025
  • January 2025
  • December 2024
  • November 2024
  • October 2024
  • September 2024
  • August 2024
  • July 2024
  • June 2024
  • May 2024
  • April 2024
  • March 2024
  • February 2024
  • January 2024
  • December 2023
  • November 2023
  • October 2023
  • September 2023
  • August 2023
  • July 2023
  • June 2023
  • May 2023
  • April 2023
  • March 2023
  • February 2023
  • January 2023
  • December 2022
  • November 2022
  • October 2022
  • September 2022
  • August 2022
  • July 2022
  • June 2022
  • May 2022
  • April 2022
  • March 2022
  • February 2022
  • January 2022
  • December 2021
  • November 2021

Categories

  • Apollo Answers
  • Course Introductions
  • Economic Intelligence
  • Hide from Wordpress Search
  • Investment Knowledge
  • Perspectives
  • Redirecting
  • The Daily Spark
  • The View from Apollo
  • The Weekly Brief
  • Uncategorized
  • White Papers

Trade War Statistics

We have put together a trade war chart book looking at US trade with China, Canada, and Mexico, which is available here.

We will be using these charts for our conference call at 9 a.m. EST today, you can register here.

In 2000, the US was the main trade partner for most countries in the world
Source: IMF, Haver Analytics, Apollo Chief Economist
In 2020, China was the main trade partner for most countries in the world
Source: IMF, Haver Analytics, Apollo Chief Economist
41% of revenue in S&P 500 companies comes from abroad
Source: Factset, Apollo Chief Economist

Download high-res chart book

Recent Posts

  • The Duration Mismatch in the Banking Sector Is a Risk to Financial Stability
  • Default Rates Are Falling
  • Hybrid in Action: Delivering Bespoke Capital Solutions in a New Market Paradigm
  • Top 5 Risks in 2026
  • Swaption Volatility Remains Remarkably Low Despite Ongoing Fed Debate

Recent Comments

No comments to show.

Archives

  • December 2025
  • November 2025
  • October 2025
  • September 2025
  • August 2025
  • July 2025
  • June 2025
  • May 2025
  • April 2025
  • March 2025
  • February 2025
  • January 2025
  • December 2024
  • November 2024
  • October 2024
  • September 2024
  • August 2024
  • July 2024
  • June 2024
  • May 2024
  • April 2024
  • March 2024
  • February 2024
  • January 2024
  • December 2023
  • November 2023
  • October 2023
  • September 2023
  • August 2023
  • July 2023
  • June 2023
  • May 2023
  • April 2023
  • March 2023
  • February 2023
  • January 2023
  • December 2022
  • November 2022
  • October 2022
  • September 2022
  • August 2022
  • July 2022
  • June 2022
  • May 2022
  • April 2022
  • March 2022
  • February 2022
  • January 2022
  • December 2021
  • November 2021

Categories

  • Apollo Answers
  • Course Introductions
  • Economic Intelligence
  • Hide from Wordpress Search
  • Investment Knowledge
  • Perspectives
  • Redirecting
  • The Daily Spark
  • The View from Apollo
  • The Weekly Brief
  • Uncategorized
  • White Papers

US Imports from China, by Category

The biggest categories of US imports from China are computer and electronic products, electrical equipment and components, and textile and apparels, see chart below.

US imports from China, by category
Source: Census Bureau, Haver Analytics, Apollo Chief Economist

Download high-res chart

Recent Posts

  • The Duration Mismatch in the Banking Sector Is a Risk to Financial Stability
  • Default Rates Are Falling
  • Hybrid in Action: Delivering Bespoke Capital Solutions in a New Market Paradigm
  • Top 5 Risks in 2026
  • Swaption Volatility Remains Remarkably Low Despite Ongoing Fed Debate

Recent Comments

No comments to show.

Archives

  • December 2025
  • November 2025
  • October 2025
  • September 2025
  • August 2025
  • July 2025
  • June 2025
  • May 2025
  • April 2025
  • March 2025
  • February 2025
  • January 2025
  • December 2024
  • November 2024
  • October 2024
  • September 2024
  • August 2024
  • July 2024
  • June 2024
  • May 2024
  • April 2024
  • March 2024
  • February 2024
  • January 2024
  • December 2023
  • November 2023
  • October 2023
  • September 2023
  • August 2023
  • July 2023
  • June 2023
  • May 2023
  • April 2023
  • March 2023
  • February 2023
  • January 2023
  • December 2022
  • November 2022
  • October 2022
  • September 2022
  • August 2022
  • July 2022
  • June 2022
  • May 2022
  • April 2022
  • March 2022
  • February 2022
  • January 2022
  • December 2021
  • November 2021

Categories

  • Apollo Answers
  • Course Introductions
  • Economic Intelligence
  • Hide from Wordpress Search
  • Investment Knowledge
  • Perspectives
  • Redirecting
  • The Daily Spark
  • The View from Apollo
  • The Weekly Brief
  • Uncategorized
  • White Papers

Tariffs on Mexico, Canada, and China Would Have a Significant Impact on the US Economy

Goods imports make up 11% of US GDP, and 43% of US imports come from Canada, Mexico, and China. This means that 5% of US GDP is directly impacted by higher tariffs on Canada, Mexico, and China. This is meaningful when annual GDP growth normally is 2%.

Canada, China and Mexico make up 43% of US imports

Download high-res chart

Recent Posts

  • The Duration Mismatch in the Banking Sector Is a Risk to Financial Stability
  • Default Rates Are Falling
  • Hybrid in Action: Delivering Bespoke Capital Solutions in a New Market Paradigm
  • Top 5 Risks in 2026
  • Swaption Volatility Remains Remarkably Low Despite Ongoing Fed Debate

Recent Comments

No comments to show.

Archives

  • December 2025
  • November 2025
  • October 2025
  • September 2025
  • August 2025
  • July 2025
  • June 2025
  • May 2025
  • April 2025
  • March 2025
  • February 2025
  • January 2025
  • December 2024
  • November 2024
  • October 2024
  • September 2024
  • August 2024
  • July 2024
  • June 2024
  • May 2024
  • April 2024
  • March 2024
  • February 2024
  • January 2024
  • December 2023
  • November 2023
  • October 2023
  • September 2023
  • August 2023
  • July 2023
  • June 2023
  • May 2023
  • April 2023
  • March 2023
  • February 2023
  • January 2023
  • December 2022
  • November 2022
  • October 2022
  • September 2022
  • August 2022
  • July 2022
  • June 2022
  • May 2022
  • April 2022
  • March 2022
  • February 2022
  • January 2022
  • December 2021
  • November 2021

Categories

  • Apollo Answers
  • Course Introductions
  • Economic Intelligence
  • Hide from Wordpress Search
  • Investment Knowledge
  • Perspectives
  • Redirecting
  • The Daily Spark
  • The View from Apollo
  • The Weekly Brief
  • Uncategorized
  • White Papers

Big Difference Between Issuer-Weighted and Dollar-Weighted Default Rates

While headline default rates have ticked up in the last two years, they are primarily driven by distressed exchanges, see the first chart. The increase in dollar-weighted default rates has been less severe—those have, in fact, been trending lower recently—suggesting that a disproportionate number of small companies are facing stress, see the second chart.

The implication is that even as default rates have ticked up, credit losses suffered by high-yield and leveraged-loan investors remain pretty muted. However, with interest rates staying higher for longer, the increase in distressed exchanges could pressure future recoveries if the underlying issuer fundamentals remain stressed.

For more discussion, see our 2025 credit outlook here.

Leveraged loans: Distressed exchanges putting upward pressure on default rates
Source: Shobhit Gupta, PitchBook LCD, Apollo Chief Economist
Big difference between issuer-weighted and dollar-weighted default rates
Source: Shobhit Gupta, Moody’s Analytics, Apollo Chief Economist

Download high-res charts

Recent Posts

  • The Duration Mismatch in the Banking Sector Is a Risk to Financial Stability
  • Default Rates Are Falling
  • Hybrid in Action: Delivering Bespoke Capital Solutions in a New Market Paradigm
  • Top 5 Risks in 2026
  • Swaption Volatility Remains Remarkably Low Despite Ongoing Fed Debate

Recent Comments

No comments to show.

Archives

  • December 2025
  • November 2025
  • October 2025
  • September 2025
  • August 2025
  • July 2025
  • June 2025
  • May 2025
  • April 2025
  • March 2025
  • February 2025
  • January 2025
  • December 2024
  • November 2024
  • October 2024
  • September 2024
  • August 2024
  • July 2024
  • June 2024
  • May 2024
  • April 2024
  • March 2024
  • February 2024
  • January 2024
  • December 2023
  • November 2023
  • October 2023
  • September 2023
  • August 2023
  • July 2023
  • June 2023
  • May 2023
  • April 2023
  • March 2023
  • February 2023
  • January 2023
  • December 2022
  • November 2022
  • October 2022
  • September 2022
  • August 2022
  • July 2022
  • June 2022
  • May 2022
  • April 2022
  • March 2022
  • February 2022
  • January 2022
  • December 2021
  • November 2021

Categories

  • Apollo Answers
  • Course Introductions
  • Economic Intelligence
  • Hide from Wordpress Search
  • Investment Knowledge
  • Perspectives
  • Redirecting
  • The Daily Spark
  • The View from Apollo
  • The Weekly Brief
  • Uncategorized
  • White Papers

Fewer Unicorns Founded When Interest Rates Are Higher for Longer

The chart below shows that when interest rates are low, more unicorns are created because it is cheaper for startups to access capital, allowing them to scale faster and reach a billion-dollar valuation.

When interest rates are higher for longer, fewer unicorns are created because financing costs are more expensive, and it becomes more difficult for companies to expand.

This is not surprising. In fact, this is the entire idea from the Fed with raising interest rates: to make borrowing more expensive and slow economic activity.

The bottom line is that venture capital is unattractive in a higher-for-longer environment because startup firms are characterized by having no earnings, no revenues, and no cash flows, and, therefore, less ability to pay the debt-servicing costs that are associated with expanding the business.

In short, companies with low interest coverage ratios struggle when interest rates are higher for longer.

Venture capital is unattractive in a higher-for-longer rate environment
Source: Ilya Strebulaev, Venture Capital Initiative, Stanford Graduate School of Business, Apollo Chief Economist

Download high-res chart

Recent Posts

  • The Duration Mismatch in the Banking Sector Is a Risk to Financial Stability
  • Default Rates Are Falling
  • Hybrid in Action: Delivering Bespoke Capital Solutions in a New Market Paradigm
  • Top 5 Risks in 2026
  • Swaption Volatility Remains Remarkably Low Despite Ongoing Fed Debate

Recent Comments

No comments to show.

Archives

  • December 2025
  • November 2025
  • October 2025
  • September 2025
  • August 2025
  • July 2025
  • June 2025
  • May 2025
  • April 2025
  • March 2025
  • February 2025
  • January 2025
  • December 2024
  • November 2024
  • October 2024
  • September 2024
  • August 2024
  • July 2024
  • June 2024
  • May 2024
  • April 2024
  • March 2024
  • February 2024
  • January 2024
  • December 2023
  • November 2023
  • October 2023
  • September 2023
  • August 2023
  • July 2023
  • June 2023
  • May 2023
  • April 2023
  • March 2023
  • February 2023
  • January 2023
  • December 2022
  • November 2022
  • October 2022
  • September 2022
  • August 2022
  • July 2022
  • June 2022
  • May 2022
  • April 2022
  • March 2022
  • February 2022
  • January 2022
  • December 2021
  • November 2021

Categories

  • Apollo Answers
  • Course Introductions
  • Economic Intelligence
  • Hide from Wordpress Search
  • Investment Knowledge
  • Perspectives
  • Redirecting
  • The Daily Spark
  • The View from Apollo
  • The Weekly Brief
  • Uncategorized
  • White Papers

Posts navigation

←Previous page Page 1 Page 2 Page 3
  • Privacy Notice
  • Terms of Use
  • Forward-Looking Statements
Apollo
© Apollo Global Management, Inc. All Rights Reserved.

The Apollo Academy is for informational and educational purposes only and nothing contained herein should be taken as investment advice or a recommendation to enter into any transaction. They are not an invitation by or on behalf of Apollo to any person to buy or sell any security or to adopt any investment strategy, and shall not form the basis of, nor may it accompany nor form part of, any right or contract to buy or sell any security or to adopt any investment strategy. There is no guarantee that the views and opinions expressed in this website will come to pass. For additional information, please see the disclaimers included in each piece of content or the legal page of our website here.