• Apollo.com
  • Login
  • Register Now
light site-logo
  • The Academy
  • Upcoming Events
        • Upcoming Events

        • 2026 OutlookTuesday, December 16, 2025 • 11:00am ET
  • Learning Center
        • New & UpdatedAlternative Investing Course 2.0

        • Alternative Investing Essentials Part OnePrivate Equity, Venture Capital, Private Credit
        • Alternative Investing Essentials Part TwoReal Estate, Infrastructure, Digital Assets, Hedge Funds
        • Practical ConsiderationsAsset Allocation, Risk Considerations, Fund Structures, Fees
        • Introductory Videos

          View All Videos

        •  Recent Classes & Videos

        • • Private Equity’s Edge: Delivering Alpha in a Changing Market
        • • Powering Innovation: Infrastructure Investing Across the AI Value Chain
        • • Mid-Year Outlook: At the Crossroads of Stagflation — What’s Next?
        • • Hybrid Investments: Flexible Structures for Volatile Times
        • • Private Credit Investing in Volatile Times
        • • Potential Implications of the Latest US Administration Policy Proposals
        • View All Classes

  • Alternative Perspectives
        • Investment Knowledge
        • The View from Apollo
          • Investment Knowledge

            Hybrid in Action: Delivering Bespoke Capital Solutions in a New Market Paradigm

            December 4, 2025
          • The View From Apollo

            Private Equity: Alpha in an Evolving Market

            November 24, 2025
          • Apollo Answers Investment Knowledge

            Apollo Answers: What’s Missing in Private Credit? Integrating Asset-Backed Finance

            October 27, 2025
  • The Daily Spark
        • Read The Daily Spark Blog


        • Want it delivered daily to your inbox?
          • The Daily Spark

            The Duration Mismatch in the Banking Sector Is a Risk to Financial Stability

            December 6, 2025
          • The Daily Spark

            Default Rates Are Falling

            December 5, 2025
          • The Daily Spark

            Top 5 Risks in 2026

            December 4, 2025
  • Register for Apollo Academy: Alternative Investing Course
  • Login
  • About Apollo Academy
  • Upcoming Events
  • Learning Center
  • Alternative Perspectives
  • The Daily Spark
  • Register for Apollo Academy: Alternative Investing Course
  • Login
  • 2026 Outlook
  • Alternative Investing Course 2.0
  • Private Equity’s Edge: Delivering Alpha in a Changing Market
  • Powering Innovation: Infrastructure Investing Across the AI Value Chain
  • Mid-Year Outlook: At the Crossroads of Stagflation — What’s Next?
  • Hybrid Investments: Flexible Structures for Volatile Times
  • Private Credit Investing in Volatile Times
  • Potential Implications of the Latest US Administration Policy Proposals
  • View All Classes
  • Introductory Videos
  • Alternative Investing Essentials Part One • Now Available On Demand
  • Alternative Investing Essentials Part Two • Now Available On Demand
  • Practical Considerations • Now Available On Demand
  • Investment Knowledge
  • The View from Apollo
Home April 2025

Trade Negotiations Take Time

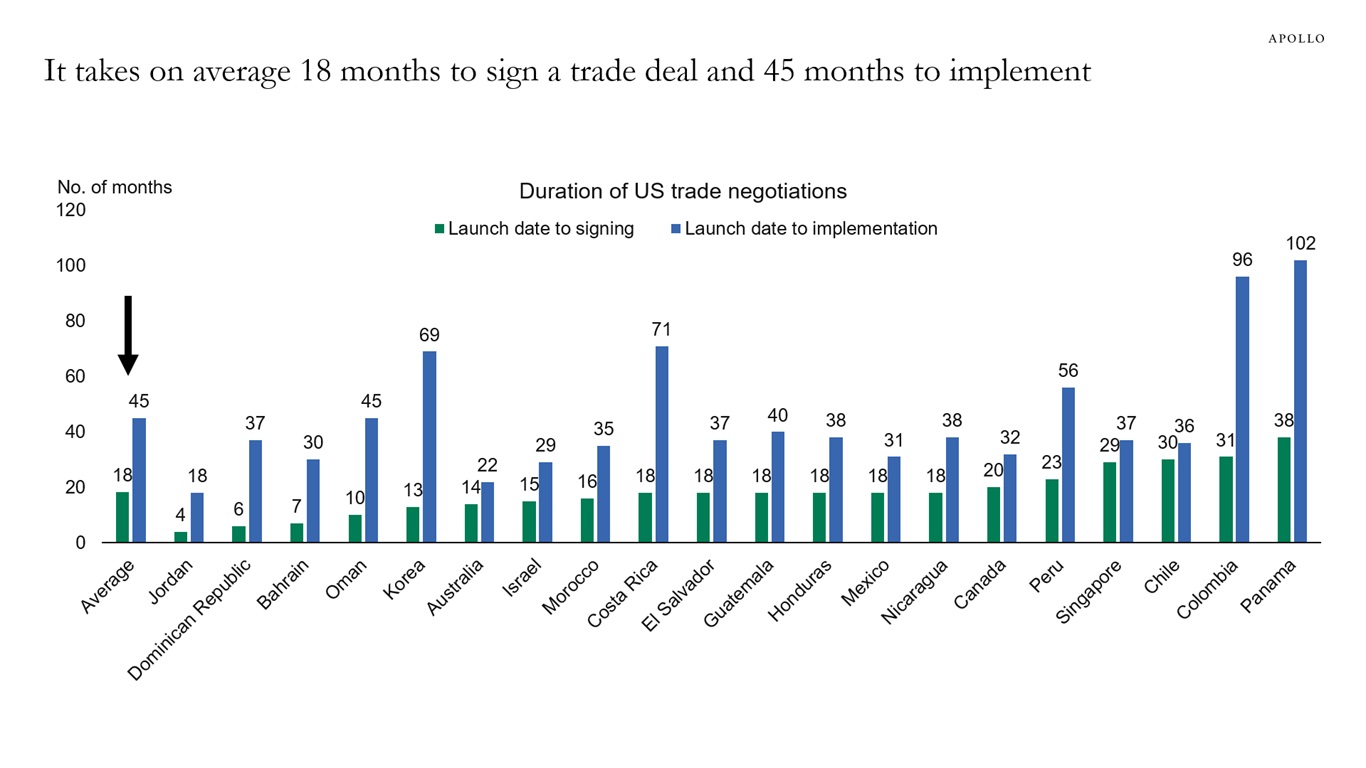
It normally takes 18 months on average for the US to negotiate a trade deal, see chart below.

Why does it take so long? Because trade negotiations involve going through what is imported into each country line by line and then negotiating the tariff for each product category (t-shirts, pencils, cars, pharmaceuticals, lawnmowers, services, etc.). The negotiations also involve discussions about non-tariff barriers, tax differences, rules of origin discussions, IP rights, labor standards, environmental standards, anti-dumping, dispute resolution, digital trade and e-commerce, government procurement, and sometimes security and defense considerations.

The bottom line is that trade negotiations take time because they are complex.

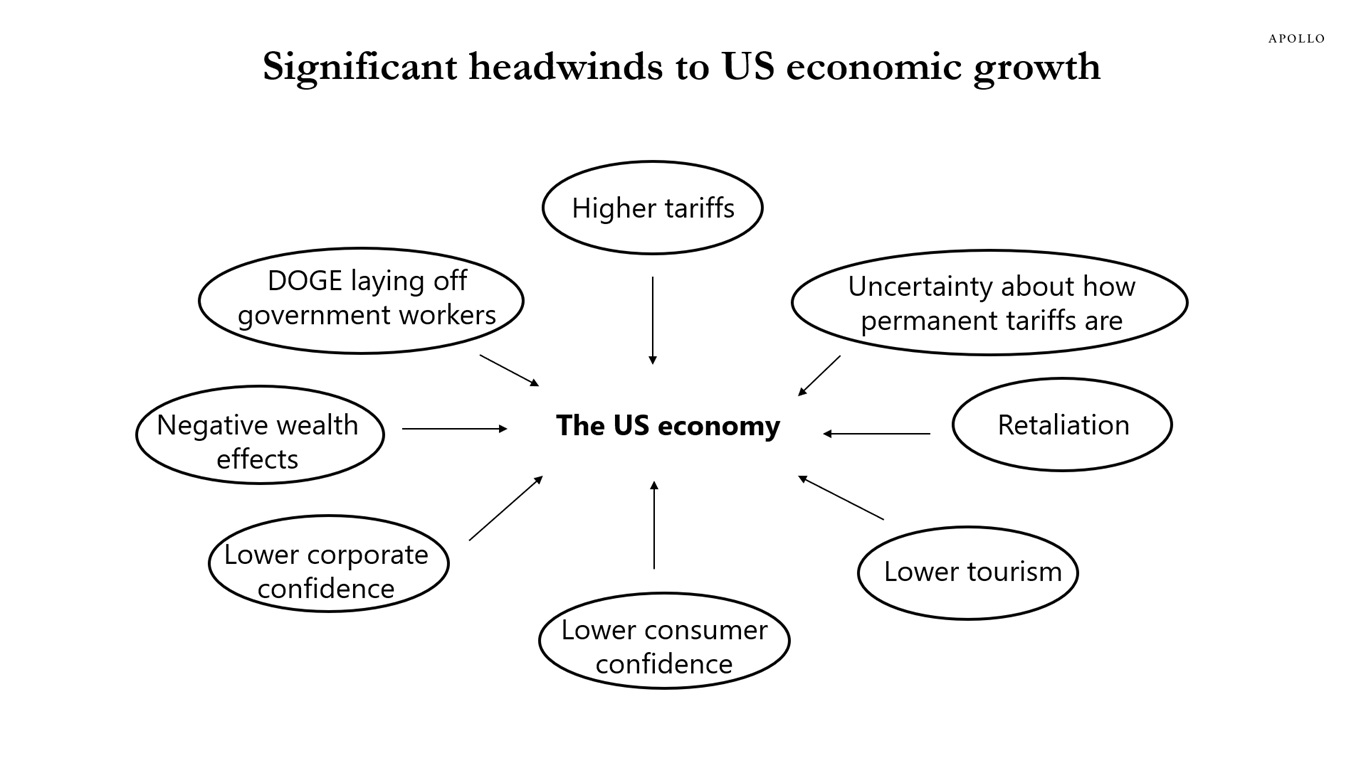
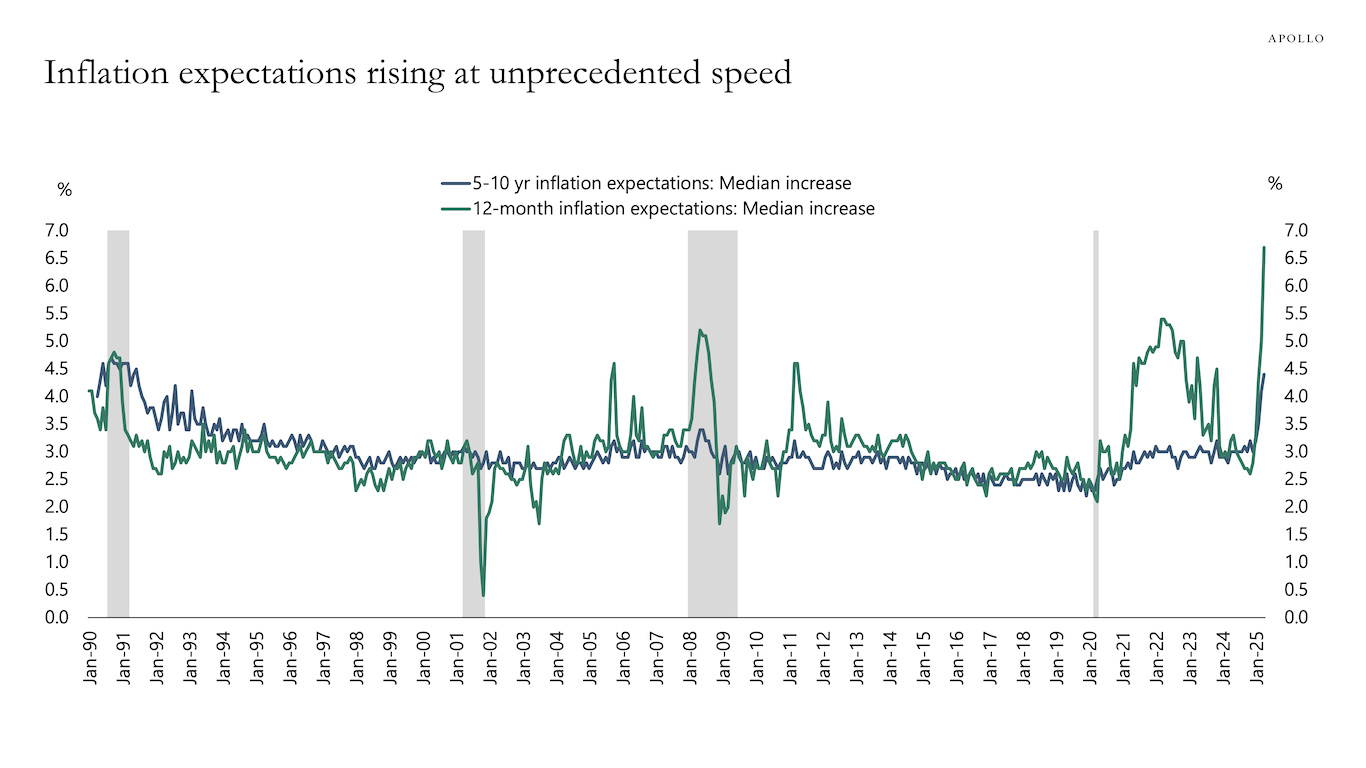
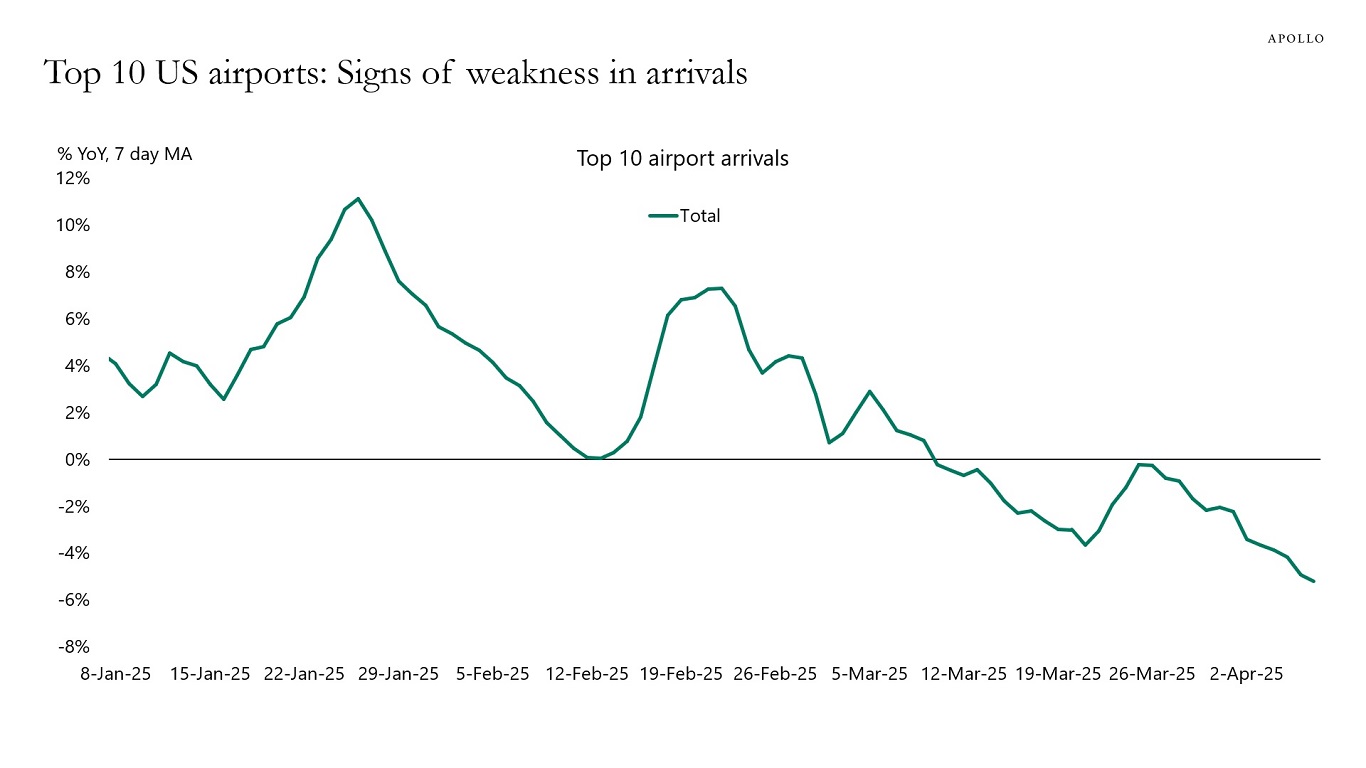
While markets wait for trade negotiations with 90 countries at the same time, global trade is grinding to a standstill with problems similar to what we saw during Covid: growing supply chain challenges with potential shortages in US stores within a few weeks, higher US inflation, and lower tourism to the US. We reiterate our view that if current policies do not change, then the probability of a US recession in 2025 is 90%, see also our discussion in the Daily Spark yesterday.

It takes on average 18 months to sign a trade deal and 45 months to implement
Sources: PIIE (Freund and McDaniel), Apollo Chief Economist

Download high-res chart

Recent Posts

  • The Duration Mismatch in the Banking Sector Is a Risk to Financial Stability
  • Default Rates Are Falling
  • Hybrid in Action: Delivering Bespoke Capital Solutions in a New Market Paradigm
  • Top 5 Risks in 2026
  • Swaption Volatility Remains Remarkably Low Despite Ongoing Fed Debate

Recent Comments

No comments to show.

Archives

  • December 2025
  • November 2025
  • October 2025
  • September 2025
  • August 2025
  • July 2025
  • June 2025
  • May 2025
  • April 2025
  • March 2025
  • February 2025
  • January 2025
  • December 2024
  • November 2024
  • October 2024
  • September 2024
  • August 2024
  • July 2024
  • June 2024
  • May 2024
  • April 2024
  • March 2024
  • February 2024
  • January 2024
  • December 2023
  • November 2023
  • October 2023
  • September 2023
  • August 2023
  • July 2023
  • June 2023
  • May 2023
  • April 2023
  • March 2023
  • February 2023
  • January 2023
  • December 2022
  • November 2022
  • October 2022
  • September 2022
  • August 2022
  • July 2022
  • June 2022
  • May 2022
  • April 2022
  • March 2022
  • February 2022
  • January 2022
  • December 2021
  • November 2021

Categories

  • Apollo Answers
  • Course Introductions
  • Economic Intelligence
  • Hide from Wordpress Search
  • Investment Knowledge
  • Perspectives
  • Redirecting
  • The Daily Spark
  • The View from Apollo
  • The Weekly Brief
  • Uncategorized
  • White Papers

Probability of VTRR 90%

The US economy has been the envy of the world for decades—the biggest economy in the world with strong economic performance and open access for the rest of the world to consumers, investments, and capital markets.

The US is also the freest trading market in the world (2nd freest considering just financial friction/1st considering financial and non-financial barriers), and the administration is not wrong to want to adjust the terms of trade to position the US fairly and to insist on a level playing field for US consumers.

However, tariffs have been implemented in a way that has not been effective, and there is now a 90% chance of what can be called a Voluntary Trade Reset Recession (“VTRR”), see the first chart below.

The administration inherited an economy with strong growth, 4% unemployment, positive hiring, and a substantial tailwind from investments. US and international investors are building infrastructure, next-generation factories, and data centers. The Inflation Reduction Act increased capex, and the US was poised for a substantial increase due to energy supply additions, increased defense production, and deregulation.

But implementing extremely high tariffs overnight hurts many businesses; particularly small businesses because the tariff must be paid by the business when the imported goods arrive in the US. Small businesses that have for decades relied on a stable US system will have to adjust immediately and do not have the working capital to pay tariffs. Expect ships to sit offshore, orders to be canceled, and well-run generational retailers to file for bankruptcy.

To make exceptions for large businesses that have the flexibility and resources to handle unforeseen expenses but not small businesses does not make sense. The challenges for small- and medium-sized enterprises are now a macro problem for the US economy, where small businesses account for more than 80% of US employment and capex, see the second and third chart below.

One way to quantify the coming negative impact on GDP is to compare the current tariff increase with the tariff increase observed during the trade war in 2018. During the 2018 trade war with China, the US average tariff rate increased from 2% to 3%, and studies show (here and here) that the impact on GDP was between 0.25% and 0.7%. Using the smallest of these estimates for the current tariff increase from 3% to 18% shows that the negative impact on GDP in 2025 could be almost 4 percentage points, not including additional non-linear effects because of the current increase in uncertainty for consumer spending decisions and business planning.

What can be done to avoid a recession? It is not too late to modify the course. For Mexico and Canada, there is a unique opportunity for the US to move first and get an agreement where labor, capital, and natural resources can be efficiently used in the North American economy. For any country that reduces tariffs to zero, the 10% tariff could stay in place, giving 180 days to negotiate non-tariff barriers, at which time, if agreed, the 10% is removed. For China, one approach could be to keep tariffs in place on autos, solar, and other strategic product groups. For all other products from China, tariffs can be gradually phased in over a period of, say, 18 or 24 months.

The bottom line: If the current level of tariffs continues, a sharp slowdown in the US economy is coming.

Significant headwinds to US economic growth
Source: Apollo Chief Economist
Small businesses account for 85% of total capex in the US economy
Sources: S&P, BEA, Haver Analytics, Apollo Chief Economist
Total employment in firms with less than 500 workers: 110 million
Sources: ADP, Haver Analytics, Apollo Chief Economist

Download high-res charts

Recent Posts

  • The Duration Mismatch in the Banking Sector Is a Risk to Financial Stability
  • Default Rates Are Falling
  • Hybrid in Action: Delivering Bespoke Capital Solutions in a New Market Paradigm
  • Top 5 Risks in 2026
  • Swaption Volatility Remains Remarkably Low Despite Ongoing Fed Debate

Recent Comments

No comments to show.

Archives

  • December 2025
  • November 2025
  • October 2025
  • September 2025
  • August 2025
  • July 2025
  • June 2025
  • May 2025
  • April 2025
  • March 2025
  • February 2025
  • January 2025
  • December 2024
  • November 2024
  • October 2024
  • September 2024
  • August 2024
  • July 2024
  • June 2024
  • May 2024
  • April 2024
  • March 2024
  • February 2024
  • January 2024
  • December 2023
  • November 2023
  • October 2023
  • September 2023
  • August 2023
  • July 2023
  • June 2023
  • May 2023
  • April 2023
  • March 2023
  • February 2023
  • January 2023
  • December 2022
  • November 2022
  • October 2022
  • September 2022
  • August 2022
  • July 2022
  • June 2022
  • May 2022
  • April 2022
  • March 2022
  • February 2022
  • January 2022
  • December 2021
  • November 2021

Categories

  • Apollo Answers
  • Course Introductions
  • Economic Intelligence
  • Hide from Wordpress Search
  • Investment Knowledge
  • Perspectives
  • Redirecting
  • The Daily Spark
  • The View from Apollo
  • The Weekly Brief
  • Uncategorized
  • White Papers

US Makes Up Only 14% of Chinese Exports

The share of Chinese exports going to the US has declined from 20% to 14% since 2017, see chart below.

With China’s market share in the US declining, the economies that have gained market share in the US include Vietnam, Taiwan, Mexico, India, and South Korea, and studies show (see here and here) that about two percentage points of the rise in the market share of other regions is because of an increase in China’s share of their goods imports.

In other words, some exports from China to the US may be rerouted elsewhere or used as input in production in other areas.

The bottom line is that more than 80% of exports from China end up in other places than the US.

It should also be noted that de minimis exports from China to the US (direct shipments to US consumers with a value less than $800) are around $20 billion, much less than the $500 billion in total goods exports from China to the US seen in the chart below.

Share of Chinese exports to the US is 14%
Sources: General Administration of Customs, China; Haver Analytics; Apollo Chief Economist

Download high-res chart

Recent Posts

  • The Duration Mismatch in the Banking Sector Is a Risk to Financial Stability
  • Default Rates Are Falling
  • Hybrid in Action: Delivering Bespoke Capital Solutions in a New Market Paradigm
  • Top 5 Risks in 2026
  • Swaption Volatility Remains Remarkably Low Despite Ongoing Fed Debate

Recent Comments

No comments to show.

Archives

  • December 2025
  • November 2025
  • October 2025
  • September 2025
  • August 2025
  • July 2025
  • June 2025
  • May 2025
  • April 2025
  • March 2025
  • February 2025
  • January 2025
  • December 2024
  • November 2024
  • October 2024
  • September 2024
  • August 2024
  • July 2024
  • June 2024
  • May 2024
  • April 2024
  • March 2024
  • February 2024
  • January 2024
  • December 2023
  • November 2023
  • October 2023
  • September 2023
  • August 2023
  • July 2023
  • June 2023
  • May 2023
  • April 2023
  • March 2023
  • February 2023
  • January 2023
  • December 2022
  • November 2022
  • October 2022
  • September 2022
  • August 2022
  • July 2022
  • June 2022
  • May 2022
  • April 2022
  • March 2022
  • February 2022
  • January 2022
  • December 2021
  • November 2021

Categories

  • Apollo Answers
  • Course Introductions
  • Economic Intelligence
  • Hide from Wordpress Search
  • Investment Knowledge
  • Perspectives
  • Redirecting
  • The Daily Spark
  • The View from Apollo
  • The Weekly Brief
  • Uncategorized
  • White Papers

Term Premium Rising

The term premium in US Treasuries is rising, see first chart below. The market does not know if this is because of the fiscal situation, inflation expectations becoming unanchored, or discussions about who the next Fed Chair will be.

Some of the move higher in rates has been technical, driven by unwinds of levered basis trades and swap trades.

In addition, the move lower in the dollar is telling us that the move higher in rates is also because of foreigners selling Treasuries.

For example, Japanese investors have in recent weeks been significant sellers of foreign bonds, and this has been associated with a significant appreciation of the yen relative to the dollar. This does not necessarily mean that Japanese investors are questioning American exceptionalism. In fact, in 2022, when the Fed started raising interest rates, Japanese investors were also significant sellers of foreign bonds, see second chart below.

We are hosting a conference call today at 9 am EDT to discuss what is going on in markets and the outlook for the economy, you can register here.

US term premium rising
Note: The NY Fed measure for the term premium is based on a five-factor, no-arbitrage term structure model. Sources: New York Fed, Bloomberg, Apollo Chief Economist
Japanese residents’ net investment in foreign bonds
Sources: Bloomberg, Apollo Chief Economist

Download high-res charts

Recent Posts

  • The Duration Mismatch in the Banking Sector Is a Risk to Financial Stability
  • Default Rates Are Falling
  • Hybrid in Action: Delivering Bespoke Capital Solutions in a New Market Paradigm
  • Top 5 Risks in 2026
  • Swaption Volatility Remains Remarkably Low Despite Ongoing Fed Debate

Recent Comments

No comments to show.

Archives

  • December 2025
  • November 2025
  • October 2025
  • September 2025
  • August 2025
  • July 2025
  • June 2025
  • May 2025
  • April 2025
  • March 2025
  • February 2025
  • January 2025
  • December 2024
  • November 2024
  • October 2024
  • September 2024
  • August 2024
  • July 2024
  • June 2024
  • May 2024
  • April 2024
  • March 2024
  • February 2024
  • January 2024
  • December 2023
  • November 2023
  • October 2023
  • September 2023
  • August 2023
  • July 2023
  • June 2023
  • May 2023
  • April 2023
  • March 2023
  • February 2023
  • January 2023
  • December 2022
  • November 2022
  • October 2022
  • September 2022
  • August 2022
  • July 2022
  • June 2022
  • May 2022
  • April 2022
  • March 2022
  • February 2022
  • January 2022
  • December 2021
  • November 2021

Categories

  • Apollo Answers
  • Course Introductions
  • Economic Intelligence
  • Hide from Wordpress Search
  • Investment Knowledge
  • Perspectives
  • Redirecting
  • The Daily Spark
  • The View from Apollo
  • The Weekly Brief
  • Uncategorized
  • White Papers

Creating a Recession to Lower Long Rates Is Not a Good Idea

If the US enters a recession, long-term interest rates are likely to go down, and it would be cheaper for the US government to refinance existing government debt.

However, the chart below shows that the interest payments saved if interest rates decline by two percentage points would be more than offset by the deterioration in government finances associated with a recession.

Specifically, if interest rates decline by two percentage points, the US government would save around $500 billion in annual interest payments. But if the US enters a recession, the government will have lower tax collections and pay more in unemployment benefits, and the historical deepening of the budget deficit during recessions of around 4% of GDP would correspond to an additional $1.3 trillion erosion of US government finances measured in 2025 dollars.

The bottom line is that it is not possible to improve the budget deficit by creating a recession because during a recession government finances would deteriorate by double the amount saved in interest payments, see chart below.

The negative impact of the budget deficit widening during a recession far outweighs the positive impact of a two-percentage point decline in rates
Note: Assuming a decline in interest rates by two percentage points relative to current CBO assumption resulting in $568 billion interest expense savings on Federal debt. Fiscal deficit rising by 4.4% GDP on average in the past recessions since 1968. Sources: US Treasury, CBO, Bloomberg, Apollo Chief Economist

Download high-res chart

Recent Posts

  • The Duration Mismatch in the Banking Sector Is a Risk to Financial Stability
  • Default Rates Are Falling
  • Hybrid in Action: Delivering Bespoke Capital Solutions in a New Market Paradigm
  • Top 5 Risks in 2026
  • Swaption Volatility Remains Remarkably Low Despite Ongoing Fed Debate

Recent Comments

No comments to show.

Archives

  • December 2025
  • November 2025
  • October 2025
  • September 2025
  • August 2025
  • July 2025
  • June 2025
  • May 2025
  • April 2025
  • March 2025
  • February 2025
  • January 2025
  • December 2024
  • November 2024
  • October 2024
  • September 2024
  • August 2024
  • July 2024
  • June 2024
  • May 2024
  • April 2024
  • March 2024
  • February 2024
  • January 2024
  • December 2023
  • November 2023
  • October 2023
  • September 2023
  • August 2023
  • July 2023
  • June 2023
  • May 2023
  • April 2023
  • March 2023
  • February 2023
  • January 2023
  • December 2022
  • November 2022
  • October 2022
  • September 2022
  • August 2022
  • July 2022
  • June 2022
  • May 2022
  • April 2022
  • March 2022
  • February 2022
  • January 2022
  • December 2021
  • November 2021

Categories

  • Apollo Answers
  • Course Introductions
  • Economic Intelligence
  • Hide from Wordpress Search
  • Investment Knowledge
  • Perspectives
  • Redirecting
  • The Daily Spark
  • The View from Apollo
  • The Weekly Brief
  • Uncategorized
  • White Papers

Bid-Ask Spreads Widening in IG Credit Markets

My colleague Shobhit Gupta has calculated bid-ask spreads for investment grade (IG) bonds based on trader quotes, see chart below.

Liquid securities are defined as $1 billion-plus deals issued in the past year. Off-the-run bonds are those issued more than two years ago with deal sizes less than $900 million, and these bonds make up 50% of the IG market by count.

The chart shows that bid-ask spreads have spiked post the April 2 tariff announcement.

The gap between liquid and illiquid bonds is particularly noteworthy. In 2020, the bid-ask spread widened across the whole market. But this time around, transaction costs have increased materially more for off-the-run paper. This highlights the growing liquidity divide in the public IG market. Liquidity in on-the-run bonds has improved, but off-the-run paper has become virtually untradeable and effectively a buy-and-hold investment.

Bid-Ask spreads widening in IG credit markets
Note: Chart shows estimated bid-ask for IG bonds based on trader quotes. Liquid securities defined as $1 billion-plus deals issued in the past year. Off-the-run bonds are those issued more than two years ago with deal size <$900 million. (These bonds make up 50% of the IG market by count.) Sources: Shobhit Gupta, Apollo Chief Economist

Download high-res chart

Recent Posts

  • The Duration Mismatch in the Banking Sector Is a Risk to Financial Stability
  • Default Rates Are Falling
  • Hybrid in Action: Delivering Bespoke Capital Solutions in a New Market Paradigm
  • Top 5 Risks in 2026
  • Swaption Volatility Remains Remarkably Low Despite Ongoing Fed Debate

Recent Comments

No comments to show.

Archives

  • December 2025
  • November 2025
  • October 2025
  • September 2025
  • August 2025
  • July 2025
  • June 2025
  • May 2025
  • April 2025
  • March 2025
  • February 2025
  • January 2025
  • December 2024
  • November 2024
  • October 2024
  • September 2024
  • August 2024
  • July 2024
  • June 2024
  • May 2024
  • April 2024
  • March 2024
  • February 2024
  • January 2024
  • December 2023
  • November 2023
  • October 2023
  • September 2023
  • August 2023
  • July 2023
  • June 2023
  • May 2023
  • April 2023
  • March 2023
  • February 2023
  • January 2023
  • December 2022
  • November 2022
  • October 2022
  • September 2022
  • August 2022
  • July 2022
  • June 2022
  • May 2022
  • April 2022
  • March 2022
  • February 2022
  • January 2022
  • December 2021
  • November 2021

Categories

  • Apollo Answers
  • Course Introductions
  • Economic Intelligence
  • Hide from Wordpress Search
  • Investment Knowledge
  • Perspectives
  • Redirecting
  • The Daily Spark
  • The View from Apollo
  • The Weekly Brief
  • Uncategorized
  • White Papers

The 60/40 Portfolio Continues to Underperform

The 60/40 portfolio has basically gone nowhere since the beginning of 2022, with only a 2% annual return for the past three and a half years, see chart below.

The 60/40 portfolio is not doing well
Sources: Bloomberg, Apollo Chief Economist

Download high-res chart

Recent Posts

  • The Duration Mismatch in the Banking Sector Is a Risk to Financial Stability
  • Default Rates Are Falling
  • Hybrid in Action: Delivering Bespoke Capital Solutions in a New Market Paradigm
  • Top 5 Risks in 2026
  • Swaption Volatility Remains Remarkably Low Despite Ongoing Fed Debate

Recent Comments

No comments to show.

Archives

  • December 2025
  • November 2025
  • October 2025
  • September 2025
  • August 2025
  • July 2025
  • June 2025
  • May 2025
  • April 2025
  • March 2025
  • February 2025
  • January 2025
  • December 2024
  • November 2024
  • October 2024
  • September 2024
  • August 2024
  • July 2024
  • June 2024
  • May 2024
  • April 2024
  • March 2024
  • February 2024
  • January 2024
  • December 2023
  • November 2023
  • October 2023
  • September 2023
  • August 2023
  • July 2023
  • June 2023
  • May 2023
  • April 2023
  • March 2023
  • February 2023
  • January 2023
  • December 2022
  • November 2022
  • October 2022
  • September 2022
  • August 2022
  • July 2022
  • June 2022
  • May 2022
  • April 2022
  • March 2022
  • February 2022
  • January 2022
  • December 2021
  • November 2021

Categories

  • Apollo Answers
  • Course Introductions
  • Economic Intelligence
  • Hide from Wordpress Search
  • Investment Knowledge
  • Perspectives
  • Redirecting
  • The Daily Spark
  • The View from Apollo
  • The Weekly Brief
  • Uncategorized
  • White Papers

Consumer Confidence Is Weaker than During the 2008 Financial Crisis

The April survey of consumer sentiment from the University of Michigan shows the following:

  • Consumer sentiment is declining rapidly both for households making more than $100,000 and less than $100,000 (see the first chart).
  • Consumers’ worries about losing their jobs are at levels normally seen during recessions (see the second chart).
  • A record-high share of consumers think business conditions are worsening (see the third chart).
  • Households’ income expectations are declining (see the fourth chart).
  • Inflation expectations are rising at an unprecedented speed (see the fifth chart).

The bottom line is that consumer sentiment is very weak, and the fear is that this will spill over to weaker actual spending.

Consumer sentiment declining across income groups
Sources: University of Michigan, Haver Analytics, Apollo Chief Economist
Consumers very worried about losing their jobs
Sources: University of Michigan, Haver Analytics, Apollo Chief Economist
Record-high share of consumers think business conditions are worsening
Sources: University of Michigan, Haver Analytics, Apollo Chief Economist
Significant decline in household income expectations
Sources: University of Michigan, Bloomberg, Apollo Chief Economist
Inflation expectations rising at unprecedented speed
Sources: University of Michigan, Haver Analytics, Apollo Chief Economist

Download high-res charts

Recent Posts

  • The Duration Mismatch in the Banking Sector Is a Risk to Financial Stability
  • Default Rates Are Falling
  • Hybrid in Action: Delivering Bespoke Capital Solutions in a New Market Paradigm
  • Top 5 Risks in 2026
  • Swaption Volatility Remains Remarkably Low Despite Ongoing Fed Debate

Recent Comments

No comments to show.

Archives

  • December 2025
  • November 2025
  • October 2025
  • September 2025
  • August 2025
  • July 2025
  • June 2025
  • May 2025
  • April 2025
  • March 2025
  • February 2025
  • January 2025
  • December 2024
  • November 2024
  • October 2024
  • September 2024
  • August 2024
  • July 2024
  • June 2024
  • May 2024
  • April 2024
  • March 2024
  • February 2024
  • January 2024
  • December 2023
  • November 2023
  • October 2023
  • September 2023
  • August 2023
  • July 2023
  • June 2023
  • May 2023
  • April 2023
  • March 2023
  • February 2023
  • January 2023
  • December 2022
  • November 2022
  • October 2022
  • September 2022
  • August 2022
  • July 2022
  • June 2022
  • May 2022
  • April 2022
  • March 2022
  • February 2022
  • January 2022
  • December 2021
  • November 2021

Categories

  • Apollo Answers
  • Course Introductions
  • Economic Intelligence
  • Hide from Wordpress Search
  • Investment Knowledge
  • Perspectives
  • Redirecting
  • The Daily Spark
  • The View from Apollo
  • The Weekly Brief
  • Uncategorized
  • White Papers

Arrivals at Top 10 US Airports Slowing

Daily data of the number of arrivals at the top 10 airports in the US has shown a rapid decline since late February, see chart below. This is likely a mix of declines in business travel, tourism, and government travel.

Top 10 US airports: Signs of weakness in arrivals
Note: Airports included are ATL, LAX, DFW, MIA, ORD, DEN, IAD, SFO, MCO, and JFK. Sources: CBP, Apollo Chief Economist

Download high-res chart

Recent Posts

  • The Duration Mismatch in the Banking Sector Is a Risk to Financial Stability
  • Default Rates Are Falling
  • Hybrid in Action: Delivering Bespoke Capital Solutions in a New Market Paradigm
  • Top 5 Risks in 2026
  • Swaption Volatility Remains Remarkably Low Despite Ongoing Fed Debate

Recent Comments

No comments to show.

Archives

  • December 2025
  • November 2025
  • October 2025
  • September 2025
  • August 2025
  • July 2025
  • June 2025
  • May 2025
  • April 2025
  • March 2025
  • February 2025
  • January 2025
  • December 2024
  • November 2024
  • October 2024
  • September 2024
  • August 2024
  • July 2024
  • June 2024
  • May 2024
  • April 2024
  • March 2024
  • February 2024
  • January 2024
  • December 2023
  • November 2023
  • October 2023
  • September 2023
  • August 2023
  • July 2023
  • June 2023
  • May 2023
  • April 2023
  • March 2023
  • February 2023
  • January 2023
  • December 2022
  • November 2022
  • October 2022
  • September 2022
  • August 2022
  • July 2022
  • June 2022
  • May 2022
  • April 2022
  • March 2022
  • February 2022
  • January 2022
  • December 2021
  • November 2021

Categories

  • Apollo Answers
  • Course Introductions
  • Economic Intelligence
  • Hide from Wordpress Search
  • Investment Knowledge
  • Perspectives
  • Redirecting
  • The Daily Spark
  • The View from Apollo
  • The Weekly Brief
  • Uncategorized
  • White Papers
The View from Apollo - A New Podcast Series

Credit Investing Amid Post “Liberation Day” Uncertainty

Listen to Apollo Chief Economist Torsten Slok and Robert Bittencourt, Partner and Co-Head of Opportunistic Credit at Apollo, discuss the impact of the Trump administration’s new trade regime on credit markets. In an environment of heightened uncertainty and ongoing trade negotiations, what should be the focus?

Recent Posts

  • The Duration Mismatch in the Banking Sector Is a Risk to Financial Stability
  • Default Rates Are Falling
  • Hybrid in Action: Delivering Bespoke Capital Solutions in a New Market Paradigm
  • Top 5 Risks in 2026
  • Swaption Volatility Remains Remarkably Low Despite Ongoing Fed Debate

Recent Comments

No comments to show.

Archives

  • December 2025
  • November 2025
  • October 2025
  • September 2025
  • August 2025
  • July 2025
  • June 2025
  • May 2025
  • April 2025
  • March 2025
  • February 2025
  • January 2025
  • December 2024
  • November 2024
  • October 2024
  • September 2024
  • August 2024
  • July 2024
  • June 2024
  • May 2024
  • April 2024
  • March 2024
  • February 2024
  • January 2024
  • December 2023
  • November 2023
  • October 2023
  • September 2023
  • August 2023
  • July 2023
  • June 2023
  • May 2023
  • April 2023
  • March 2023
  • February 2023
  • January 2023
  • December 2022
  • November 2022
  • October 2022
  • September 2022
  • August 2022
  • July 2022
  • June 2022
  • May 2022
  • April 2022
  • March 2022
  • February 2022
  • January 2022
  • December 2021
  • November 2021

Categories

  • Apollo Answers
  • Course Introductions
  • Economic Intelligence
  • Hide from Wordpress Search
  • Investment Knowledge
  • Perspectives
  • Redirecting
  • The Daily Spark
  • The View from Apollo
  • The Weekly Brief
  • Uncategorized
  • White Papers

Posts navigation

←Previous page Page 1 Page 2 Page 3 Page 4 Next page→
  • Privacy Notice
  • Terms of Use
  • Forward-Looking Statements
Apollo
© Apollo Global Management, Inc. All Rights Reserved.

The Apollo Academy is for informational and educational purposes only and nothing contained herein should be taken as investment advice or a recommendation to enter into any transaction. They are not an invitation by or on behalf of Apollo to any person to buy or sell any security or to adopt any investment strategy, and shall not form the basis of, nor may it accompany nor form part of, any right or contract to buy or sell any security or to adopt any investment strategy. There is no guarantee that the views and opinions expressed in this website will come to pass. For additional information, please see the disclaimers included in each piece of content or the legal page of our website here.