• Apollo.com
  • Login
  • Register Now
light site-logo
  • The Academy
  • Upcoming Events
        • Upcoming Events

        • 2026 OutlookTuesday, December 16, 2025 • 11:00am ET
  • Learning Center
        • New & UpdatedAlternative Investing Course 2.0

        • Alternative Investing Essentials Part OnePrivate Equity, Venture Capital, Private Credit
        • Alternative Investing Essentials Part TwoReal Estate, Infrastructure, Digital Assets, Hedge Funds
        • Practical ConsiderationsAsset Allocation, Risk Considerations, Fund Structures, Fees
        • Introductory Videos

          View All Videos

        •  Recent Classes & Videos

        • • Private Equity’s Edge: Delivering Alpha in a Changing Market
        • • Powering Innovation: Infrastructure Investing Across the AI Value Chain
        • • Mid-Year Outlook: At the Crossroads of Stagflation — What’s Next?
        • • Hybrid Investments: Flexible Structures for Volatile Times
        • • Private Credit Investing in Volatile Times
        • • Potential Implications of the Latest US Administration Policy Proposals
        • View All Classes

  • Alternative Perspectives
        • Investment Knowledge
        • The View from Apollo
          • Investment Knowledge

            Hybrid in Action: Delivering Bespoke Capital Solutions in a New Market Paradigm

            December 4, 2025
          • The View From Apollo

            Private Equity: Alpha in an Evolving Market

            November 24, 2025
          • Apollo Answers Investment Knowledge

            Apollo Answers: What’s Missing in Private Credit? Integrating Asset-Backed Finance

            October 27, 2025
  • The Daily Spark
        • Read The Daily Spark Blog


        • Want it delivered daily to your inbox?
          • The Daily Spark

            The Duration Mismatch in the Banking Sector Is a Risk to Financial Stability

            December 6, 2025
          • The Daily Spark

            Default Rates Are Falling

            December 5, 2025
          • The Daily Spark

            Top 5 Risks in 2026

            December 4, 2025
  • Register for Apollo Academy: Alternative Investing Course
  • Login
  • About Apollo Academy
  • Upcoming Events
  • Learning Center
  • Alternative Perspectives
  • The Daily Spark
  • Register for Apollo Academy: Alternative Investing Course
  • Login
  • 2026 Outlook
  • Alternative Investing Course 2.0
  • Private Equity’s Edge: Delivering Alpha in a Changing Market
  • Powering Innovation: Infrastructure Investing Across the AI Value Chain
  • Mid-Year Outlook: At the Crossroads of Stagflation — What’s Next?
  • Hybrid Investments: Flexible Structures for Volatile Times
  • Private Credit Investing in Volatile Times
  • Potential Implications of the Latest US Administration Policy Proposals
  • View All Classes
  • Introductory Videos
  • Alternative Investing Essentials Part One • Now Available On Demand
  • Alternative Investing Essentials Part Two • Now Available On Demand
  • Practical Considerations • Now Available On Demand
  • Investment Knowledge
  • The View from Apollo
Home July 2025

China: Strong Household Demand for Gold in Recent Months

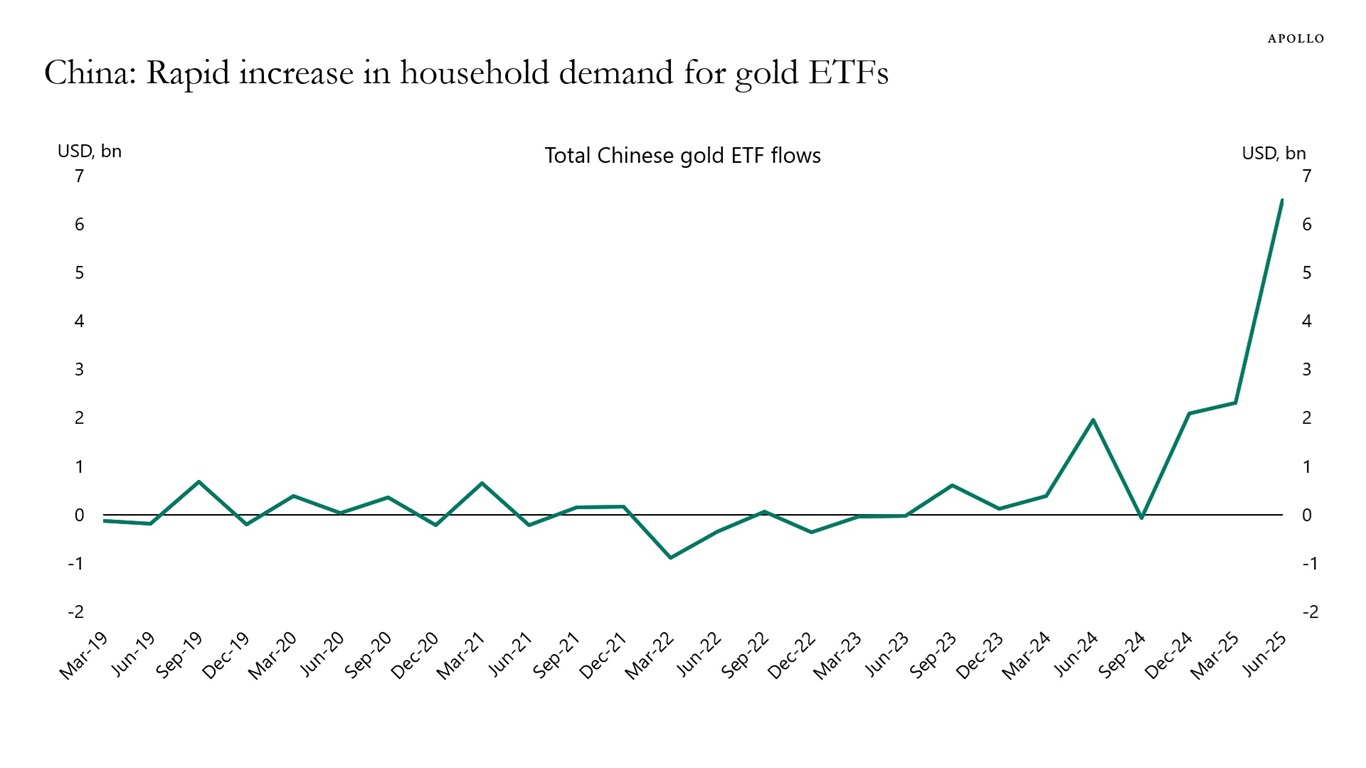
Demand for gold has increased significantly among households in China. This trend likely reflects the strong rally in gold prices, concerns about the ongoing decline in home prices, and worries about deflation and the weakening of the yuan, see chart below.

China: Rapid increase in household demand for gold ETFs
Sources: Bloomberg, Apollo Chief Economist

Download high-res chart

Recent Posts

  • The Duration Mismatch in the Banking Sector Is a Risk to Financial Stability
  • Default Rates Are Falling
  • Hybrid in Action: Delivering Bespoke Capital Solutions in a New Market Paradigm
  • Top 5 Risks in 2026
  • Swaption Volatility Remains Remarkably Low Despite Ongoing Fed Debate

Recent Comments

No comments to show.

Archives

  • December 2025
  • November 2025
  • October 2025
  • September 2025
  • August 2025
  • July 2025
  • June 2025
  • May 2025
  • April 2025
  • March 2025
  • February 2025
  • January 2025
  • December 2024
  • November 2024
  • October 2024
  • September 2024
  • August 2024
  • July 2024
  • June 2024
  • May 2024
  • April 2024
  • March 2024
  • February 2024
  • January 2024
  • December 2023
  • November 2023
  • October 2023
  • September 2023
  • August 2023
  • July 2023
  • June 2023
  • May 2023
  • April 2023
  • March 2023
  • February 2023
  • January 2023
  • December 2022
  • November 2022
  • October 2022
  • September 2022
  • August 2022
  • July 2022
  • June 2022
  • May 2022
  • April 2022
  • March 2022
  • February 2022
  • January 2022
  • December 2021
  • November 2021

Categories

  • Apollo Answers
  • Course Introductions
  • Economic Intelligence
  • Hide from Wordpress Search
  • Investment Knowledge
  • Perspectives
  • Redirecting
  • The Daily Spark
  • The View from Apollo
  • The Weekly Brief
  • Uncategorized
  • White Papers

Stablecoin Outlook

Almost 90% of stablecoin use is crypto trading, which will likely continue to grow.

The big breakthrough will be if US dollar stablecoins will be used for retail payments globally.

If the US dollar stablecoin market grows into the trillions, it will significantly grow demand for US T-bills.

There are financial stability risks because money will be moved around quickly if depositors lose confidence in a stablecoin issuer.

For more discussion, see our chart book here.

Stablecoins are the 18th largest external holder of Treasuries
Note: USDT is as of Q125 and USDC as of May 2025. Sources: US Treasury, Macrobond, Circle, Tether, Apollo Chief Economist
Almost 90% of stablecoin use is crypto trading
Note: Total may not sum to 100% due to rounding. Sources: BCG, Stablecoins-five-killer-tests-to-gauge-their-potential.pdf, Apollo Chief Economist
More people opening stablecoin addresses
Sources: Artemis, Apollo Chief Economist

Download high-res chart book

Recent Posts

  • The Duration Mismatch in the Banking Sector Is a Risk to Financial Stability
  • Default Rates Are Falling
  • Hybrid in Action: Delivering Bespoke Capital Solutions in a New Market Paradigm
  • Top 5 Risks in 2026
  • Swaption Volatility Remains Remarkably Low Despite Ongoing Fed Debate

Recent Comments

No comments to show.

Archives

  • December 2025
  • November 2025
  • October 2025
  • September 2025
  • August 2025
  • July 2025
  • June 2025
  • May 2025
  • April 2025
  • March 2025
  • February 2025
  • January 2025
  • December 2024
  • November 2024
  • October 2024
  • September 2024
  • August 2024
  • July 2024
  • June 2024
  • May 2024
  • April 2024
  • March 2024
  • February 2024
  • January 2024
  • December 2023
  • November 2023
  • October 2023
  • September 2023
  • August 2023
  • July 2023
  • June 2023
  • May 2023
  • April 2023
  • March 2023
  • February 2023
  • January 2023
  • December 2022
  • November 2022
  • October 2022
  • September 2022
  • August 2022
  • July 2022
  • June 2022
  • May 2022
  • April 2022
  • March 2022
  • February 2022
  • January 2022
  • December 2021
  • November 2021

Categories

  • Apollo Answers
  • Course Introductions
  • Economic Intelligence
  • Hide from Wordpress Search
  • Investment Knowledge
  • Perspectives
  • Redirecting
  • The Daily Spark
  • The View from Apollo
  • The Weekly Brief
  • Uncategorized
  • White Papers

Significant Private Credit Opportunities in Europe

The total addressable market for European direct lending to large-cap companies is enormous. Ninety-six percent of firms in Europe with revenue greater than $100 million are private, see chart below.

Europe: 96% of firms with revenue greater than $100 million are private
Note: For companies with last 12-month revenue greater than $100 million by count. Sources: S&P Capital IQ, Apollo Chief Economist

Download high-res chart

Recent Posts

  • The Duration Mismatch in the Banking Sector Is a Risk to Financial Stability
  • Default Rates Are Falling
  • Hybrid in Action: Delivering Bespoke Capital Solutions in a New Market Paradigm
  • Top 5 Risks in 2026
  • Swaption Volatility Remains Remarkably Low Despite Ongoing Fed Debate

Recent Comments

No comments to show.

Archives

  • December 2025
  • November 2025
  • October 2025
  • September 2025
  • August 2025
  • July 2025
  • June 2025
  • May 2025
  • April 2025
  • March 2025
  • February 2025
  • January 2025
  • December 2024
  • November 2024
  • October 2024
  • September 2024
  • August 2024
  • July 2024
  • June 2024
  • May 2024
  • April 2024
  • March 2024
  • February 2024
  • January 2024
  • December 2023
  • November 2023
  • October 2023
  • September 2023
  • August 2023
  • July 2023
  • June 2023
  • May 2023
  • April 2023
  • March 2023
  • February 2023
  • January 2023
  • December 2022
  • November 2022
  • October 2022
  • September 2022
  • August 2022
  • July 2022
  • June 2022
  • May 2022
  • April 2022
  • March 2022
  • February 2022
  • January 2022
  • December 2021
  • November 2021

Categories

  • Apollo Answers
  • Course Introductions
  • Economic Intelligence
  • Hide from Wordpress Search
  • Investment Knowledge
  • Perspectives
  • Redirecting
  • The Daily Spark
  • The View from Apollo
  • The Weekly Brief
  • Uncategorized
  • White Papers

Households Age 55 and Above Own a Growing Share of Household Assets

A growing share of US household assets is owned by people age 55 and above, see chart below. A contributing factor is the aging of the population, as there are more and more people in this age group.

In 2001, people age 55 and above owned 50% of all US household assets. Today they own 70%.
Sources: Federal Reserve, Macrobond, Apollo Chief Economist

Download high-res chart

Recent Posts

  • The Duration Mismatch in the Banking Sector Is a Risk to Financial Stability
  • Default Rates Are Falling
  • Hybrid in Action: Delivering Bespoke Capital Solutions in a New Market Paradigm
  • Top 5 Risks in 2026
  • Swaption Volatility Remains Remarkably Low Despite Ongoing Fed Debate

Recent Comments

No comments to show.

Archives

  • December 2025
  • November 2025
  • October 2025
  • September 2025
  • August 2025
  • July 2025
  • June 2025
  • May 2025
  • April 2025
  • March 2025
  • February 2025
  • January 2025
  • December 2024
  • November 2024
  • October 2024
  • September 2024
  • August 2024
  • July 2024
  • June 2024
  • May 2024
  • April 2024
  • March 2024
  • February 2024
  • January 2024
  • December 2023
  • November 2023
  • October 2023
  • September 2023
  • August 2023
  • July 2023
  • June 2023
  • May 2023
  • April 2023
  • March 2023
  • February 2023
  • January 2023
  • December 2022
  • November 2022
  • October 2022
  • September 2022
  • August 2022
  • July 2022
  • June 2022
  • May 2022
  • April 2022
  • March 2022
  • February 2022
  • January 2022
  • December 2021
  • November 2021

Categories

  • Apollo Answers
  • Course Introductions
  • Economic Intelligence
  • Hide from Wordpress Search
  • Investment Knowledge
  • Perspectives
  • Redirecting
  • The Daily Spark
  • The View from Apollo
  • The Weekly Brief
  • Uncategorized
  • White Papers

AI Could Solve the US Fiscal Problem

The Congressional Budget Office estimates that if AI results in permanently higher GDP growth and permanently lower inflation, it could solve the US fiscal problem, see chart below.

AI could solve the US fiscal problem
Sources: The Long-Term Budget Outlook Under Alternative Scenarios for the Economy and the Budget | Congressional Budget Office, Apollo Chief Economist

Download high-res chart

Recent Posts

  • The Duration Mismatch in the Banking Sector Is a Risk to Financial Stability
  • Default Rates Are Falling
  • Hybrid in Action: Delivering Bespoke Capital Solutions in a New Market Paradigm
  • Top 5 Risks in 2026
  • Swaption Volatility Remains Remarkably Low Despite Ongoing Fed Debate

Recent Comments

No comments to show.

Archives

  • December 2025
  • November 2025
  • October 2025
  • September 2025
  • August 2025
  • July 2025
  • June 2025
  • May 2025
  • April 2025
  • March 2025
  • February 2025
  • January 2025
  • December 2024
  • November 2024
  • October 2024
  • September 2024
  • August 2024
  • July 2024
  • June 2024
  • May 2024
  • April 2024
  • March 2024
  • February 2024
  • January 2024
  • December 2023
  • November 2023
  • October 2023
  • September 2023
  • August 2023
  • July 2023
  • June 2023
  • May 2023
  • April 2023
  • March 2023
  • February 2023
  • January 2023
  • December 2022
  • November 2022
  • October 2022
  • September 2022
  • August 2022
  • July 2022
  • June 2022
  • May 2022
  • April 2022
  • March 2022
  • February 2022
  • January 2022
  • December 2021
  • November 2021

Categories

  • Apollo Answers
  • Course Introductions
  • Economic Intelligence
  • Hide from Wordpress Search
  • Investment Knowledge
  • Perspectives
  • Redirecting
  • The Daily Spark
  • The View from Apollo
  • The Weekly Brief
  • Uncategorized
  • White Papers

The Quality of CPI Data Continues to Deteriorate

To calculate CPI inflation, BLS teams collect approximately 90,000 price quotes every month covering 200 different item categories, and there are several hundred field collectors active across 75 urban areas.

When data is not available, BLS staff typically develop estimates for approximately 10% of the cells in the CPI calculation. However, the share of data in the CPI that is estimated has increased significantly in recent months and is now above 30%, see chart below.

In other words, a rising share of prices going into the CPI at the moment are guesses based on other data collections in the CPI.

Significant increase in the share of alternate estimation in the CPI
Note: Different cell imputation is where uncollected prices are imputed from collected prices of the same item in other geographic areas or from collected prices of related item categories in the same geographic area. Sources: BLS, Apollo Chief Economist

Download high-res chart

Recent Posts

  • The Duration Mismatch in the Banking Sector Is a Risk to Financial Stability
  • Default Rates Are Falling
  • Hybrid in Action: Delivering Bespoke Capital Solutions in a New Market Paradigm
  • Top 5 Risks in 2026
  • Swaption Volatility Remains Remarkably Low Despite Ongoing Fed Debate

Recent Comments

No comments to show.

Archives

  • December 2025
  • November 2025
  • October 2025
  • September 2025
  • August 2025
  • July 2025
  • June 2025
  • May 2025
  • April 2025
  • March 2025
  • February 2025
  • January 2025
  • December 2024
  • November 2024
  • October 2024
  • September 2024
  • August 2024
  • July 2024
  • June 2024
  • May 2024
  • April 2024
  • March 2024
  • February 2024
  • January 2024
  • December 2023
  • November 2023
  • October 2023
  • September 2023
  • August 2023
  • July 2023
  • June 2023
  • May 2023
  • April 2023
  • March 2023
  • February 2023
  • January 2023
  • December 2022
  • November 2022
  • October 2022
  • September 2022
  • August 2022
  • July 2022
  • June 2022
  • May 2022
  • April 2022
  • March 2022
  • February 2022
  • January 2022
  • December 2021
  • November 2021

Categories

  • Apollo Answers
  • Course Introductions
  • Economic Intelligence
  • Hide from Wordpress Search
  • Investment Knowledge
  • Perspectives
  • Redirecting
  • The Daily Spark
  • The View from Apollo
  • The Weekly Brief
  • Uncategorized
  • White Papers

S&P 500 Returns Extremely Concentrated

If you had invested $1 million in the S&P 500 on January 1, 2021, your return today would be $660,000, of which more than half would have come from the top 10 biggest companies in the index, see chart below.

The bottom line is that returns in the S&P 500 are not diversified but instead remain extremely concentrated in a small group of tech stocks.

AI will continue to have a dramatic impact on all our lives, but the question remains whether the Magnificent 7 are correctly priced, and if they will even be the best AI investments over the next five to ten years.

S&P 500 returns are extremely concentrated
Note: Top 10 companies are NVIDIA, Microsoft, Apple, Amazon, Alphabet, Meta, Broadcom, Tesla, Berkshire Hathaway, JP Morgan. Sources: Bloomberg, Apollo Chief Economist

Download high-res chart

Recent Posts

  • The Duration Mismatch in the Banking Sector Is a Risk to Financial Stability
  • Default Rates Are Falling
  • Hybrid in Action: Delivering Bespoke Capital Solutions in a New Market Paradigm
  • Top 5 Risks in 2026
  • Swaption Volatility Remains Remarkably Low Despite Ongoing Fed Debate

Recent Comments

No comments to show.

Archives

  • December 2025
  • November 2025
  • October 2025
  • September 2025
  • August 2025
  • July 2025
  • June 2025
  • May 2025
  • April 2025
  • March 2025
  • February 2025
  • January 2025
  • December 2024
  • November 2024
  • October 2024
  • September 2024
  • August 2024
  • July 2024
  • June 2024
  • May 2024
  • April 2024
  • March 2024
  • February 2024
  • January 2024
  • December 2023
  • November 2023
  • October 2023
  • September 2023
  • August 2023
  • July 2023
  • June 2023
  • May 2023
  • April 2023
  • March 2023
  • February 2023
  • January 2023
  • December 2022
  • November 2022
  • October 2022
  • September 2022
  • August 2022
  • July 2022
  • June 2022
  • May 2022
  • April 2022
  • March 2022
  • February 2022
  • January 2022
  • December 2021
  • November 2021

Categories

  • Apollo Answers
  • Course Introductions
  • Economic Intelligence
  • Hide from Wordpress Search
  • Investment Knowledge
  • Perspectives
  • Redirecting
  • The Daily Spark
  • The View from Apollo
  • The Weekly Brief
  • Uncategorized
  • White Papers

Quantifying the Impact of Higher Government Debt on Long Rates

Academic papers quantifying the impact on 10-year interest rates of a one percentage point increase in US government debt-to-GDP find an effect of 3 basis points, see chart below.

The CBO forecasts that US government debt-to-GDP over the coming decade will increase by roughly 20 percentage points, and the estimates below imply that this will permanently increase 10-year interest rates by 60 basis points.

Studies quantifying the impact on long-term interest rates of a 1 percentage point increase in US government debt
Source: Apollo Chief Economist and James Thomas

Download high-res chart

Recent Posts

  • The Duration Mismatch in the Banking Sector Is a Risk to Financial Stability
  • Default Rates Are Falling
  • Hybrid in Action: Delivering Bespoke Capital Solutions in a New Market Paradigm
  • Top 5 Risks in 2026
  • Swaption Volatility Remains Remarkably Low Despite Ongoing Fed Debate

Recent Comments

No comments to show.

Archives

  • December 2025
  • November 2025
  • October 2025
  • September 2025
  • August 2025
  • July 2025
  • June 2025
  • May 2025
  • April 2025
  • March 2025
  • February 2025
  • January 2025
  • December 2024
  • November 2024
  • October 2024
  • September 2024
  • August 2024
  • July 2024
  • June 2024
  • May 2024
  • April 2024
  • March 2024
  • February 2024
  • January 2024
  • December 2023
  • November 2023
  • October 2023
  • September 2023
  • August 2023
  • July 2023
  • June 2023
  • May 2023
  • April 2023
  • March 2023
  • February 2023
  • January 2023
  • December 2022
  • November 2022
  • October 2022
  • September 2022
  • August 2022
  • July 2022
  • June 2022
  • May 2022
  • April 2022
  • March 2022
  • February 2022
  • January 2022
  • December 2021
  • November 2021

Categories

  • Apollo Answers
  • Course Introductions
  • Economic Intelligence
  • Hide from Wordpress Search
  • Investment Knowledge
  • Perspectives
  • Redirecting
  • The Daily Spark
  • The View from Apollo
  • The Weekly Brief
  • Uncategorized
  • White Papers

The Impact of Immigration Restrictions and Deportations

If 3,000 people are deported every day, the labor supply will decline by about 1 million in total in 2025.

Combined with additional immigration restrictions, job growth is slowing down.

If legal immigration continues at current levels and illegal immigration declines to zero, the new level of monthly nonfarm payrolls will be 72,000.

Deportations and immigration restrictions are likely to increase wage growth in agriculture, construction, and leisure & hospitality.

Deportations and immigration restrictions lower demand for housing.

The bottom line is that immigration policy has implications for labor supply, nonfarm payrolls, wages, and housing demand. To better understand these effects, we have compiled a chart book, which is available here.

Future changes in monthly employment depend on immigration policy
Note: Calculations use Congressional Budget Office demographic data as well as current Bureau of Labor Statistics reports to project monthly changes in employment. Sources: Congressional Budget Office: The Demographic Outlook
Unauthorized workers make up a significant share of employment in key industries in the US
Sources: US Department of Agriculture, Bureau of Labor Statistics
Deportations: ICE Book-Ins
Sources: ICE, Haver Analytics, Apollo Chief Economist
The number of southwest border encounters has declined to near zero in 2025
Source: US Customs and Border Protection
3.8 million immigrants in the US have liminal or “twilight” status through programs, which are being suspended or terminated
Source: US Customs and Border Protection

Download high-res chart book

Recent Posts

  • The Duration Mismatch in the Banking Sector Is a Risk to Financial Stability
  • Default Rates Are Falling
  • Hybrid in Action: Delivering Bespoke Capital Solutions in a New Market Paradigm
  • Top 5 Risks in 2026
  • Swaption Volatility Remains Remarkably Low Despite Ongoing Fed Debate

Recent Comments

No comments to show.

Archives

  • December 2025
  • November 2025
  • October 2025
  • September 2025
  • August 2025
  • July 2025
  • June 2025
  • May 2025
  • April 2025
  • March 2025
  • February 2025
  • January 2025
  • December 2024
  • November 2024
  • October 2024
  • September 2024
  • August 2024
  • July 2024
  • June 2024
  • May 2024
  • April 2024
  • March 2024
  • February 2024
  • January 2024
  • December 2023
  • November 2023
  • October 2023
  • September 2023
  • August 2023
  • July 2023
  • June 2023
  • May 2023
  • April 2023
  • March 2023
  • February 2023
  • January 2023
  • December 2022
  • November 2022
  • October 2022
  • September 2022
  • August 2022
  • July 2022
  • June 2022
  • May 2022
  • April 2022
  • March 2022
  • February 2022
  • January 2022
  • December 2021
  • November 2021

Categories

  • Apollo Answers
  • Course Introductions
  • Economic Intelligence
  • Hide from Wordpress Search
  • Investment Knowledge
  • Perspectives
  • Redirecting
  • The Daily Spark
  • The View from Apollo
  • The Weekly Brief
  • Uncategorized
  • White Papers

Outlook for the US Dollar

The dollar has depreciated more in the first half of 2025 than yield differentials would have predicted, see charts below and the chart book available here.

Regression models indicate that this was due to the trade war and economic policy uncertainty, including concerns among foreign investors about Section 899 and the Mar-a-Lago Accord.

Looking ahead, with Section 899 behind us and the trade war likely to be resolved within the next couple of weeks, the US dollar is expected to appreciate again.

Renewed strong appetite for US assets after Liberation Day is also visible in the Treasury International Capital data for May.

Why did the relationship between the dollar and interest rate differentials break down?
Note: 1-year yield differential = 1-year German government bill minus 1-year T-bill. pp = percentage points. Sources: Bloomberg, Macrobond, Apollo Chief Economist
Interest in the Mar-a-Lago Accord and Section 899 started in March
Sources: Bloomberg, Apollo Chief Economist
Strong rebound in foreign demand for US assets in May
Sources: US Department of Treasury, Macrobond, Apollo Chief Economist
Explaining the US dollar’s depreciation in the first half of 2025

Download high-res chart book

Recent Posts

  • The Duration Mismatch in the Banking Sector Is a Risk to Financial Stability
  • Default Rates Are Falling
  • Hybrid in Action: Delivering Bespoke Capital Solutions in a New Market Paradigm
  • Top 5 Risks in 2026
  • Swaption Volatility Remains Remarkably Low Despite Ongoing Fed Debate

Recent Comments

No comments to show.

Archives

  • December 2025
  • November 2025
  • October 2025
  • September 2025
  • August 2025
  • July 2025
  • June 2025
  • May 2025
  • April 2025
  • March 2025
  • February 2025
  • January 2025
  • December 2024
  • November 2024
  • October 2024
  • September 2024
  • August 2024
  • July 2024
  • June 2024
  • May 2024
  • April 2024
  • March 2024
  • February 2024
  • January 2024
  • December 2023
  • November 2023
  • October 2023
  • September 2023
  • August 2023
  • July 2023
  • June 2023
  • May 2023
  • April 2023
  • March 2023
  • February 2023
  • January 2023
  • December 2022
  • November 2022
  • October 2022
  • September 2022
  • August 2022
  • July 2022
  • June 2022
  • May 2022
  • April 2022
  • March 2022
  • February 2022
  • January 2022
  • December 2021
  • November 2021

Categories

  • Apollo Answers
  • Course Introductions
  • Economic Intelligence
  • Hide from Wordpress Search
  • Investment Knowledge
  • Perspectives
  • Redirecting
  • The Daily Spark
  • The View from Apollo
  • The Weekly Brief
  • Uncategorized
  • White Papers

Posts navigation

Page 1 Page 2 … Page 4 Next page→
  • Privacy Notice
  • Terms of Use
  • Forward-Looking Statements
Apollo
© Apollo Global Management, Inc. All Rights Reserved.

The Apollo Academy is for informational and educational purposes only and nothing contained herein should be taken as investment advice or a recommendation to enter into any transaction. They are not an invitation by or on behalf of Apollo to any person to buy or sell any security or to adopt any investment strategy, and shall not form the basis of, nor may it accompany nor form part of, any right or contract to buy or sell any security or to adopt any investment strategy. There is no guarantee that the views and opinions expressed in this website will come to pass. For additional information, please see the disclaimers included in each piece of content or the legal page of our website here.