Our latest outlook for credit markets, authored by my colleagues John Cortese, Rob Bittencourt, Akila Grewal, Shobhit Gupta, and Tal Barak Harif, is available here.
Key Takeaways
- Tariff-driven headline risk, geopolitical volatility and fiscal policy shifts disrupted markets in the year’s first half—but failed to derail the credit cycle. Strong macro and corporate fundamentals, steady institutional demand and limited new supply helped anchor spreads. While downside risks have grown, fundamentals and technicals are expected to remain supportive through the end of the year.
- The investment-grade bond market has become increasingly bifurcated, with most liquidity concentrated in a small set of recent issues, while older bonds trade infrequently and offer little spread pickup. This dynamic was put to the test during the volatility surrounding Liberation Day. For long-term investors, private credit may offer a better alternative—providing similar liquidity with higher spread compensation.
- Global capital is rebalancing away from the US: In the wake of the geopolitical tensions and US domestic policy shifts during the first half of the year, early signs of capital rotation out of US assets may be starting to emerge. Sovereign funds and central banks are reallocating toward Europe—fueling strong inflows into the region’s equity and credit markets.
- Europe’s private credit market is large, underpenetrated and gaining momentum. Non-bank lending accounts for an estimated 12% of corporate financing versus 75% in the US. Structural tailwinds—regulatory reform, fiscal stimulus and favorable pricing—are creating a scalable growth opportunity, positioning Europe as a key market for direct lending.
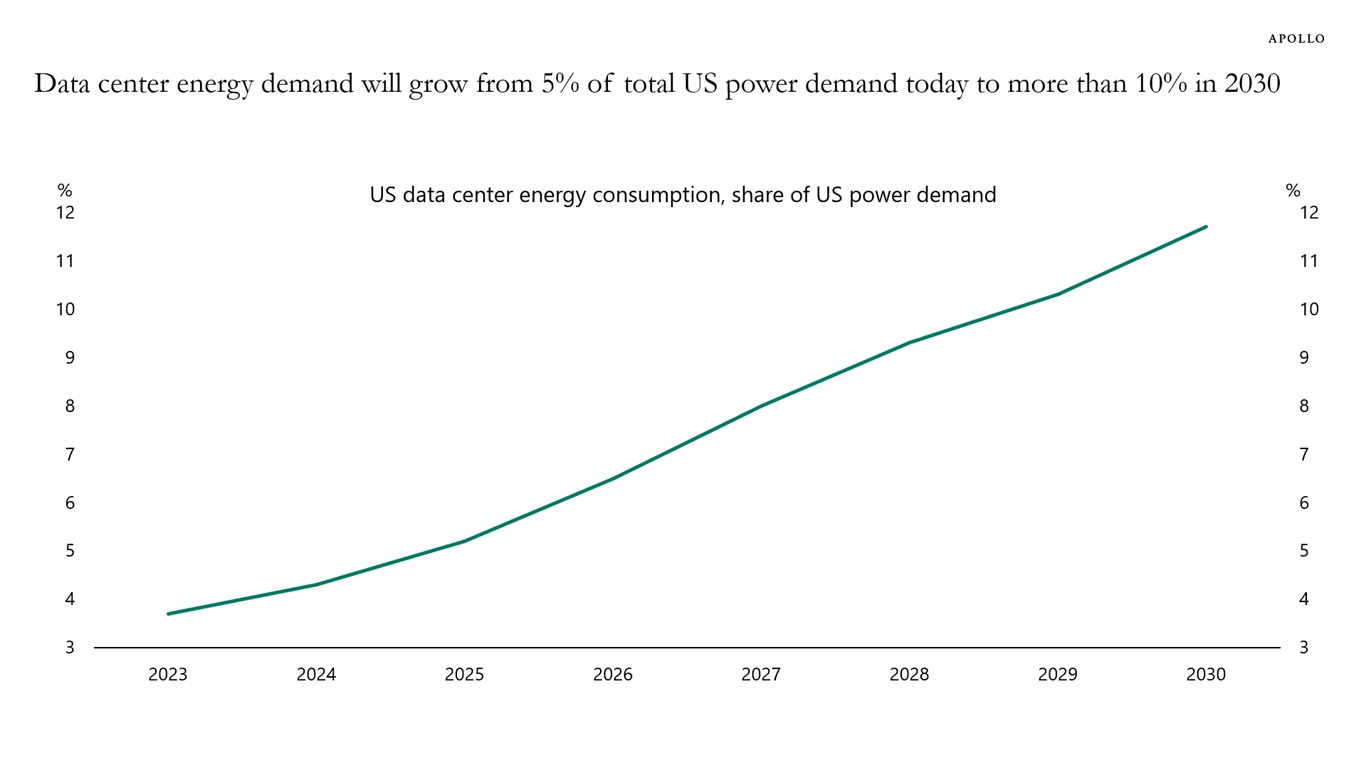
- The generative AI boom is no longer just an equity story—it’s increasingly being financed through credit. Hyperscalers are issuing billions to fund data centers, while early-stage AI firms are tapping debt markets to scale. As capex soars and adoption accelerates, credit investors are helping fund the physical backbone of the AI economy.