• Apollo.com
  • Login
  • Register Now
light site-logo
  • The Academy
  • Upcoming Events
        • Upcoming Events

  • Learning Center
        • New & UpdatedAlternative Investing Course 2.0

        • Alternative Investing Essentials Part OnePrivate Equity, Venture Capital, Private Credit
        • Alternative Investing Essentials Part TwoReal Estate, Infrastructure, Digital Assets, Hedge Funds
        • Practical ConsiderationsAsset Allocation, Risk Considerations, Fund Structures, Fees
        • Introductory Videos

          View All Videos

        •  Recent Classes & Videos

        • • 2026 Outlook
        • • Private Equity’s Edge: Delivering Alpha in a Changing Market
        • • Powering Innovation: Infrastructure Investing Across the AI Value Chain
        • • Mid-Year Outlook: At the Crossroads of Stagflation — What’s Next?
        • • Hybrid Investments: Flexible Structures for Volatile Times
        • • Private Credit Investing in Volatile Times
        • View All Classes

  • Alternative Perspectives
        • Investment Knowledge
        • The View from Apollo
          • Investment Knowledge White Papers

            After 60/40: In Private Markets, Manager Selection Matters

            February 27, 2026
          • The View From Apollo

            Allocation Insights: Asset-Backed Finance Is the Engine Behind Private Credit’s Next Chapter

            February 17, 2026
          • Investment Knowledge White Papers

            Private Equity Returns to Its Roots

            January 29, 2026
  • The Daily Spark
        • Read The Daily Spark Blog


        • Want it delivered daily to your inbox?
          • The Daily Spark

            Strong Net Foreign Buying of US Assets

            March 2, 2026
          • The Daily Spark

            Average Tenure of Companies in the S&P 500 Index: 15 Years

            March 1, 2026
          • The Daily Spark

            Fed Pricing Reveals Market Expectations About the AI Adoption Pace

            February 28, 2026
  • Register for Apollo Academy: Alternative Investing Course
  • Login
  • About Apollo Academy
  • Upcoming Events
  • Learning Center
  • Alternative Perspectives
  • The Daily Spark
  • Register for Apollo Academy: Alternative Investing Course
  • Login
  • Alternative Investing Course 2.0
  • 2026 Outlook
  • Private Equity’s Edge: Delivering Alpha in a Changing Market
  • Powering Innovation: Infrastructure Investing Across the AI Value Chain
  • Mid-Year Outlook: At the Crossroads of Stagflation — What’s Next?
  • Hybrid Investments: Flexible Structures for Volatile Times
  • Private Credit Investing in Volatile Times
  • View All Classes
  • Introductory Videos
  • Alternative Investing Essentials Part One • Now Available On Demand
  • Alternative Investing Essentials Part Two • Now Available On Demand
  • Practical Considerations • Now Available On Demand
  • Investment Knowledge
  • The View from Apollo
Home September 2025

Apollo Answers

Apollo Answers: 10 Questions for Private Credit

Apollo Answers

From loan vintages and leverage ratios to payment-in-kind interest and manager alignment, these and other critical factors can help evaluate private credit opportunities. Alex Wright, Partner and Global Wealth Strategist at Apollo, explores 10 key questions to ask private credit managers in our latest episode of “Apollo Answers.” Watch it now.

DOWNLOAD PDF

The information herein is provided for educational purposes only and should not be construed as financial or investment advice, nor should any information in this document be relied on when making an investment decision. Opinions and views expressed reflect the current opinions and views of the authors and Apollo Analysts as of the date hereof and are subject to change. Please see the end of this document for important disclosure information.


Important Disclosure Information

This presentation is for educational purposes only and should not be treated as research. This presentation may not be distributed, transmitted or otherwise communicated to others, in whole or in part, without the express written consent of Apollo Global Management, Inc. (together with its subsidiaries, “Apollo”).

The views and opinions expressed in this presentation are the views and opinions of the author(s) of the White Paper. They do not necessarily reflect the views and opinions of Apollo and are subject to change at any time without notice. Further, Apollo and its affiliates may have positions (long or short) or engage in securities transactions that are not consistent with the information and views expressed in this presentation. There can be no assurance that an investment strategy will be successful. Historic market trends are not reliable indicators of actual future market behavior or future performance of any particular investment which may differ materially, and should not be relied upon as such. Target allocations contained herein are subject to change. There is no assurance that the target allocations will be achieved, and actual allocations may be significantly different than that shown here. This presentation does not constitute an offer of any service or product of Apollo. It is not an invitation by or on behalf of Apollo to any person to buy or sell any security or to adopt any investment strategy, and shall not form the basis of, nor may it accompany nor form part of, any right or contract to buy or sell any security or to adopt any investment strategy. Nothing herein should be taken as investment advice or a recommendation to enter into any transaction.

Hyperlinks to third-party websites in this presentation are provided for reader convenience only. There can be no assurance that any trends discussed herein will continue. Unless otherwise noted, information included herein is presented as of the dates indicated. This presentation is not complete and the information contained herein may change at any time without notice. Apollo does not have any responsibility to update the presentation to account for such changes. Apollo has not made any representation or warranty, expressed or implied, with respect to fairness, correctness, accuracy, reasonableness, or completeness of any of the information contained herein, and expressly disclaims any responsibility or liability therefore. The information contained herein is not intended to provide, and should not be relied upon for, accounting, legal or tax advice or investment recommendations. Investors should make an independent investigation of the information contained herein, including consulting their tax, legal, accounting or other advisors about such information. Apollo does not act for you and is not responsible for providing you with the protections afforded to its clients.

Certain information contained herein may be “forward-looking” in nature. Due to various risks and uncertainties, actual events or results may differ materially from those reflected or contemplated in such forward-looking information. As such, undue reliance should not be placed on such information. Forward-looking statements may be identified by the use of terminology including, but not limited to, “may”, “will”, “should”, “expect”, “anticipate”, “target”, “project”, “estimate”, “intend”, “continue” or “believe” or the negatives thereof or other variations thereon or comparable terminology.

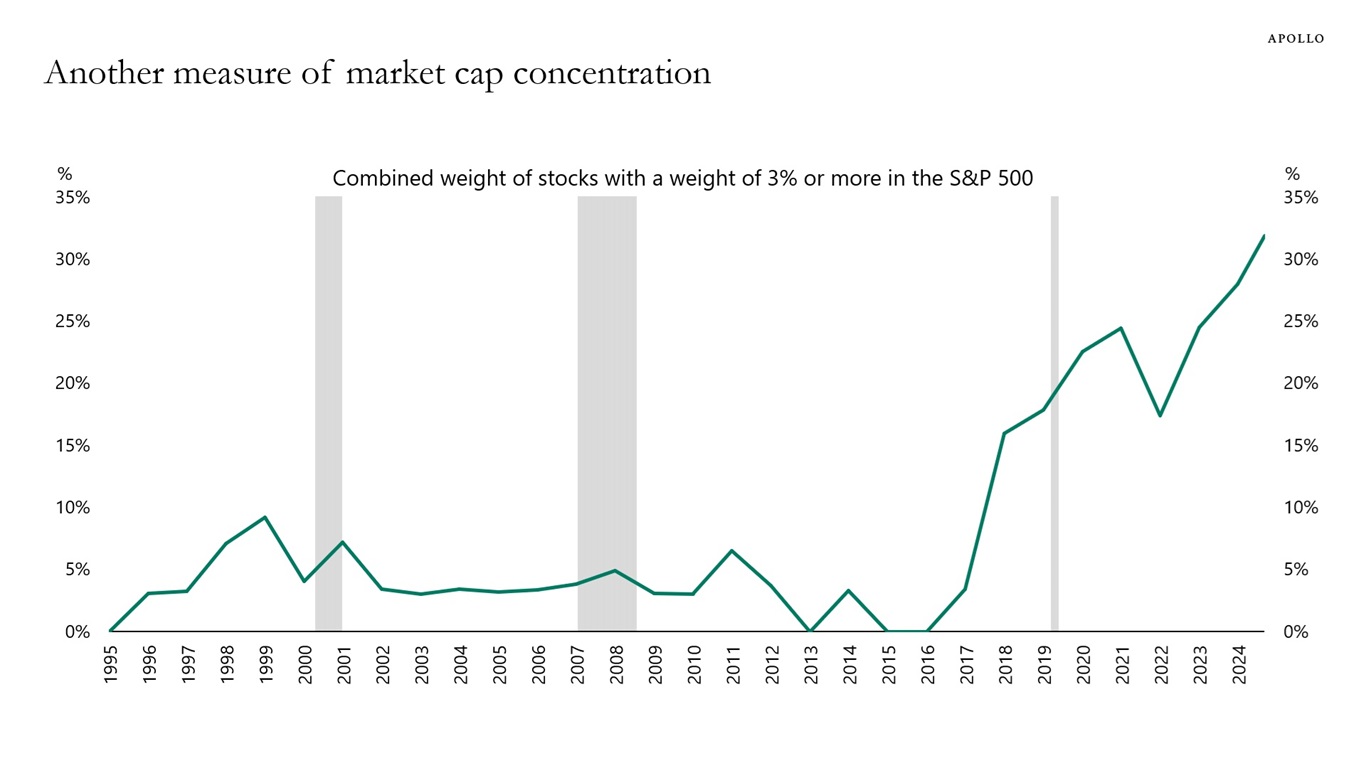
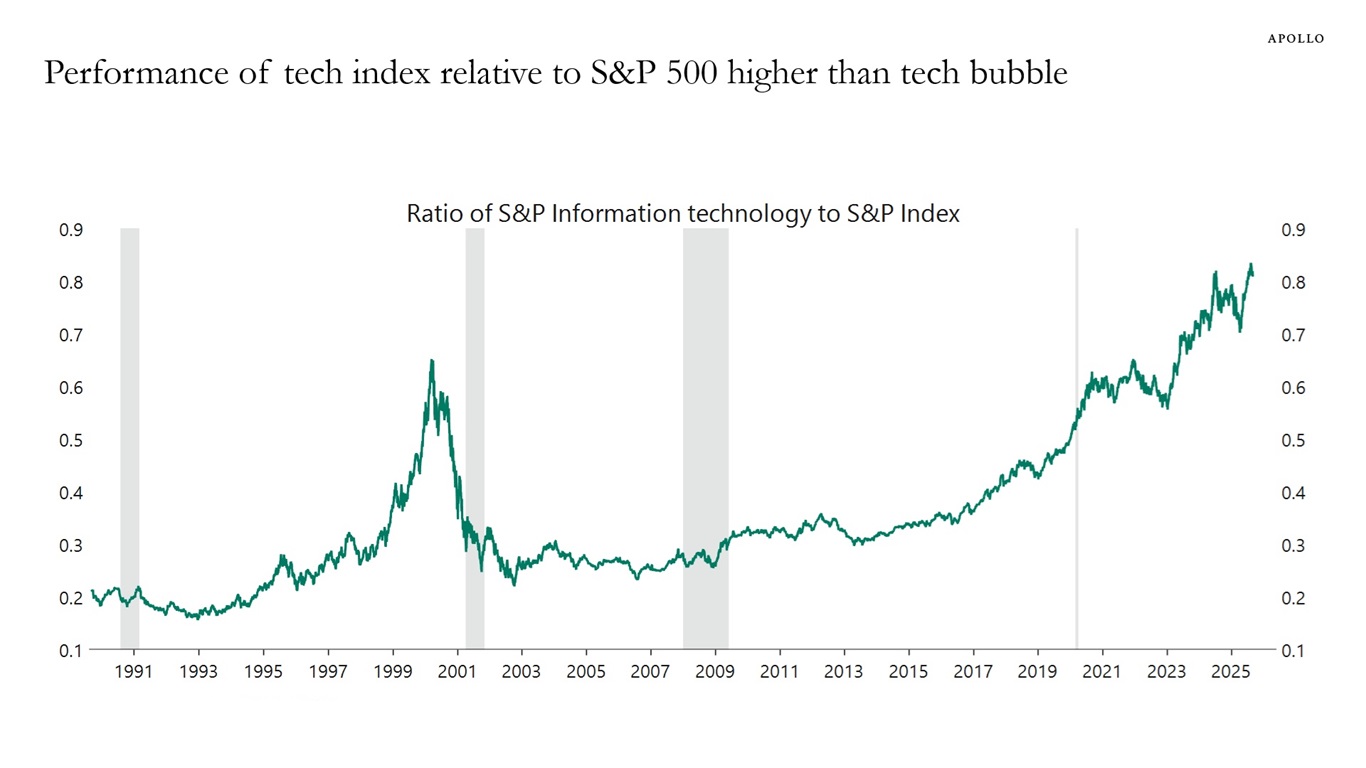
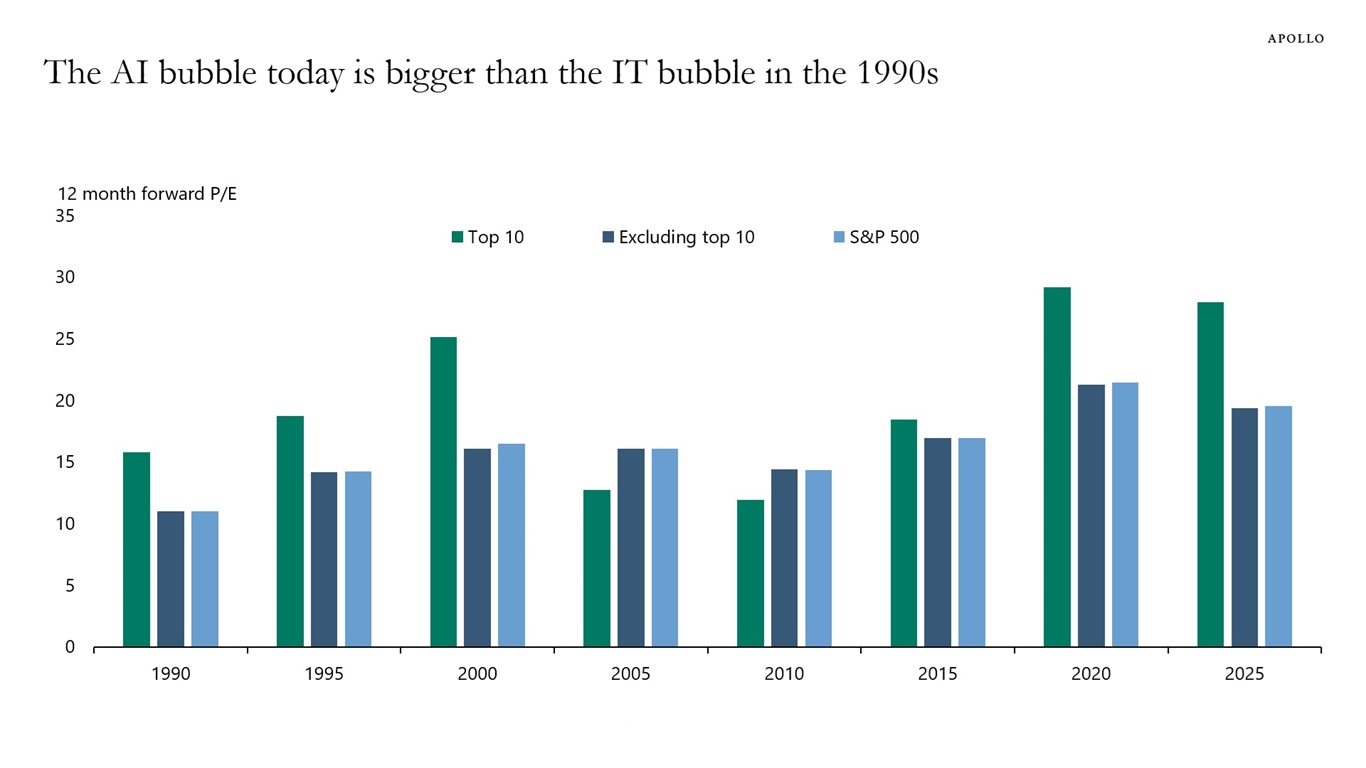
The Standard & Poor’s 500 (“S&P 500”) Index is a market-capitalization-weighted index of the 500 largest U.S. publicly traded companies by market value.

Additional information may be available upon request.

Recent Posts

  • Strong Net Foreign Buying of US Assets
  • Average Tenure of Companies in the S&P 500 Index: 15 Years
  • Fed Pricing Reveals Market Expectations About the AI Adoption Pace
  • After 60/40: In Private Markets, Manager Selection Matters
  • Equity Market Trading Volumes Rising

Recent Comments

No comments to show.

Archives

  • March 2026
  • February 2026
  • January 2026
  • December 2025
  • November 2025
  • October 2025
  • September 2025
  • August 2025
  • July 2025
  • June 2025
  • May 2025
  • April 2025
  • March 2025
  • February 2025
  • January 2025
  • December 2024
  • November 2024
  • October 2024
  • September 2024
  • August 2024
  • July 2024
  • June 2024
  • May 2024
  • April 2024
  • March 2024
  • February 2024
  • January 2024
  • December 2023
  • November 2023
  • October 2023
  • September 2023
  • August 2023
  • July 2023
  • June 2023
  • May 2023
  • April 2023
  • March 2023
  • February 2023
  • January 2023
  • December 2022
  • November 2022
  • October 2022
  • September 2022
  • August 2022
  • July 2022
  • June 2022
  • May 2022
  • April 2022
  • March 2022
  • February 2022
  • January 2022
  • December 2021
  • November 2021

Categories

  • Apollo Answers
  • Course Introductions
  • Economic Intelligence
  • Hide from Wordpress Search
  • Investment Knowledge
  • Perspectives
  • Redirecting
  • The Daily Spark
  • The View from Apollo
  • The Weekly Brief
  • Uncategorized
  • White Papers

Strong Economy, but Weak Labor Market Because of Lower Immigration?

Daily and weekly data for the US economy shows that:

1) Trade policy uncertainty is returning to more normal levels

2) Economic policy uncertainty is returning to more normal levels

3) Restaurant bookings remain solid

4) US air travel remains robust

5) Las Vegas visitor volumes and total nights occupied remain solid

6) Same-store retail sales remain solid

7) Hotel bookings remain solid

8) Banks’ loan growth is increasing

9) Bankruptcy filings are stable

10) Broadway attendance and visits to the Statue of Liberty remain at normal levels

Maybe the reason the labor market is softening is because of lower immigration and not because of a slowdown in the broader economy?

Trade policy uncertainty improving
Sources: Economic Policy Uncertainty, Macrobond, Apollo Chief Economist
Economic policy uncertainty improving
Sources: Economic Policy Uncertainty, Macrobond, Apollo Chief Economist
Consumer expectations to business conditions
Sources: Conference Board, Macrobond, Apollo Chief Economist
Daily data for restaurant bookings
Sources: OpenTable, Apollo Chief Economist
Daily data for US air travel
Sources: US Department of Homeland Security, Macrobond, Apollo Chief Economist
Las Vegas tourism
Sources: Bloomberg, Macrobond, Apollo Chief Economist
Weekly data for same-store retail sales
Sources: Redbook Research Inc., Macrobond, Apollo Chief Economist
Weekly data for hotel demand
Sources: STR, Haver Analytics, Apollo Chief Economist
Weekly loan growth for banks
Sources: Federal Reserve, Macrobond, Apollo Chief Economist
Weekly bankruptcy filings
Note: Filings are for companies with more than $50 mn in liabilities. For week ending on September 4th, 2025. Sources: Bloomberg, Apollo Chief Economist
Weekly Broadway show attendance
Sources: The Broadway League, Macrobond, Apollo Chief Economist
Visits to the Statue of Liberty
Sources: irma.nps.gov, Apollo Chief Economist

Download daily and weekly chart book

Recent Posts

  • Strong Net Foreign Buying of US Assets
  • Average Tenure of Companies in the S&P 500 Index: 15 Years
  • Fed Pricing Reveals Market Expectations About the AI Adoption Pace
  • After 60/40: In Private Markets, Manager Selection Matters
  • Equity Market Trading Volumes Rising

Recent Comments

No comments to show.

Archives

  • March 2026
  • February 2026
  • January 2026
  • December 2025
  • November 2025
  • October 2025
  • September 2025
  • August 2025
  • July 2025
  • June 2025
  • May 2025
  • April 2025
  • March 2025
  • February 2025
  • January 2025
  • December 2024
  • November 2024
  • October 2024
  • September 2024
  • August 2024
  • July 2024
  • June 2024
  • May 2024
  • April 2024
  • March 2024
  • February 2024
  • January 2024
  • December 2023
  • November 2023
  • October 2023
  • September 2023
  • August 2023
  • July 2023
  • June 2023
  • May 2023
  • April 2023
  • March 2023
  • February 2023
  • January 2023
  • December 2022
  • November 2022
  • October 2022
  • September 2022
  • August 2022
  • July 2022
  • June 2022
  • May 2022
  • April 2022
  • March 2022
  • February 2022
  • January 2022
  • December 2021
  • November 2021

Categories

  • Apollo Answers
  • Course Introductions
  • Economic Intelligence
  • Hide from Wordpress Search
  • Investment Knowledge
  • Perspectives
  • Redirecting
  • The Daily Spark
  • The View from Apollo
  • The Weekly Brief
  • Uncategorized
  • White Papers

Daily Data Shows Consumer Spending Slowing Down on Goods Impacted by Tariffs

Daily data for consumer spending shows growth is slowing in discretionaries and on goods that are impacted by tariffs, see tables below.

Our chart book with daily data for consumer spending is available here.

Consumer spending momentum: Essentials and Discretionary
Note: Stable is defined as growth falling between 0.5 to -0.5 standard deviation of the past 90 days, rising momentum is higher than 0.5 standard deviation and falling momentum is -0.5 standard deviation. Past week ends on 29th August 2025. Sources: US Bloomberg Consumer Spending, Apollo Chief Economist
Note: Stable is defined as growth falling between 0.5 to -0.5 standard deviation of the past 90 days, rising momentum is higher than 0.5 standard deviation and falling momentum is -0.5 standard deviation. Past week ends on 29th August 2025. Sources: US Bloomberg Consumer Spending, Apollo Chief Economist.

Download high-res chart book

Recent Posts

  • Strong Net Foreign Buying of US Assets
  • Average Tenure of Companies in the S&P 500 Index: 15 Years
  • Fed Pricing Reveals Market Expectations About the AI Adoption Pace
  • After 60/40: In Private Markets, Manager Selection Matters
  • Equity Market Trading Volumes Rising

Recent Comments

No comments to show.

Archives

  • March 2026
  • February 2026
  • January 2026
  • December 2025
  • November 2025
  • October 2025
  • September 2025
  • August 2025
  • July 2025
  • June 2025
  • May 2025
  • April 2025
  • March 2025
  • February 2025
  • January 2025
  • December 2024
  • November 2024
  • October 2024
  • September 2024
  • August 2024
  • July 2024
  • June 2024
  • May 2024
  • April 2024
  • March 2024
  • February 2024
  • January 2024
  • December 2023
  • November 2023
  • October 2023
  • September 2023
  • August 2023
  • July 2023
  • June 2023
  • May 2023
  • April 2023
  • March 2023
  • February 2023
  • January 2023
  • December 2022
  • November 2022
  • October 2022
  • September 2022
  • August 2022
  • July 2022
  • June 2022
  • May 2022
  • April 2022
  • March 2022
  • February 2022
  • January 2022
  • December 2021
  • November 2021

Categories

  • Apollo Answers
  • Course Introductions
  • Economic Intelligence
  • Hide from Wordpress Search
  • Investment Knowledge
  • Perspectives
  • Redirecting
  • The Daily Spark
  • The View from Apollo
  • The Weekly Brief
  • Uncategorized
  • White Papers

No Alpha Left in Public Markets

There are fewer public companies to invest in, and firms that decide to do an IPO are getting older and older.

In 1999, the median age of IPOs was five years. In 2022, it was eight years, and today, the median age of IPOs has increased to 14 years, see chart below.

The rise in the age of companies going public is not only a result of the Fed raising interest rates in 2022, but also the consequence of more companies wanting to stay private for longer to avoid the burdens of being public.

Combined with the domination of passive investing, failure of active managers and high correlation in public markets, and high concentration in a few stocks, the reality is that there is no alpha left in public markets.

The median age of IPOs is currently 14 years
Sources: Jay Ritter, University of Florida, Apollo Chief Economist

Download high-res chart

Recent Posts

  • Strong Net Foreign Buying of US Assets
  • Average Tenure of Companies in the S&P 500 Index: 15 Years
  • Fed Pricing Reveals Market Expectations About the AI Adoption Pace
  • After 60/40: In Private Markets, Manager Selection Matters
  • Equity Market Trading Volumes Rising

Recent Comments

No comments to show.

Archives

  • March 2026
  • February 2026
  • January 2026
  • December 2025
  • November 2025
  • October 2025
  • September 2025
  • August 2025
  • July 2025
  • June 2025
  • May 2025
  • April 2025
  • March 2025
  • February 2025
  • January 2025
  • December 2024
  • November 2024
  • October 2024
  • September 2024
  • August 2024
  • July 2024
  • June 2024
  • May 2024
  • April 2024
  • March 2024
  • February 2024
  • January 2024
  • December 2023
  • November 2023
  • October 2023
  • September 2023
  • August 2023
  • July 2023
  • June 2023
  • May 2023
  • April 2023
  • March 2023
  • February 2023
  • January 2023
  • December 2022
  • November 2022
  • October 2022
  • September 2022
  • August 2022
  • July 2022
  • June 2022
  • May 2022
  • April 2022
  • March 2022
  • February 2022
  • January 2022
  • December 2021
  • November 2021

Categories

  • Apollo Answers
  • Course Introductions
  • Economic Intelligence
  • Hide from Wordpress Search
  • Investment Knowledge
  • Perspectives
  • Redirecting
  • The Daily Spark
  • The View from Apollo
  • The Weekly Brief
  • Uncategorized
  • White Papers

Extreme Concentration in the S&P 500

Our chart book—available here—documents the extreme AI concentration within the S&P 500’s market cap, returns, earnings and capex.

Another measure of market cap concentration
Sources: Bloomberg, Apollo Chief Economist
Performance of tech index relative to S&P 500 higher than tech bubble
Sources: Bloomberg, Macrobond, Apollo Chief Economist
Earnings growth concentrated in the Magnificent 7 and slowing down
Sources: FactSet, Apollo Chief Economist
The AI bubble today is bigger than the IT bubble in the 1990s
Note: Data as of July 2025. Top 4 and top 10 companies are by market cap. Sources: Bloomberg, Apollo Chief Economist
Hyperscalers’ capital expenditure share of US private domestic investment has doubled since 2023
Sources: Bloomberg, Apollo Chief Economist
Capital expenditure share of GDP much higher for hyperscalers today vs. telecom companies during dot-com bubble
Note: Hyperscaler companies include Oracle, Microsoft, Meta, Amazon and Google. Telecom companies include Level 3 Communications, WorldCom, Global Crossing, Nortel Networks, Verizon, AT&T, Nokia, Cisco Systems, Williams Companies and XO Communications. Sources: Bloomberg, FactSet, Apollo Chief Economist

Download high-res chart book

Recent Posts

  • Strong Net Foreign Buying of US Assets
  • Average Tenure of Companies in the S&P 500 Index: 15 Years
  • Fed Pricing Reveals Market Expectations About the AI Adoption Pace
  • After 60/40: In Private Markets, Manager Selection Matters
  • Equity Market Trading Volumes Rising

Recent Comments

No comments to show.

Archives

  • March 2026
  • February 2026
  • January 2026
  • December 2025
  • November 2025
  • October 2025
  • September 2025
  • August 2025
  • July 2025
  • June 2025
  • May 2025
  • April 2025
  • March 2025
  • February 2025
  • January 2025
  • December 2024
  • November 2024
  • October 2024
  • September 2024
  • August 2024
  • July 2024
  • June 2024
  • May 2024
  • April 2024
  • March 2024
  • February 2024
  • January 2024
  • December 2023
  • November 2023
  • October 2023
  • September 2023
  • August 2023
  • July 2023
  • June 2023
  • May 2023
  • April 2023
  • March 2023
  • February 2023
  • January 2023
  • December 2022
  • November 2022
  • October 2022
  • September 2022
  • August 2022
  • July 2022
  • June 2022
  • May 2022
  • April 2022
  • March 2022
  • February 2022
  • January 2022
  • December 2021
  • November 2021

Categories

  • Apollo Answers
  • Course Introductions
  • Economic Intelligence
  • Hide from Wordpress Search
  • Investment Knowledge
  • Perspectives
  • Redirecting
  • The Daily Spark
  • The View from Apollo
  • The Weekly Brief
  • Uncategorized
  • White Papers

AI Adoption Rate Trending Down for Large Companies

The US Census Bureau conducts a biweekly survey of 1.2 million firms, and one question is whether a business has used AI tools such as machine learning, natural language processing, virtual agents or voice recognition to help produce goods or services in the past two weeks. Recent data by firm size shows that AI adoption has been declining among companies with more than 250 employees, see chart below.

The bottom line is that the biweekly Census data is starting to show a slowdown in AI adoption for large companies.

AI adoption rates starting to decline for larger firms
Note: Data is six-survey moving average. The survey is conducted biweekly. Sources: US Census Bureau, Macrobond, Apollo Chief Economist

Download high-res chart

Recent Posts

  • Strong Net Foreign Buying of US Assets
  • Average Tenure of Companies in the S&P 500 Index: 15 Years
  • Fed Pricing Reveals Market Expectations About the AI Adoption Pace
  • After 60/40: In Private Markets, Manager Selection Matters
  • Equity Market Trading Volumes Rising

Recent Comments

No comments to show.

Archives

  • March 2026
  • February 2026
  • January 2026
  • December 2025
  • November 2025
  • October 2025
  • September 2025
  • August 2025
  • July 2025
  • June 2025
  • May 2025
  • April 2025
  • March 2025
  • February 2025
  • January 2025
  • December 2024
  • November 2024
  • October 2024
  • September 2024
  • August 2024
  • July 2024
  • June 2024
  • May 2024
  • April 2024
  • March 2024
  • February 2024
  • January 2024
  • December 2023
  • November 2023
  • October 2023
  • September 2023
  • August 2023
  • July 2023
  • June 2023
  • May 2023
  • April 2023
  • March 2023
  • February 2023
  • January 2023
  • December 2022
  • November 2022
  • October 2022
  • September 2022
  • August 2022
  • July 2022
  • June 2022
  • May 2022
  • April 2022
  • March 2022
  • February 2022
  • January 2022
  • December 2021
  • November 2021

Categories

  • Apollo Answers
  • Course Introductions
  • Economic Intelligence
  • Hide from Wordpress Search
  • Investment Knowledge
  • Perspectives
  • Redirecting
  • The Daily Spark
  • The View from Apollo
  • The Weekly Brief
  • Uncategorized
  • White Papers

Job Growth Negative in Tariff-Impacted Sectors

Splitting employment growth into tariff-impacted sectors and sectors not directly impacted by tariffs shows that the slowdown in job growth is broad-based, and job growth in tariff-impacted sectors is now negative, see chart below.

Job growth negative in tariff-impacted sectors
Note: Sectors impacted by tariffs include manufacturing, mining and logging, construction, wholesales trade, retail trade, transportation and warehousing. Sources: US Bureau of Labor Statistics (BLS), Macrobond, Apollo Chief Economist

Download high-res chart

Recent Posts

  • Strong Net Foreign Buying of US Assets
  • Average Tenure of Companies in the S&P 500 Index: 15 Years
  • Fed Pricing Reveals Market Expectations About the AI Adoption Pace
  • After 60/40: In Private Markets, Manager Selection Matters
  • Equity Market Trading Volumes Rising

Recent Comments

No comments to show.

Archives

  • March 2026
  • February 2026
  • January 2026
  • December 2025
  • November 2025
  • October 2025
  • September 2025
  • August 2025
  • July 2025
  • June 2025
  • May 2025
  • April 2025
  • March 2025
  • February 2025
  • January 2025
  • December 2024
  • November 2024
  • October 2024
  • September 2024
  • August 2024
  • July 2024
  • June 2024
  • May 2024
  • April 2024
  • March 2024
  • February 2024
  • January 2024
  • December 2023
  • November 2023
  • October 2023
  • September 2023
  • August 2023
  • July 2023
  • June 2023
  • May 2023
  • April 2023
  • March 2023
  • February 2023
  • January 2023
  • December 2022
  • November 2022
  • October 2022
  • September 2022
  • August 2022
  • July 2022
  • June 2022
  • May 2022
  • April 2022
  • March 2022
  • February 2022
  • January 2022
  • December 2021
  • November 2021

Categories

  • Apollo Answers
  • Course Introductions
  • Economic Intelligence
  • Hide from Wordpress Search
  • Investment Knowledge
  • Perspectives
  • Redirecting
  • The Daily Spark
  • The View from Apollo
  • The Weekly Brief
  • Uncategorized
  • White Papers

Securitization Is a Key Part of a Modern Financial System

One important reason why growth is structurally lower in Europe is that the European financial system is less developed.

Importantly, securitization accounts for 50% of GDP in the US and 7% in Europe, see also here.

Securitization lowers the costs of borrowing for consumers and firms, enhances credit availability, distributes risk and creates new investment opportunities for investors.

The bottom line is that expanding the securitization market in Europe would unlock significant GDP growth and benefit European consumers, firms and retirees.

For more discussion, see here and here.

Securitization: Europe still far behind the US
Note: US is the sum of ABS and agency and nonagency MBS. Europe includes EU, UK and Switzerland. Sources: SIFMA, AFME, Apollo Chief Economist

Download high-res chart

Recent Posts

  • Strong Net Foreign Buying of US Assets
  • Average Tenure of Companies in the S&P 500 Index: 15 Years
  • Fed Pricing Reveals Market Expectations About the AI Adoption Pace
  • After 60/40: In Private Markets, Manager Selection Matters
  • Equity Market Trading Volumes Rising

Recent Comments

No comments to show.

Archives

  • March 2026
  • February 2026
  • January 2026
  • December 2025
  • November 2025
  • October 2025
  • September 2025
  • August 2025
  • July 2025
  • June 2025
  • May 2025
  • April 2025
  • March 2025
  • February 2025
  • January 2025
  • December 2024
  • November 2024
  • October 2024
  • September 2024
  • August 2024
  • July 2024
  • June 2024
  • May 2024
  • April 2024
  • March 2024
  • February 2024
  • January 2024
  • December 2023
  • November 2023
  • October 2023
  • September 2023
  • August 2023
  • July 2023
  • June 2023
  • May 2023
  • April 2023
  • March 2023
  • February 2023
  • January 2023
  • December 2022
  • November 2022
  • October 2022
  • September 2022
  • August 2022
  • July 2022
  • June 2022
  • May 2022
  • April 2022
  • March 2022
  • February 2022
  • January 2022
  • December 2021
  • November 2021

Categories

  • Apollo Answers
  • Course Introductions
  • Economic Intelligence
  • Hide from Wordpress Search
  • Investment Knowledge
  • Perspectives
  • Redirecting
  • The Daily Spark
  • The View from Apollo
  • The Weekly Brief
  • Uncategorized
  • White Papers

US Housing Outlook

Demand for housing is slowing because of high home prices, high mortgage rates and declining immigration, see charts below.

Housing supply is steady because existing homeowners are reluctant to sell their homes, since they’re locked into lower mortgage rates and don’t want to take on higher ones. Housing supply of new homes is rising, see again charts below.

The bottom line is that there is downward pressure on home prices coming from falling demand and rising supply.

Traffic of prospective homebuyers
Sources: National Association of Home Builders, Macrobond, Apollo Chief Economist
Monthly mortgage payment on a new mortgage: $2,813
Note: Calculation of monthly payment using the 30-year purchase loan application size and the 30-year effective rate. Sources: Bloomberg L.P., Apollo Chief Economist
Homebuyer and homebuilder confidence lower because of affordability
Sources: University of Michigan, National Association of Home Builders, Macrobond, Apollo Chief Economist
Household formation slowing down
Note: Household formation estimates for 2025 and 2026 are based on projected natural population growth and legal immigration. We assume unauthorized immigration drops to zero under potential Trump policy scenario. To reflect this, we use natural population growth plus 65% total net migration—based on CBO estimates and Migration Policy Institute’s estimates of 0.9 million rise in unauthorized immigrants in 2023—divided by the average US household size. Sources: Census Bureau, Haver, Apollo Chief Economist
International homebuyers
Note: Based on transactions in the 12 months ending March of each year. Sources: National Association of Realtors (NAR), Apollo Chief Economist
Total housing inventory per person is very low
Sources: US Census Bureau, Macrobond, Apollo Chief Economist
New and existing home sales lower than normal because of affordability and low inventory
Sources: NAR, US Census Bureau, Macrobond, Apollo Chief Economist
New homes supply indicates slower market turnover
Sources: US Census Bureau, Macrobond, Apollo Chief Economist

Download high-res chart book

Recent Posts

  • Strong Net Foreign Buying of US Assets
  • Average Tenure of Companies in the S&P 500 Index: 15 Years
  • Fed Pricing Reveals Market Expectations About the AI Adoption Pace
  • After 60/40: In Private Markets, Manager Selection Matters
  • Equity Market Trading Volumes Rising

Recent Comments

No comments to show.

Archives

  • March 2026
  • February 2026
  • January 2026
  • December 2025
  • November 2025
  • October 2025
  • September 2025
  • August 2025
  • July 2025
  • June 2025
  • May 2025
  • April 2025
  • March 2025
  • February 2025
  • January 2025
  • December 2024
  • November 2024
  • October 2024
  • September 2024
  • August 2024
  • July 2024
  • June 2024
  • May 2024
  • April 2024
  • March 2024
  • February 2024
  • January 2024
  • December 2023
  • November 2023
  • October 2023
  • September 2023
  • August 2023
  • July 2023
  • June 2023
  • May 2023
  • April 2023
  • March 2023
  • February 2023
  • January 2023
  • December 2022
  • November 2022
  • October 2022
  • September 2022
  • August 2022
  • July 2022
  • June 2022
  • May 2022
  • April 2022
  • March 2022
  • February 2022
  • January 2022
  • December 2021
  • November 2021

Categories

  • Apollo Answers
  • Course Introductions
  • Economic Intelligence
  • Hide from Wordpress Search
  • Investment Knowledge
  • Perspectives
  • Redirecting
  • The Daily Spark
  • The View from Apollo
  • The Weekly Brief
  • Uncategorized
  • White Papers

Downside Risks to Job Growth Over the Coming Months

Sentiment indicators for consumers and firms are pointing to a weaker employment report for August.

First, consumer sentiment about the outlook for the labor market has historically been a leading indicator for job growth. Using the historical relationship to predict the August employment report suggests that nonfarm payrolls on Friday could come in lower than the 90,000 expected by the consensus, see the first chart below.

Second, small businesses saying that they are experiencing poor sales has also been a leading indicator for the unemployment rate, and the current reading suggests the unemployment rate could rise over the coming months, see the second chart.

The bottom line is that sentiment indicators are suggesting that the labor market will continue to weaken.

Downside risks to nonfarm payrolls over the coming months
Note: University of Michigan’s expected change in unemployment during the next year August numbers are preliminary estimates. Sources: US Bureau of Labor Statistics (BLS), University of Michigan, Macrobond, Apollo Chief Economist
Upside risks to the unemployment rate over the coming months
Sources: National Federation of Independent Business, US Bureau of Labor Statistics (BLS), Macrobond, Apollo Chief Economist

Download high-res charts

Recent Posts

  • Strong Net Foreign Buying of US Assets
  • Average Tenure of Companies in the S&P 500 Index: 15 Years
  • Fed Pricing Reveals Market Expectations About the AI Adoption Pace
  • After 60/40: In Private Markets, Manager Selection Matters
  • Equity Market Trading Volumes Rising

Recent Comments

No comments to show.

Archives

  • March 2026
  • February 2026
  • January 2026
  • December 2025
  • November 2025
  • October 2025
  • September 2025
  • August 2025
  • July 2025
  • June 2025
  • May 2025
  • April 2025
  • March 2025
  • February 2025
  • January 2025
  • December 2024
  • November 2024
  • October 2024
  • September 2024
  • August 2024
  • July 2024
  • June 2024
  • May 2024
  • April 2024
  • March 2024
  • February 2024
  • January 2024
  • December 2023
  • November 2023
  • October 2023
  • September 2023
  • August 2023
  • July 2023
  • June 2023
  • May 2023
  • April 2023
  • March 2023
  • February 2023
  • January 2023
  • December 2022
  • November 2022
  • October 2022
  • September 2022
  • August 2022
  • July 2022
  • June 2022
  • May 2022
  • April 2022
  • March 2022
  • February 2022
  • January 2022
  • December 2021
  • November 2021

Categories

  • Apollo Answers
  • Course Introductions
  • Economic Intelligence
  • Hide from Wordpress Search
  • Investment Knowledge
  • Perspectives
  • Redirecting
  • The Daily Spark
  • The View from Apollo
  • The Weekly Brief
  • Uncategorized
  • White Papers

Posts navigation

←Previous page Page 1 Page 2 Page 3 Page 4 Next page→
  • Privacy Notice
  • Terms of Use
  • Forward-Looking Statements
Apollo
© Apollo Global Management, Inc. All Rights Reserved.

The Apollo Academy is for informational and educational purposes only and nothing contained herein should be taken as investment advice or a recommendation to enter into any transaction. They are not an invitation by or on behalf of Apollo to any person to buy or sell any security or to adopt any investment strategy, and shall not form the basis of, nor may it accompany nor form part of, any right or contract to buy or sell any security or to adopt any investment strategy. There is no guarantee that the views and opinions expressed in this website will come to pass. For additional information, please see the disclaimers included in each piece of content or the legal page of our website here.