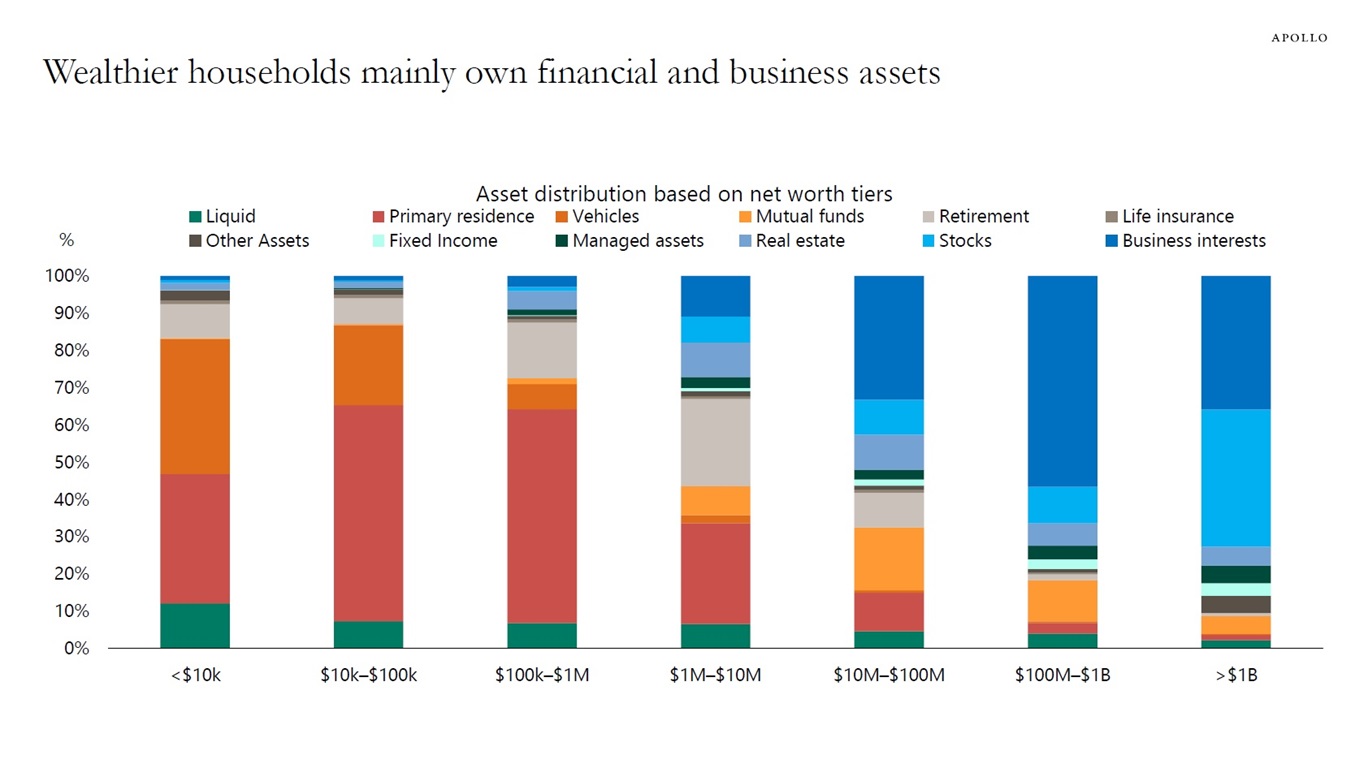
The chart below shows what types of assets households own across the wealth distribution.
Households with lower asset holdings mainly own their home and their car. Wealthier households mainly own business assets and stocks.


The chart below shows what types of assets households own across the wealth distribution.
Households with lower asset holdings mainly own their home and their car. Wealthier households mainly own business assets and stocks.
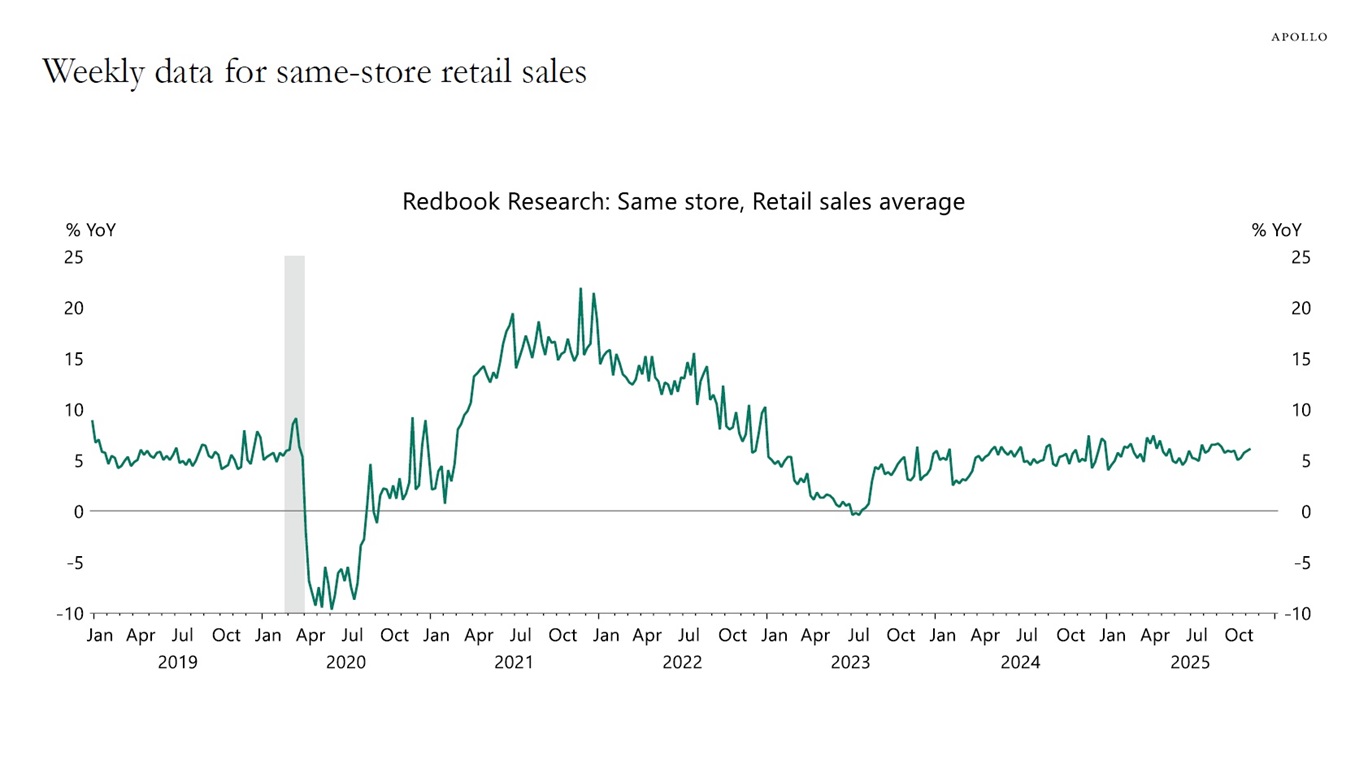
The weekly data for US consumer spending continues to show solid growth in private consumption, see chart below.
In other words, there is no need for the Fed to cut rates to boost consumer spending.
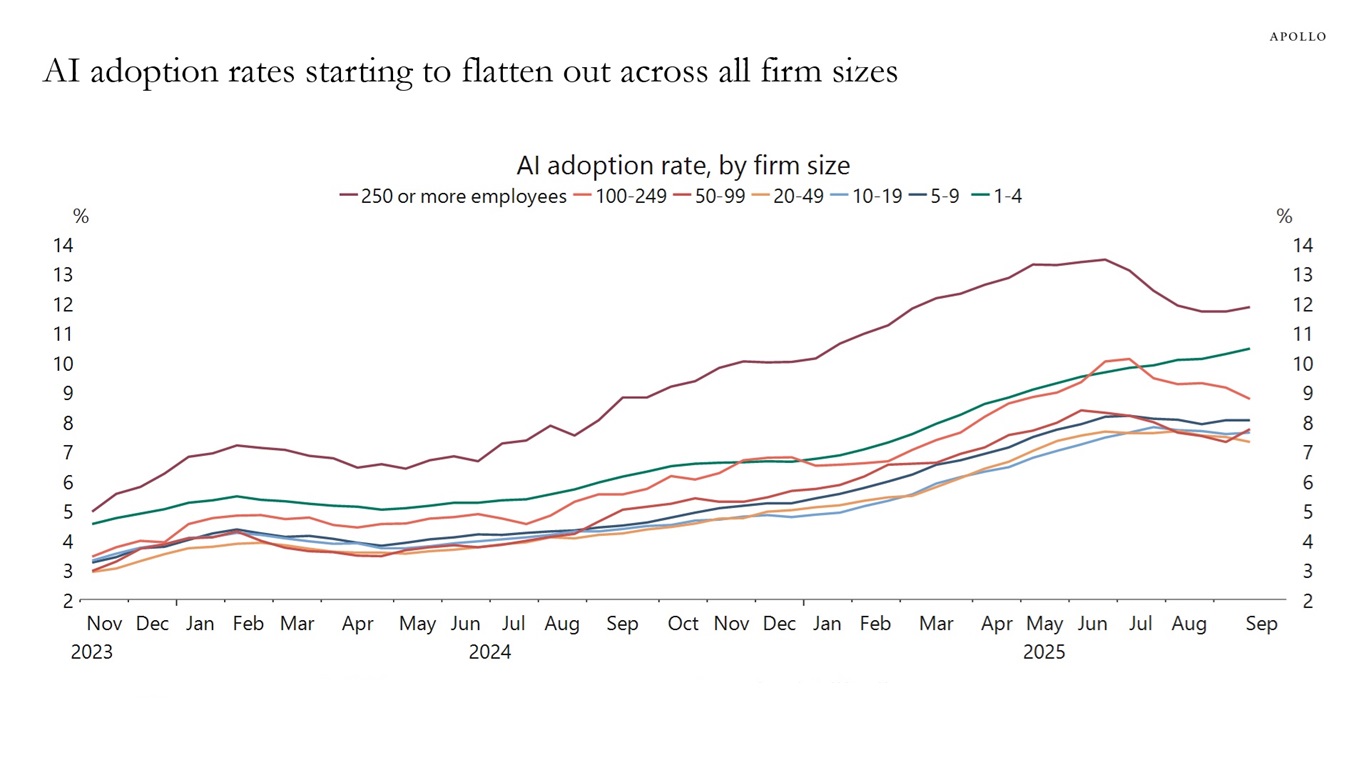
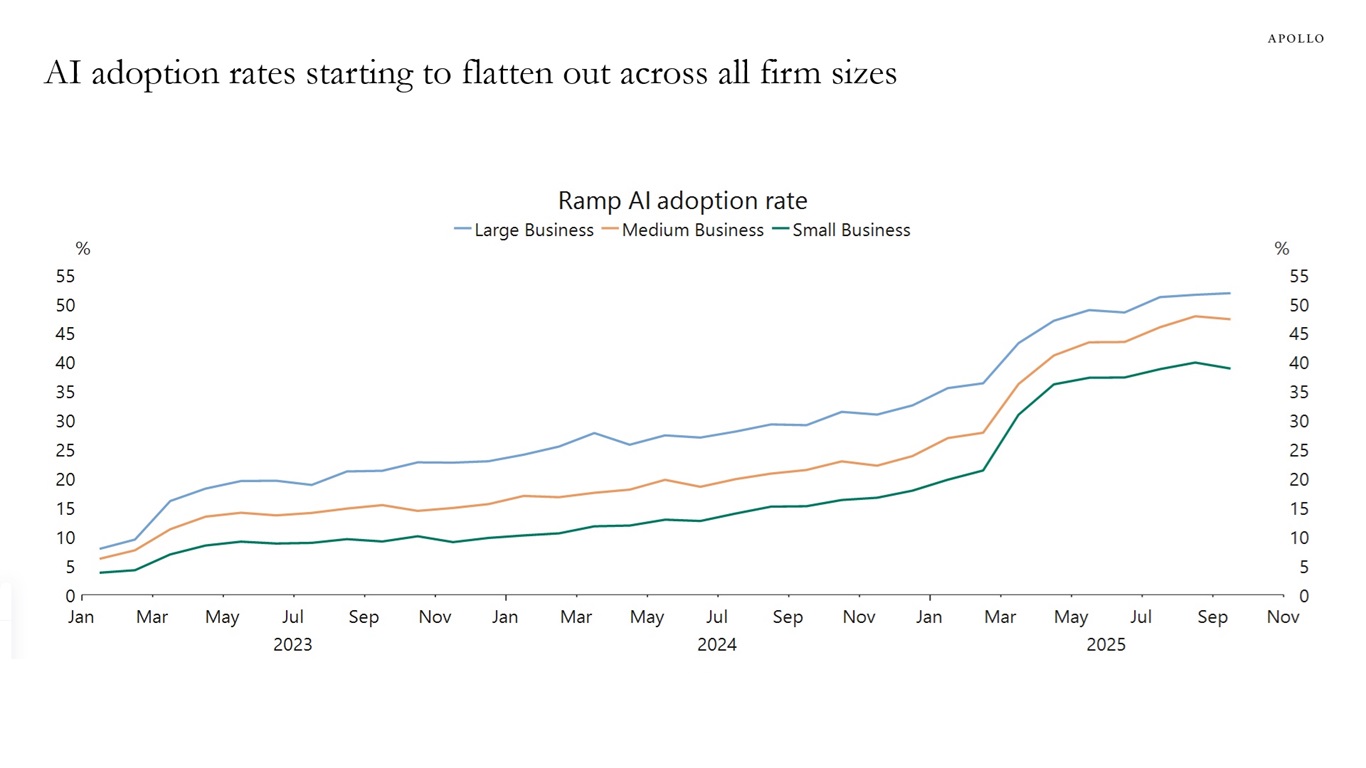
Data from the Census Bureau and Ramp shows that AI adoption rates are starting to flatten out across all firm sizes, see charts below.
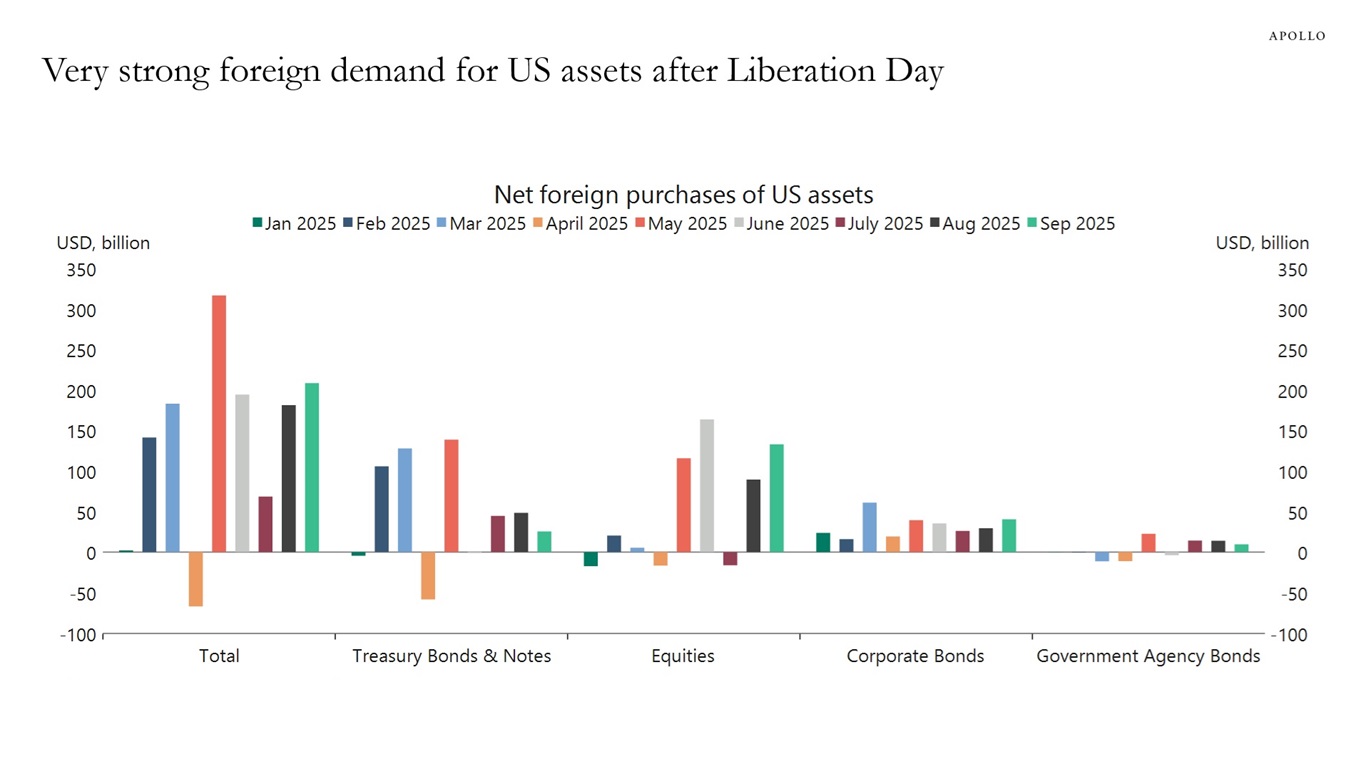
The chart below shows that foreigners come to the US to earn higher yields and invest in AI.
Since Liberation Day, foreign appetite for US assets has been robust. This is the reason why the US dollar has been trending higher over the past six months.
The chart below shows that since May, foreigners have been strong buyers of AI and US fixed income, including credit.
With rates higher for longer and the AI story continuing, foreign demand for US assets will remain strong.
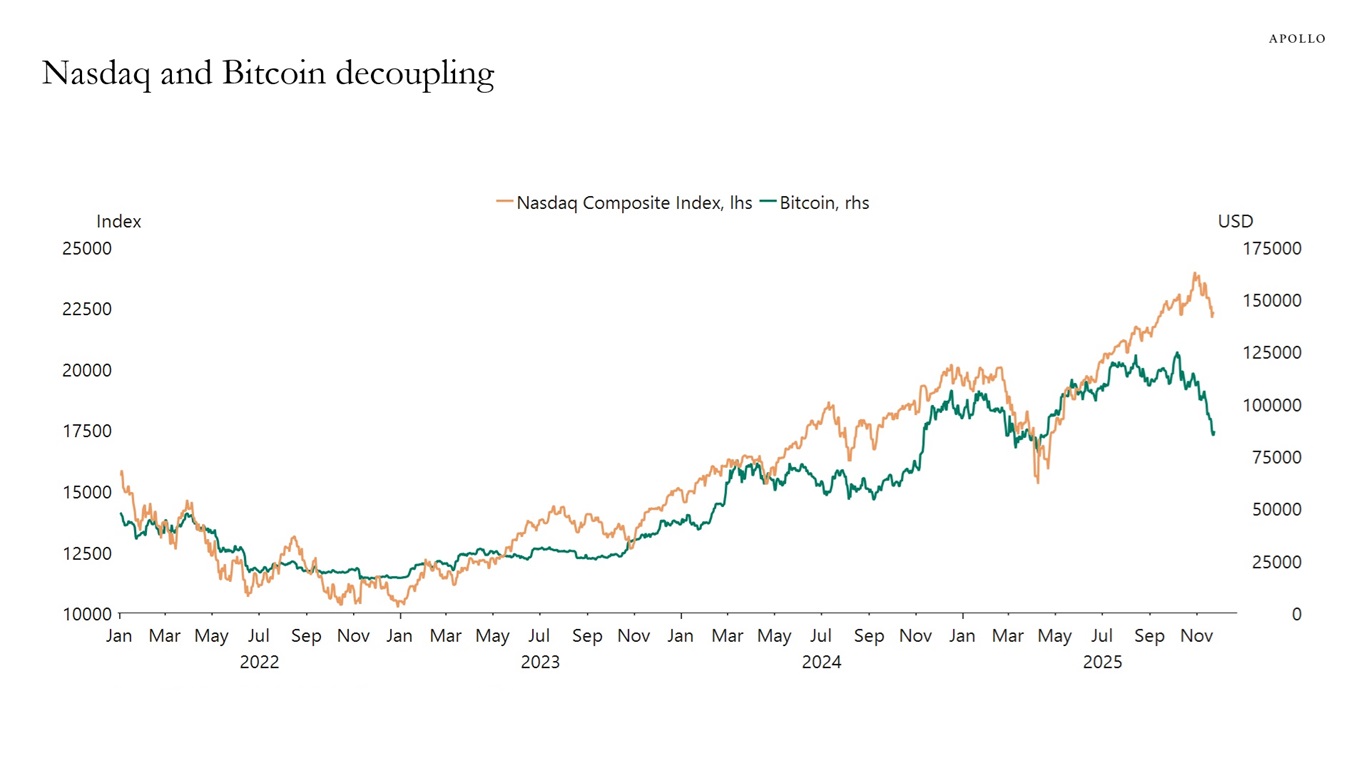
Bitcoin and the Nasdaq Composite are normally highly correlated, but that correlation has broken down in recent weeks with a much sharper drop in the price of Bitcoin, see chart below.
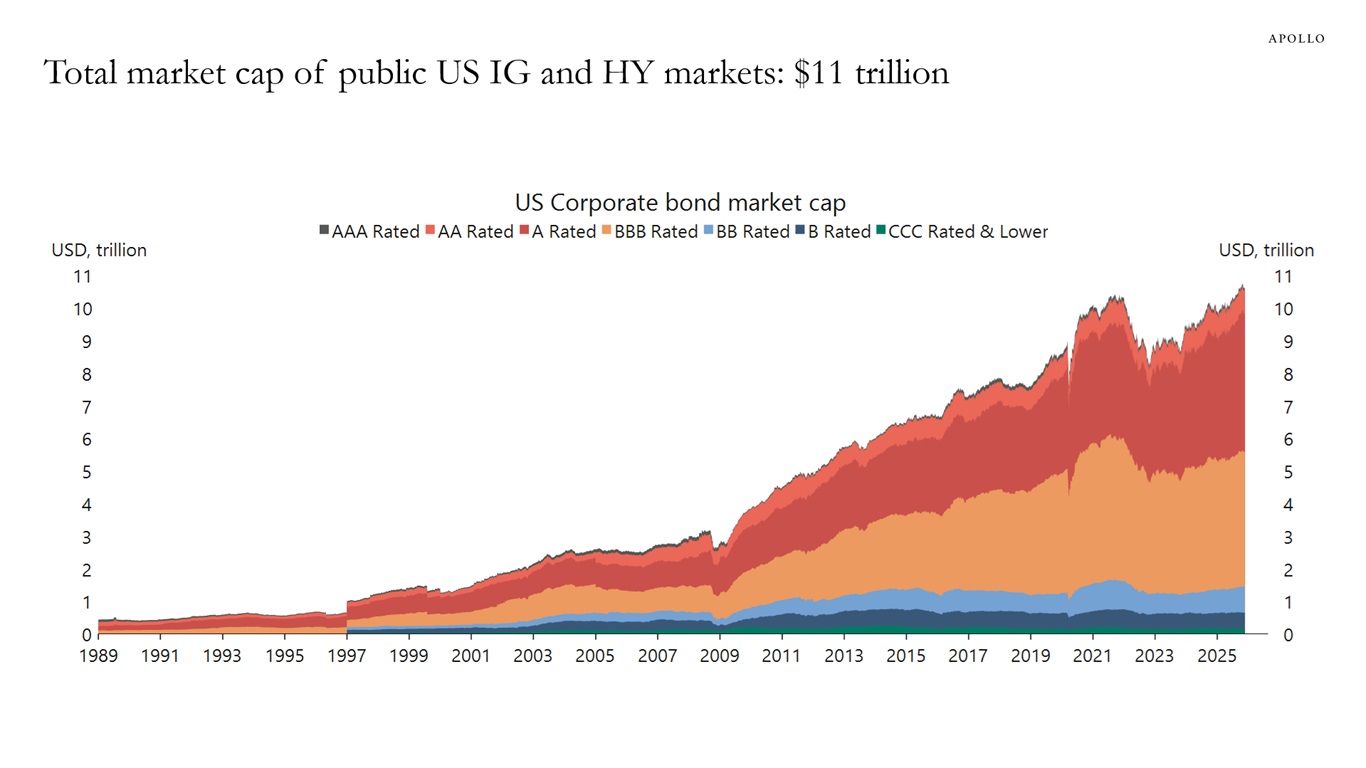
Since 2009, the total amount of public IG and HY bonds outstanding has grown from $3 trillion to $11 trillion, see chart below. Most of the growth has been in BBB and A-rated corporate bonds, and those two ratings combined now account for 79% of all corporate bonds outstanding by market value.
These numbers have to be compared with the roughly $2 trillion outstanding in private credit, up from $1.2 trillion in 2009.
The bottom line is that public credit markets have grown much faster than private credit markets both in percent and in dollars.

In this episode of The View from Apollo, Apollo’s Antoine Munfakh and Bryn Gostin take a deeper dive into the state of private equity in a changing market environment. They discuss what’s driving dispersion across managers, why fundamentals and operational depth have regained prominence and how disciplined investing is shaping outcomes today and in years to come by focusing on “alpha on the buy, the build and the exit.”
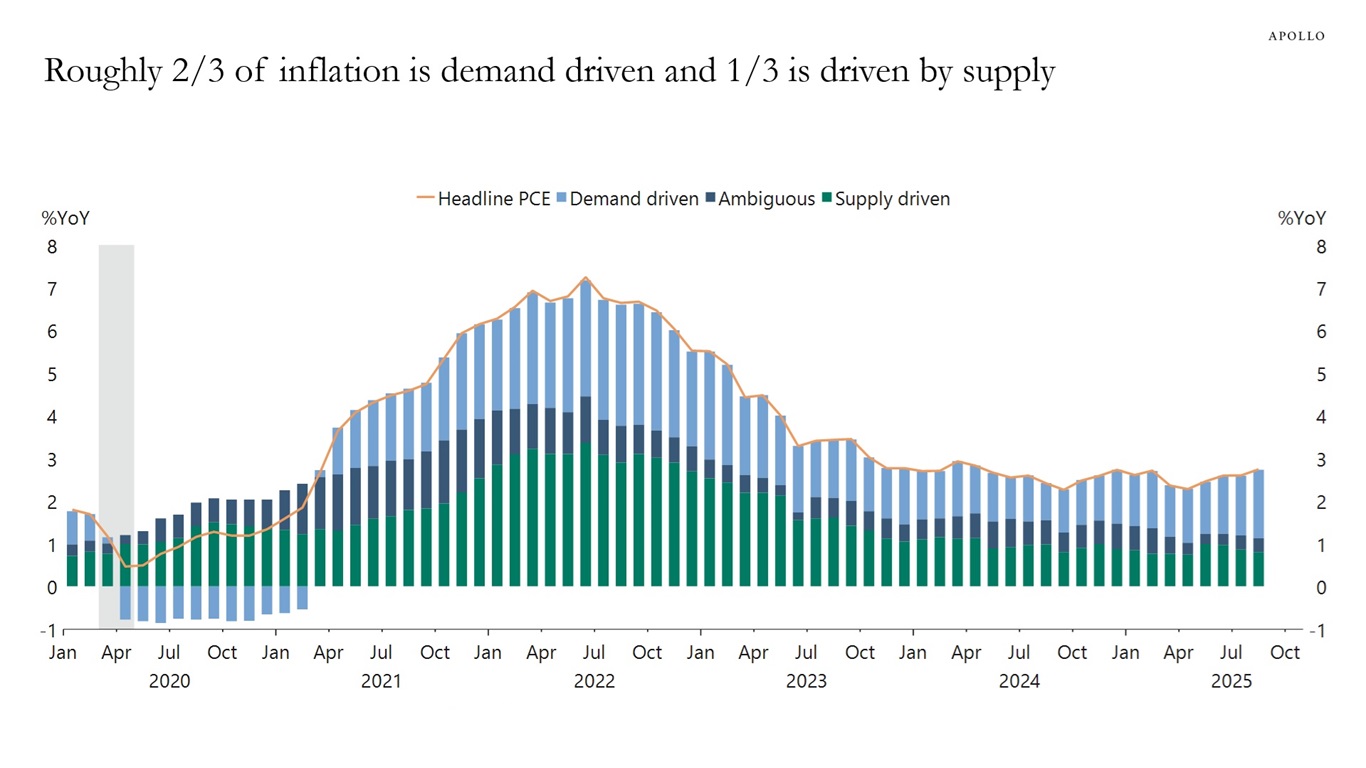
The debate over the Federal Reserve’s policy trajectory hinges on the underlying drivers of inflation. A decomposition by the San Francisco Fed reveals that the current inflationary environment is largely a demand-side story, with strong economic activity accounting for the majority of price growth. This has direct implications for monetary policy: as long as demand-pull inflation keeps the headline rate above the 2% target, a higher-for-longer interest rate stance is required to bring the economy back into balance.
Conversely, if inflation were primarily a function of supply shocks, the case for demand destruction via high rates would be moot, likely creating space for policy easing. Ultimately, the source of inflation is the critical variable determining the need for further Fed action.
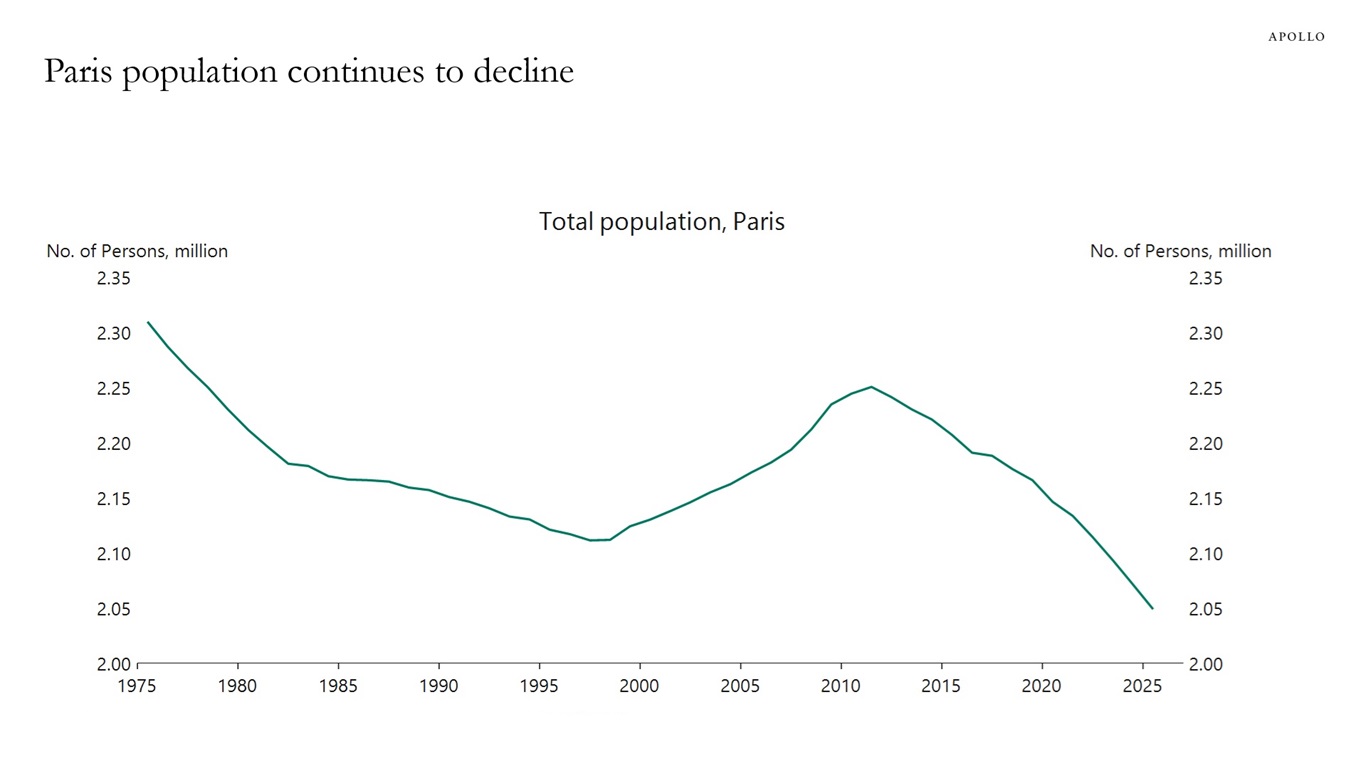
The number of people living in Paris continues to decline. This trend is driven by several factors, including affordability, limited new construction, the proliferation of short-term rentals, the conversion of residential units into office space, and the rise of second homes often owned by international buyers, see chart below.
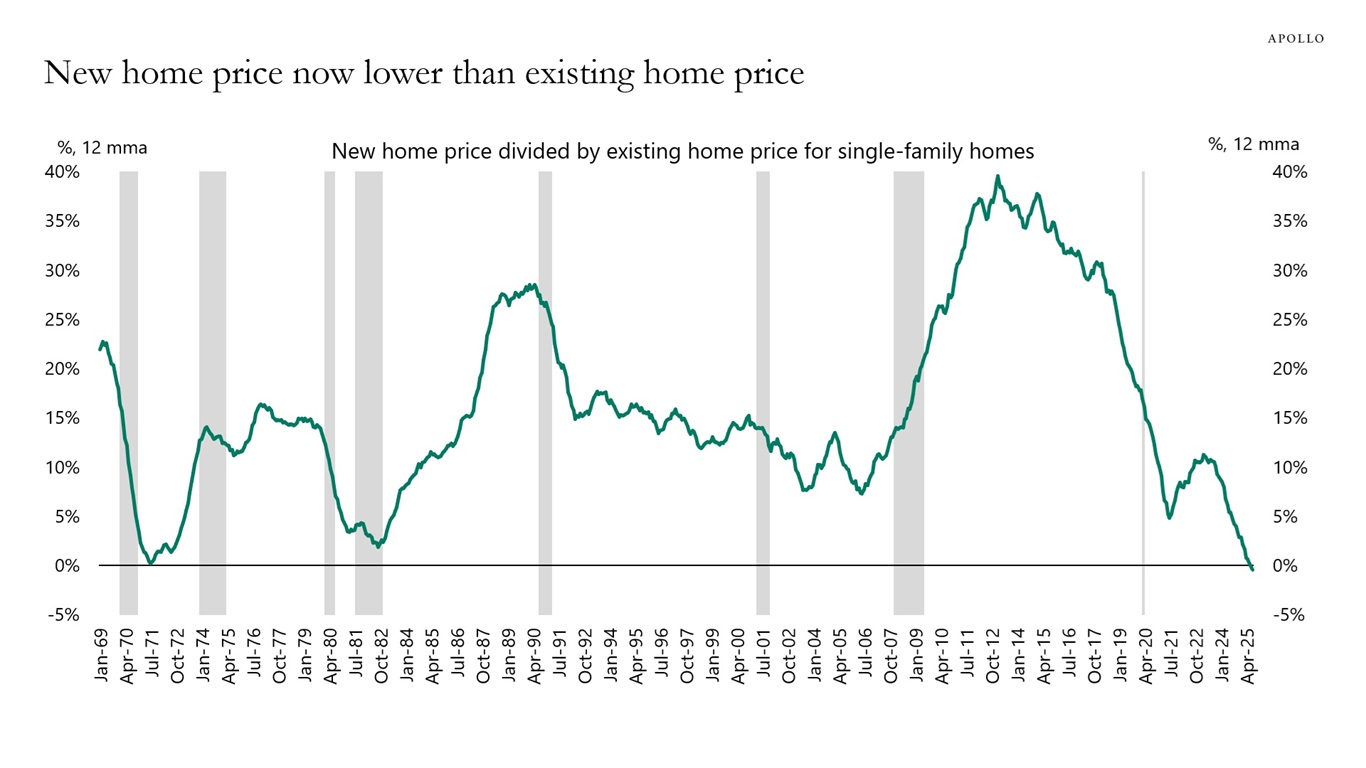
For the first time in more than 50 years, the price of a new single-family home is lower than the average price of an existing single-family home, see chart below.
The downward pressure on new home prices is driven by homebuilders producing smaller homes and providing incentives to homebuyers in a market where affordability is a challenge.
The upward pressure on existing home prices is driven by low inventory as many current homeowners are reluctant to sell because they have locked in low mortgage rates from previous years.