• Apollo.com
  • Login
  • Register Now
light site-logo
  • The Academy
  • Upcoming Events
        • Upcoming Events

  • Learning Center
        • New & UpdatedAlternative Investing Course 2.0

        • Alternative Investing Essentials Part OnePrivate Equity, Venture Capital, Private Credit
        • Alternative Investing Essentials Part TwoReal Estate, Infrastructure, Digital Assets, Hedge Funds
        • Practical ConsiderationsAsset Allocation, Risk Considerations, Fund Structures, Fees
        • Introductory Videos

          View All Videos

        •  Recent Classes & Videos

        • • The Evolution of DC Portfolios: Rethinking Income, Risk and Diversification
        • • 2026 Outlook
        • • Private Equity’s Edge: Delivering Alpha in a Changing Market
        • • Powering Innovation: Infrastructure Investing Across the AI Value Chain
        • • Mid-Year Outlook: At the Crossroads of Stagflation — What’s Next?
        • • Hybrid Investments: Flexible Structures for Volatile Times
        • • Private Credit Investing in Volatile Times
        • View All Classes

  • Alternative Perspectives
        • Investment Knowledge
        • The View from Apollo
          • Investment Knowledge

            A Reset in Software — And Why Discipline Always Matters

            March 31, 2026
          • The View From Apollo

            Private Equity Portfolios: Three Key Dimensions of Diversification

            March 31, 2026
          • Investment Knowledge White Papers

            Why Real Estate in 2026?

            March 17, 2026
  • The Daily Spark
  • Register for Apollo Academy: Alternative Investing Course
  • Login
  • About Apollo Academy
  • Upcoming Events
  • Learning Center
  • Alternative Perspectives
  • The Daily Spark
  • Register for Apollo Academy: Alternative Investing Course
  • Login
  • Alternative Investing Course 2.0
  • 2026 Outlook
  • Private Equity’s Edge: Delivering Alpha in a Changing Market
  • Powering Innovation: Infrastructure Investing Across the AI Value Chain
  • Mid-Year Outlook: At the Crossroads of Stagflation — What’s Next?
  • Hybrid Investments: Flexible Structures for Volatile Times
  • Private Credit Investing in Volatile Times
  • View All Classes
  • Introductory Videos
  • Alternative Investing Essentials Part One • Now Available On Demand
  • Alternative Investing Essentials Part Two • Now Available On Demand
  • Practical Considerations • Now Available On Demand
  • Investment Knowledge
  • The View from Apollo
Home March 2026

No Signs of AI Replacing Offshore Workers

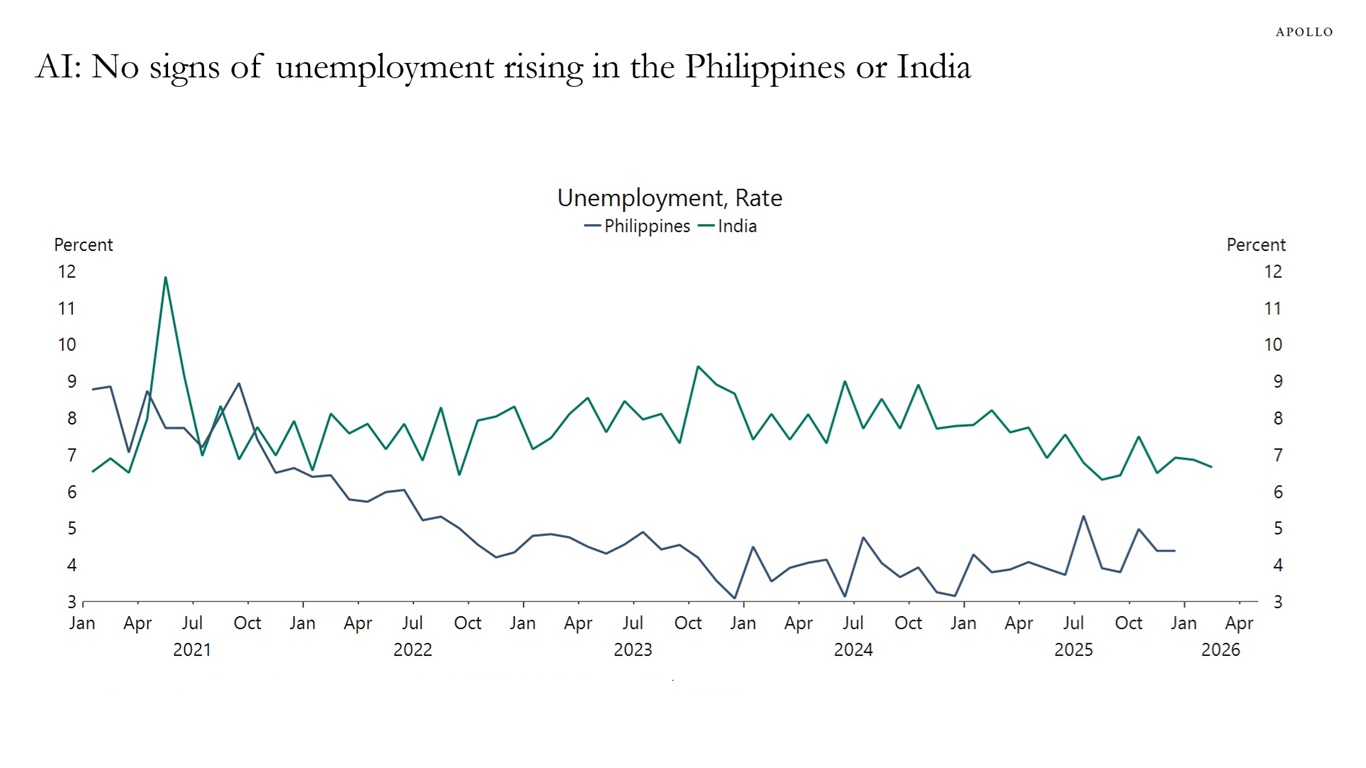
We are monitoring the unemployment rate in the Philippines and India for any signs that AI is reducing the need for outsourced workers in corporate America. So far, there are no signs of AI replacing offshore workers, see chart below.

AI: No signs of unemployment rising in the Philippines or India
Sources: Centre for Monitoring Indian Economy Pvt. Ltd. (CMIE), Philippine Statistics Authority, Macrobond, Apollo Chief Economist

Download high-res chart

Recent Posts

  • Understanding the Rise and Recent Fall in Gold Prices
  • Outlook for Public and Private Markets
  • $20 Bills Falling, $100 Bills Rising
  • 3% vs. 60%
  • Factors Driving Job Losses in Software

Recent Comments

No comments to show.

Archives

  • April 2026
  • March 2026
  • February 2026
  • January 2026
  • December 2025
  • November 2025
  • October 2025
  • September 2025
  • August 2025
  • July 2025
  • June 2025
  • May 2025
  • April 2025
  • March 2025
  • February 2025
  • January 2025
  • December 2024
  • November 2024
  • October 2024
  • September 2024
  • August 2024
  • July 2024
  • June 2024
  • May 2024
  • April 2024
  • March 2024
  • February 2024
  • January 2024
  • December 2023
  • November 2023
  • October 2023
  • September 2023
  • August 2023
  • July 2023
  • June 2023
  • May 2023
  • April 2023
  • March 2023
  • February 2023
  • January 2023
  • December 2022
  • November 2022
  • October 2022
  • September 2022
  • August 2022
  • July 2022
  • June 2022
  • May 2022
  • April 2022
  • March 2022
  • February 2022
  • January 2022
  • December 2021
  • November 2021

Categories

  • Apollo Answers
  • Course Introductions
  • Economic Intelligence
  • Hide from Wordpress Search
  • Investment Knowledge
  • Perspectives
  • Redirecting
  • The Daily Spark
  • The View from Apollo
  • The Weekly Brief
  • Uncategorized
  • White Papers

What Happened to “Sell America?”

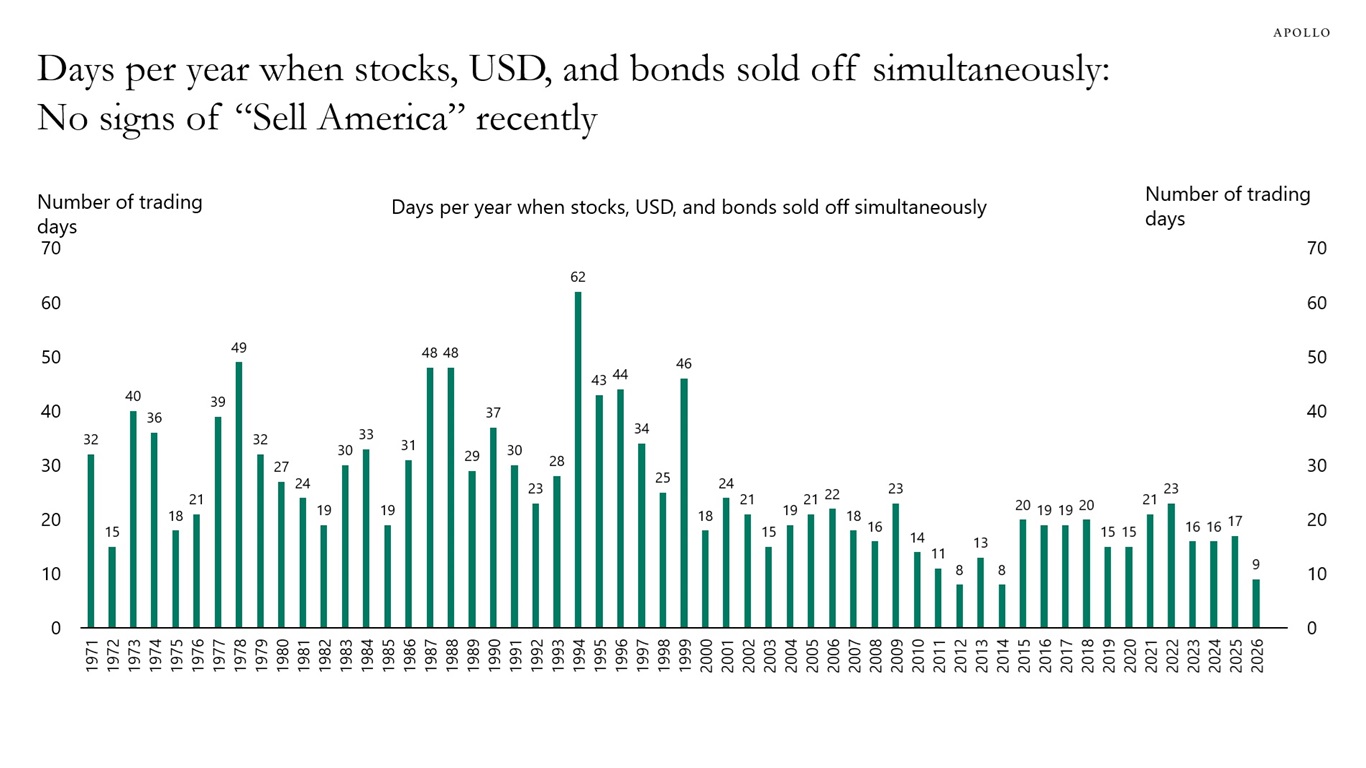
There are a lot of conversations in markets about the “Sell America” trade, i.e. the trade in which prices of US stocks, bonds and the dollar fall at the same time. But counting the number of days when this has happened shows no signs of 2025 and 2026 being anything special. In fact, the chart below shows that there has been no particular “Sell America” trade for the past 25 years.

The bottom line is that the US remains the most dynamic and innovative economy in the world, delivering the best and most steady returns for domestic and global investors.

Days per year when stocks, USD, and bonds sold off simultaneously: No signs of “Sell America” recently
Note: 2026 data is annualized. Sources: Bloomberg, Apollo Chief Economist

Download high-res chart

Recent Posts

  • Understanding the Rise and Recent Fall in Gold Prices
  • Outlook for Public and Private Markets
  • $20 Bills Falling, $100 Bills Rising
  • 3% vs. 60%
  • Factors Driving Job Losses in Software

Recent Comments

No comments to show.

Archives

  • April 2026
  • March 2026
  • February 2026
  • January 2026
  • December 2025
  • November 2025
  • October 2025
  • September 2025
  • August 2025
  • July 2025
  • June 2025
  • May 2025
  • April 2025
  • March 2025
  • February 2025
  • January 2025
  • December 2024
  • November 2024
  • October 2024
  • September 2024
  • August 2024
  • July 2024
  • June 2024
  • May 2024
  • April 2024
  • March 2024
  • February 2024
  • January 2024
  • December 2023
  • November 2023
  • October 2023
  • September 2023
  • August 2023
  • July 2023
  • June 2023
  • May 2023
  • April 2023
  • March 2023
  • February 2023
  • January 2023
  • December 2022
  • November 2022
  • October 2022
  • September 2022
  • August 2022
  • July 2022
  • June 2022
  • May 2022
  • April 2022
  • March 2022
  • February 2022
  • January 2022
  • December 2021
  • November 2021

Categories

  • Apollo Answers
  • Course Introductions
  • Economic Intelligence
  • Hide from Wordpress Search
  • Investment Knowledge
  • Perspectives
  • Redirecting
  • The Daily Spark
  • The View from Apollo
  • The Weekly Brief
  • Uncategorized
  • White Papers

Iran: Short-Term Volatility vs. Long-Term Stability

Markets are too focused on the near-term challenges from higher oil prices, see chart below. The real trade-off for investors is 4 to 6 weeks of instability, paying off 50 years of stability in oil markets, supply chains and geopolitics. The Gulf region will be more stable and even more closely integrated with the global economy. For the Fed, the rise in inflation because of higher oil prices is temporary, and once the conflict is over, Fed cuts will be priced in again and long rates will come down again. 

Rise in short-term volatility
Sources: Bloomberg, Macrobond, Apollo Chief Economist

Download high-res chart

Recent Posts

  • Understanding the Rise and Recent Fall in Gold Prices
  • Outlook for Public and Private Markets
  • $20 Bills Falling, $100 Bills Rising
  • 3% vs. 60%
  • Factors Driving Job Losses in Software

Recent Comments

No comments to show.

Archives

  • April 2026
  • March 2026
  • February 2026
  • January 2026
  • December 2025
  • November 2025
  • October 2025
  • September 2025
  • August 2025
  • July 2025
  • June 2025
  • May 2025
  • April 2025
  • March 2025
  • February 2025
  • January 2025
  • December 2024
  • November 2024
  • October 2024
  • September 2024
  • August 2024
  • July 2024
  • June 2024
  • May 2024
  • April 2024
  • March 2024
  • February 2024
  • January 2024
  • December 2023
  • November 2023
  • October 2023
  • September 2023
  • August 2023
  • July 2023
  • June 2023
  • May 2023
  • April 2023
  • March 2023
  • February 2023
  • January 2023
  • December 2022
  • November 2022
  • October 2022
  • September 2022
  • August 2022
  • July 2022
  • June 2022
  • May 2022
  • April 2022
  • March 2022
  • February 2022
  • January 2022
  • December 2021
  • November 2021

Categories

  • Apollo Answers
  • Course Introductions
  • Economic Intelligence
  • Hide from Wordpress Search
  • Investment Knowledge
  • Perspectives
  • Redirecting
  • The Daily Spark
  • The View from Apollo
  • The Weekly Brief
  • Uncategorized
  • White Papers

Distress in Software Is Not a Macro Problem

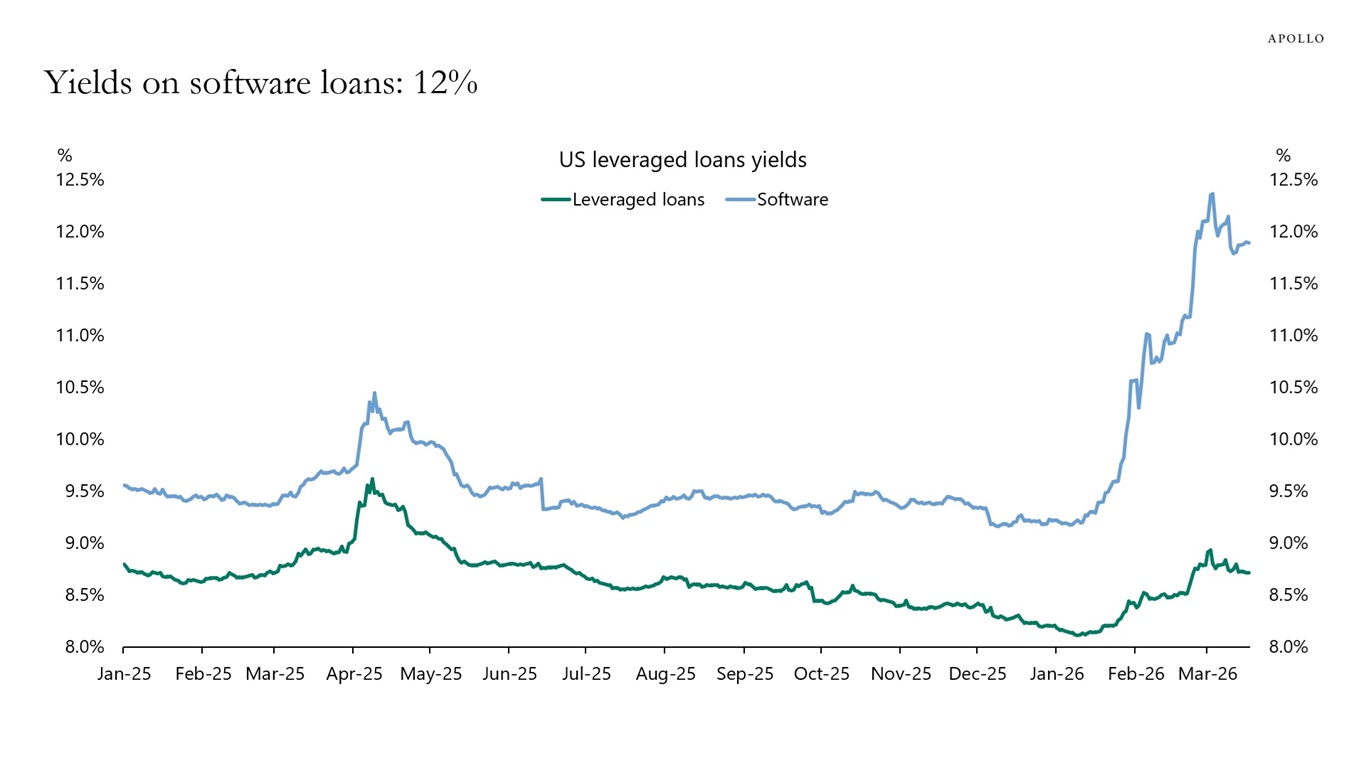
While the yield on software loans has increased significantly, yields on loans more generally have actually been going down, see chart below.

This suggests that the distress in software is largely idiosyncratic, rather than driven by a broad-based macro deterioration in credit conditions.

Yields on software loans: 12%
Sources: PitchBook, Apollo Chief Economist

Download high-res chart

Recent Posts

  • Understanding the Rise and Recent Fall in Gold Prices
  • Outlook for Public and Private Markets
  • $20 Bills Falling, $100 Bills Rising
  • 3% vs. 60%
  • Factors Driving Job Losses in Software

Recent Comments

No comments to show.

Archives

  • April 2026
  • March 2026
  • February 2026
  • January 2026
  • December 2025
  • November 2025
  • October 2025
  • September 2025
  • August 2025
  • July 2025
  • June 2025
  • May 2025
  • April 2025
  • March 2025
  • February 2025
  • January 2025
  • December 2024
  • November 2024
  • October 2024
  • September 2024
  • August 2024
  • July 2024
  • June 2024
  • May 2024
  • April 2024
  • March 2024
  • February 2024
  • January 2024
  • December 2023
  • November 2023
  • October 2023
  • September 2023
  • August 2023
  • July 2023
  • June 2023
  • May 2023
  • April 2023
  • March 2023
  • February 2023
  • January 2023
  • December 2022
  • November 2022
  • October 2022
  • September 2022
  • August 2022
  • July 2022
  • June 2022
  • May 2022
  • April 2022
  • March 2022
  • February 2022
  • January 2022
  • December 2021
  • November 2021

Categories

  • Apollo Answers
  • Course Introductions
  • Economic Intelligence
  • Hide from Wordpress Search
  • Investment Knowledge
  • Perspectives
  • Redirecting
  • The Daily Spark
  • The View from Apollo
  • The Weekly Brief
  • Uncategorized
  • White Papers

Monetary Policy Transmission Mechanism Not Working for Data Centers

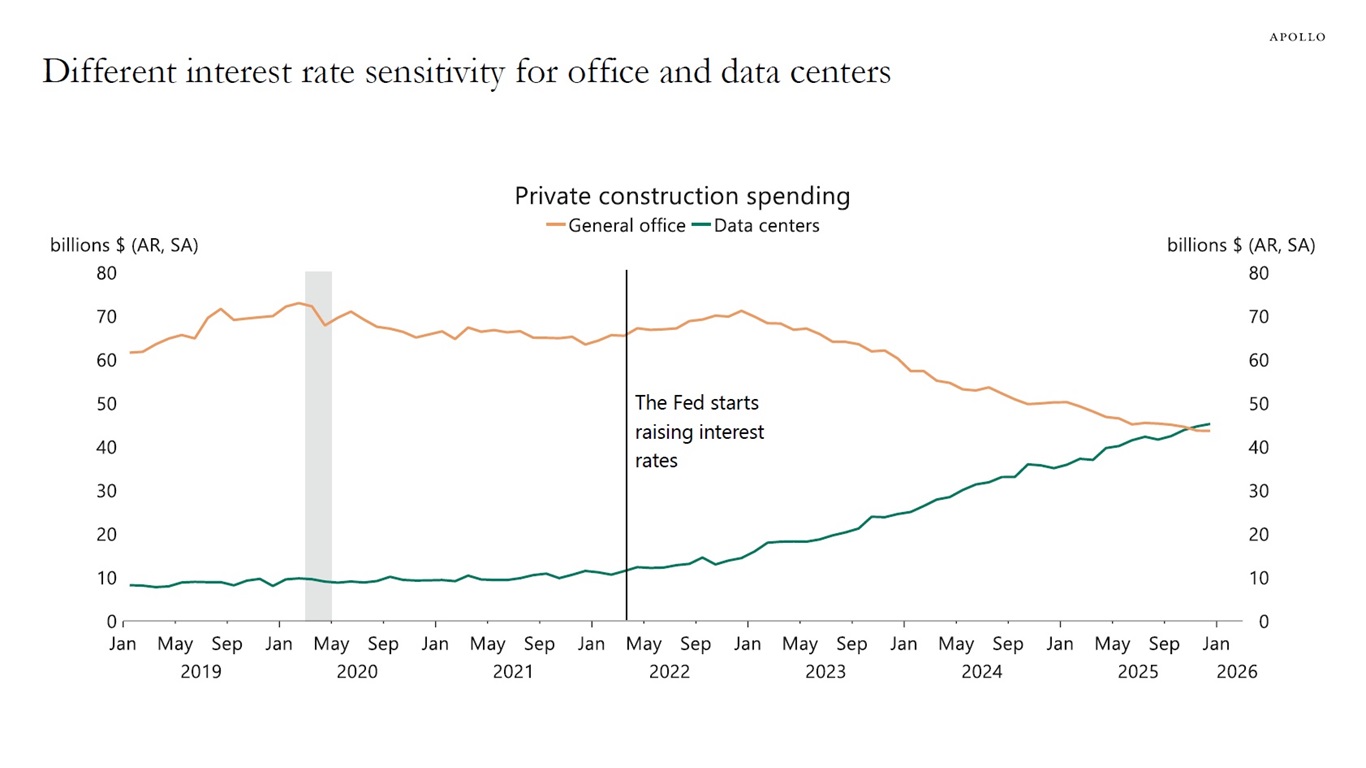
When the Fed began hiking in 2022, traditional rate-sensitive sectors like office construction rolled over quickly. But data center construction continued to surge, as investors and hyperscalers judged that AI-driven returns would exceed the higher cost of capital.

In effect, one of the traditional channels through which monetary tightening slows activity, a pullback in commercial construction, has been partially offset by structurally strong demand for digital infrastructure.

High expected returns and strategic capacity needs in data centers help explain why tighter monetary policy has cooled the economy less than in past cycles.

Combined with the positive growth impulse from the One Big Beautiful Bill, we expect economic growth to remain firm through 2026.

Different interest rate sensitivity for office and data centers
Sources: US Census Bureau, Macrobond, Apollo Chief Economist

Download high-res chart

Recent Posts

  • Understanding the Rise and Recent Fall in Gold Prices
  • Outlook for Public and Private Markets
  • $20 Bills Falling, $100 Bills Rising
  • 3% vs. 60%
  • Factors Driving Job Losses in Software

Recent Comments

No comments to show.

Archives

  • April 2026
  • March 2026
  • February 2026
  • January 2026
  • December 2025
  • November 2025
  • October 2025
  • September 2025
  • August 2025
  • July 2025
  • June 2025
  • May 2025
  • April 2025
  • March 2025
  • February 2025
  • January 2025
  • December 2024
  • November 2024
  • October 2024
  • September 2024
  • August 2024
  • July 2024
  • June 2024
  • May 2024
  • April 2024
  • March 2024
  • February 2024
  • January 2024
  • December 2023
  • November 2023
  • October 2023
  • September 2023
  • August 2023
  • July 2023
  • June 2023
  • May 2023
  • April 2023
  • March 2023
  • February 2023
  • January 2023
  • December 2022
  • November 2022
  • October 2022
  • September 2022
  • August 2022
  • July 2022
  • June 2022
  • May 2022
  • April 2022
  • March 2022
  • February 2022
  • January 2022
  • December 2021
  • November 2021

Categories

  • Apollo Answers
  • Course Introductions
  • Economic Intelligence
  • Hide from Wordpress Search
  • Investment Knowledge
  • Perspectives
  • Redirecting
  • The Daily Spark
  • The View from Apollo
  • The Weekly Brief
  • Uncategorized
  • White Papers

Global Growth Expectations Continue to Improve

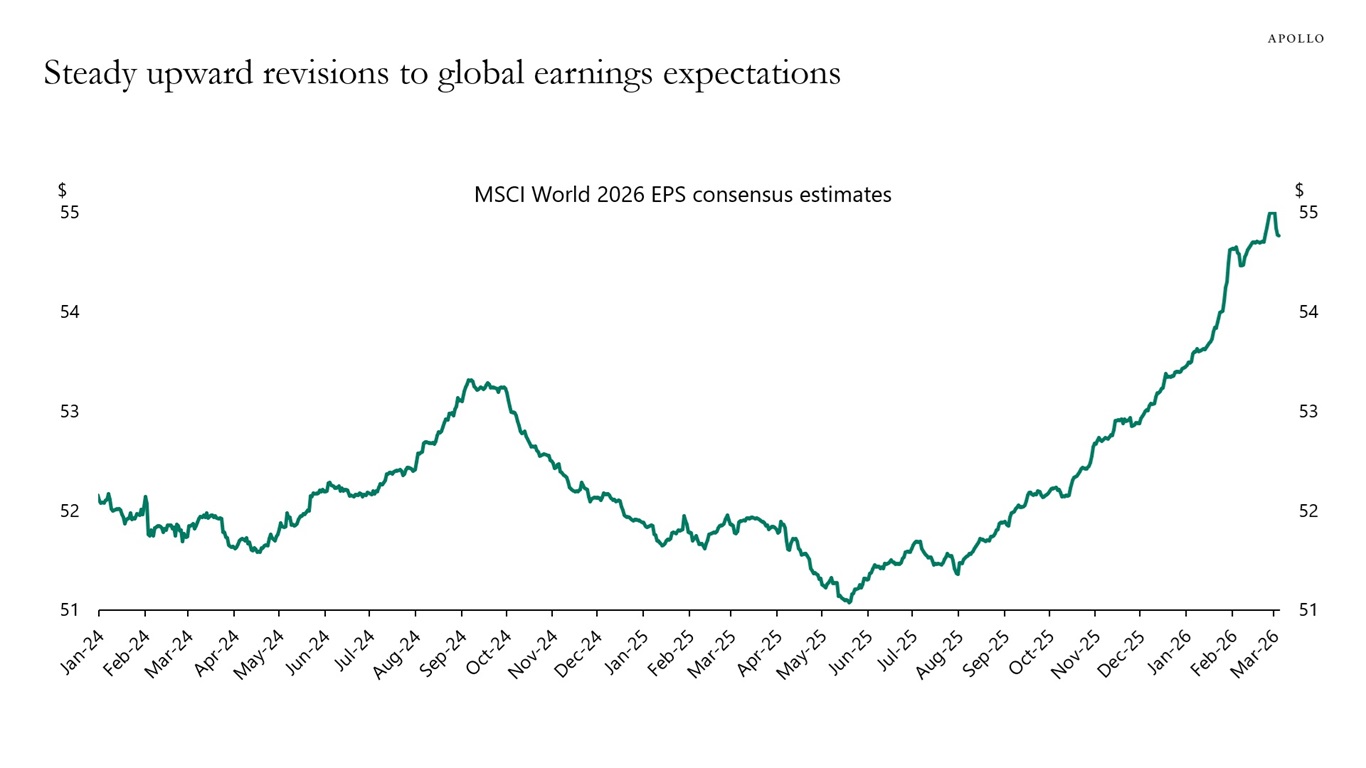
There are no signs of a slowdown in corporate earnings expectations, see chart below.

Steady upward revisions to global earnings expectations
Sources: Bloomberg, Apollo Chief Economist

Download high-res chart

Recent Posts

  • Understanding the Rise and Recent Fall in Gold Prices
  • Outlook for Public and Private Markets
  • $20 Bills Falling, $100 Bills Rising
  • 3% vs. 60%
  • Factors Driving Job Losses in Software

Recent Comments

No comments to show.

Archives

  • April 2026
  • March 2026
  • February 2026
  • January 2026
  • December 2025
  • November 2025
  • October 2025
  • September 2025
  • August 2025
  • July 2025
  • June 2025
  • May 2025
  • April 2025
  • March 2025
  • February 2025
  • January 2025
  • December 2024
  • November 2024
  • October 2024
  • September 2024
  • August 2024
  • July 2024
  • June 2024
  • May 2024
  • April 2024
  • March 2024
  • February 2024
  • January 2024
  • December 2023
  • November 2023
  • October 2023
  • September 2023
  • August 2023
  • July 2023
  • June 2023
  • May 2023
  • April 2023
  • March 2023
  • February 2023
  • January 2023
  • December 2022
  • November 2022
  • October 2022
  • September 2022
  • August 2022
  • July 2022
  • June 2022
  • May 2022
  • April 2022
  • March 2022
  • February 2022
  • January 2022
  • December 2021
  • November 2021

Categories

  • Apollo Answers
  • Course Introductions
  • Economic Intelligence
  • Hide from Wordpress Search
  • Investment Knowledge
  • Perspectives
  • Redirecting
  • The Daily Spark
  • The View from Apollo
  • The Weekly Brief
  • Uncategorized
  • White Papers

Why Real Estate in 2026?

After a rate-driven repricing that began in 2022, real estate valuations have adjusted meaningfully while underlying fundamentals have remained intact. With capital values reset, supply constrained and income growth resilient, 2026 may represent a favorable point in the cycle to reengage with private real estate.

Key Takeaways:

  • Repricing has largely occurred: Cap rates expanded, and asset values declined as rates rose, but net operating income continued to grow, highlighting resilient property-level fundamentals.
  • Valuations are more aligned with history: Real estate spreads have normalized relative to corporate credit, reflecting a market that has reset, rather than one priced at peak levels.
  • Supply is constrained: Higher financing costs, rising construction expenses and regulatory delays have slowed development, creating a supportive backdrop for existing assets.
  • Recovery will be uneven: Projected NOI growth varies by sector, reinforcing the importance of selectivity, asset quality and underwriting discipline.
Download the Piece

The information herein is provided for educational purposes only and should not be construed as financial or investment advice, nor should any information in this document be relied on when making an investment decision. Opinions and views expressed reflect the current opinions and views of the authors and Apollo Analysts as of the date hereof and are subject to change. Please see the end of this document for important disclosure information.


Important Disclosure Information

This presentation is for educational purposes only and should not be treated as research. This presentation may not be distributed, transmitted or otherwise communicated to others, in whole or in part, without the express written consent of Apollo Global Management, Inc. (together with its subsidiaries, “Apollo”).

The views and opinions expressed in this presentation are the views and opinions of the author(s) of the White Paper. They do not necessarily reflect the views and opinions of Apollo and are subject to change at any time without notice. Further, Apollo and its affiliates may have positions (long or short) or engage in securities transactions that are not consistent with the information and views expressed in this presentation. There can be no assurance that an investment strategy will be successful. Historic market trends are not reliable indicators of actual future market behavior or future performance of any particular investment which may differ materially, and should not be relied upon as such. Target allocations contained herein are subject to change. There is no assurance that the target allocations will be achieved, and actual allocations may be significantly different than that shown here. This presentation does not constitute an offer of any service or product of Apollo. It is not an invitation by or on behalf of Apollo to any person to buy or sell any security or to adopt any investment strategy, and shall not form the basis of, nor may it accompany nor form part of, any right or contract to buy or sell any security or to adopt any investment strategy. Nothing herein should be taken as investment advice or a recommendation to enter into any transaction.

Hyperlinks to third-party websites in this presentation are provided for reader convenience only. There can be no assurance that any trends discussed herein will continue. Unless otherwise noted, information included herein is presented as of the dates indicated. This presentation is not complete and the information contained herein may change at any time without notice. Apollo does not have any responsibility to update the presentation to account for such changes. Apollo has not made any representation or warranty, expressed or implied, with respect to fairness, correctness, accuracy, reasonableness, or completeness of any of the information contained herein, and expressly disclaims any responsibility or liability therefore. The information contained herein is not intended to provide, and should not be relied upon for, accounting, legal or tax advice or investment recommendations. Investors should make an independent investigation of the information contained herein, including consulting their tax, legal, accounting or other advisors about such information. Apollo does not act for you and is not responsible for providing you with the protections afforded to its clients.

Certain information contained herein may be “forward-looking” in nature. Due to various risks and uncertainties, actual events or results may differ materially from those reflected or contemplated in such forward-looking information. As such, undue reliance should not be placed on such information. Forward-looking statements may be identified by the use of terminology including, but not limited to, “may”, “will”, “should”, “expect”, “anticipate”, “target”, “project”, “estimate”, “intend”, “continue” or “believe” or the negatives thereof or other variations thereon or comparable terminology.

The Standard & Poor’s 500 (“S&P 500”) Index is a market-capitalization-weighted index of the 500 largest U.S. publicly traded companies by market value.

Additional information may be available upon request.

Recent Posts

  • Understanding the Rise and Recent Fall in Gold Prices
  • Outlook for Public and Private Markets
  • $20 Bills Falling, $100 Bills Rising
  • 3% vs. 60%
  • Factors Driving Job Losses in Software

Recent Comments

No comments to show.

Archives

  • April 2026
  • March 2026
  • February 2026
  • January 2026
  • December 2025
  • November 2025
  • October 2025
  • September 2025
  • August 2025
  • July 2025
  • June 2025
  • May 2025
  • April 2025
  • March 2025
  • February 2025
  • January 2025
  • December 2024
  • November 2024
  • October 2024
  • September 2024
  • August 2024
  • July 2024
  • June 2024
  • May 2024
  • April 2024
  • March 2024
  • February 2024
  • January 2024
  • December 2023
  • November 2023
  • October 2023
  • September 2023
  • August 2023
  • July 2023
  • June 2023
  • May 2023
  • April 2023
  • March 2023
  • February 2023
  • January 2023
  • December 2022
  • November 2022
  • October 2022
  • September 2022
  • August 2022
  • July 2022
  • June 2022
  • May 2022
  • April 2022
  • March 2022
  • February 2022
  • January 2022
  • December 2021
  • November 2021

Categories

  • Apollo Answers
  • Course Introductions
  • Economic Intelligence
  • Hide from Wordpress Search
  • Investment Knowledge
  • Perspectives
  • Redirecting
  • The Daily Spark
  • The View from Apollo
  • The Weekly Brief
  • Uncategorized
  • White Papers

Recessions Becoming Less Frequent

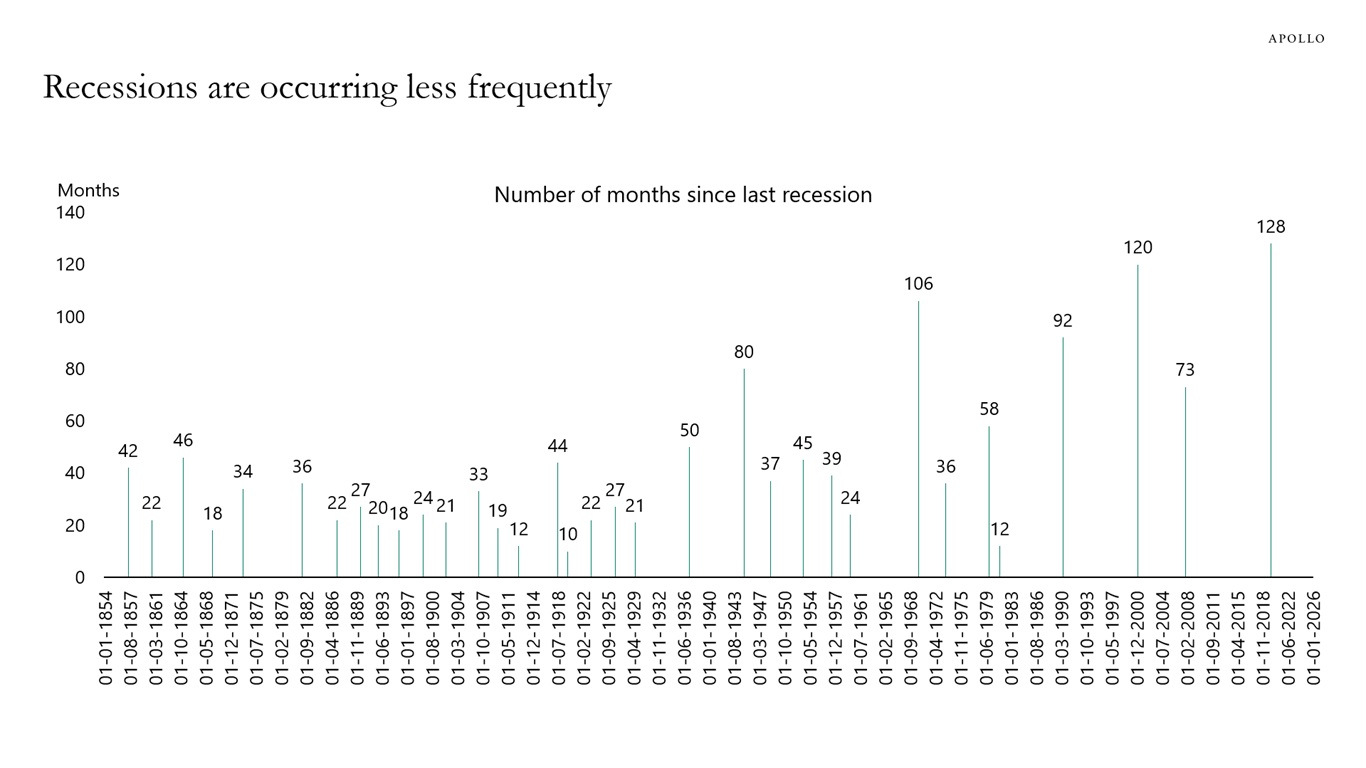
Recessions are occurring less frequently, see chart below. For investors, this means full-blown credit cycles occur less often.

Between recessions, investors should prepare for sector-specific cycles, such as the current downturn in software, where one or two subsectors face distress while the rest of the economy is fine.

The bottom line is that credit opportunities arise not just during recessions, but also when there are sector-specific cycles during expansions. Examples are the energy credit cycle from 2014 to 2016, the brick-and-mortar retail cycle from 2016 to 2019, the commercial real estate cycle from 2022 to 2024 and the software cycle since late 2025.

Recessions are occurring less frequently
Sources: Macrobond, NBER, Apollo Chief Economist

Download high-res chart

Recent Posts

  • Understanding the Rise and Recent Fall in Gold Prices
  • Outlook for Public and Private Markets
  • $20 Bills Falling, $100 Bills Rising
  • 3% vs. 60%
  • Factors Driving Job Losses in Software

Recent Comments

No comments to show.

Archives

  • April 2026
  • March 2026
  • February 2026
  • January 2026
  • December 2025
  • November 2025
  • October 2025
  • September 2025
  • August 2025
  • July 2025
  • June 2025
  • May 2025
  • April 2025
  • March 2025
  • February 2025
  • January 2025
  • December 2024
  • November 2024
  • October 2024
  • September 2024
  • August 2024
  • July 2024
  • June 2024
  • May 2024
  • April 2024
  • March 2024
  • February 2024
  • January 2024
  • December 2023
  • November 2023
  • October 2023
  • September 2023
  • August 2023
  • July 2023
  • June 2023
  • May 2023
  • April 2023
  • March 2023
  • February 2023
  • January 2023
  • December 2022
  • November 2022
  • October 2022
  • September 2022
  • August 2022
  • July 2022
  • June 2022
  • May 2022
  • April 2022
  • March 2022
  • February 2022
  • January 2022
  • December 2021
  • November 2021

Categories

  • Apollo Answers
  • Course Introductions
  • Economic Intelligence
  • Hide from Wordpress Search
  • Investment Knowledge
  • Perspectives
  • Redirecting
  • The Daily Spark
  • The View from Apollo
  • The Weekly Brief
  • Uncategorized
  • White Papers

37% of Household Financial Wealth in Germany Is in Bank Deposits

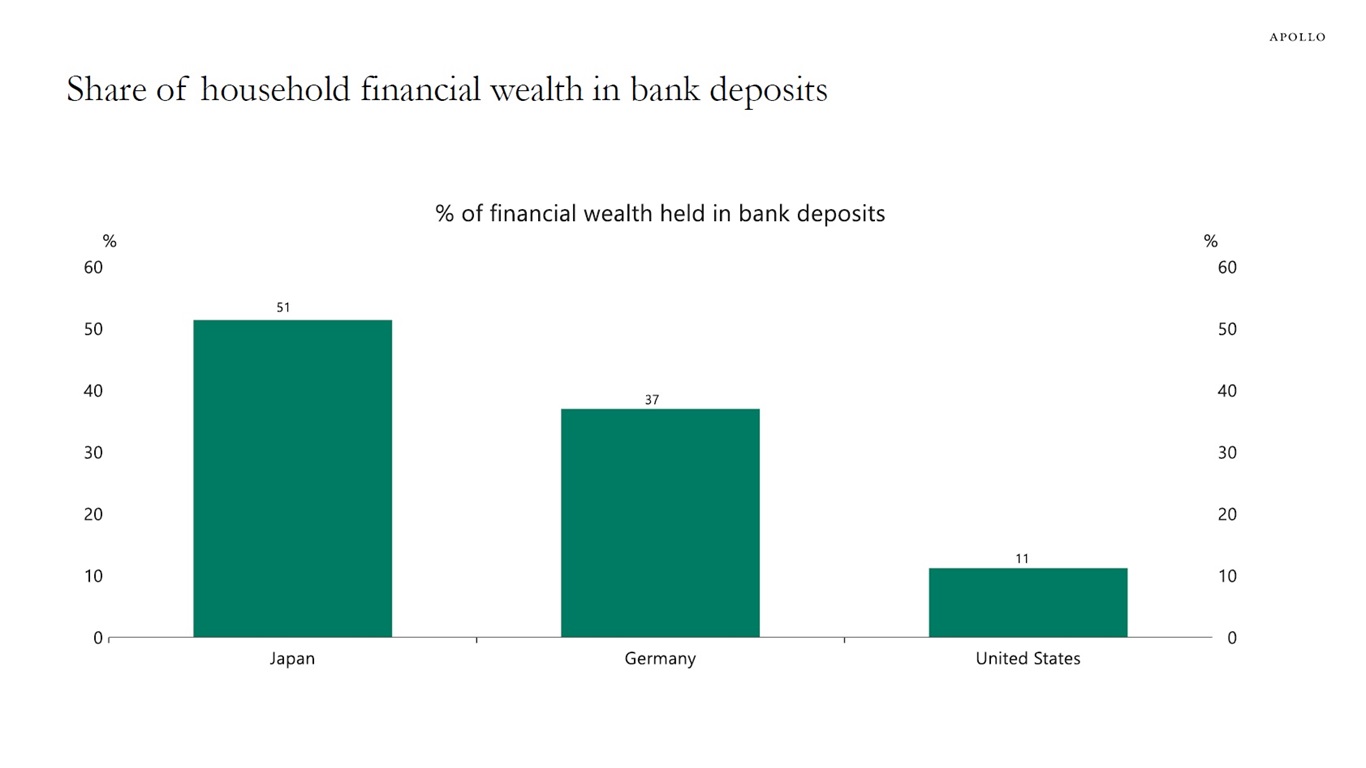
The share of financial wealth in bank deposits is 51% in Japan, 37% in Germany and 11% in the United States, see chart below.

The bottom line is that there is enormous potential for consumers to put more money into yield products.

Share of household financial wealth in bank deposits
Data as of 2024. Sources: OECD (Organisation for Economic Co-operation and Development), Macrobond, Apollo Chief Economist

Download high-res chart

Recent Posts

  • Understanding the Rise and Recent Fall in Gold Prices
  • Outlook for Public and Private Markets
  • $20 Bills Falling, $100 Bills Rising
  • 3% vs. 60%
  • Factors Driving Job Losses in Software

Recent Comments

No comments to show.

Archives

  • April 2026
  • March 2026
  • February 2026
  • January 2026
  • December 2025
  • November 2025
  • October 2025
  • September 2025
  • August 2025
  • July 2025
  • June 2025
  • May 2025
  • April 2025
  • March 2025
  • February 2025
  • January 2025
  • December 2024
  • November 2024
  • October 2024
  • September 2024
  • August 2024
  • July 2024
  • June 2024
  • May 2024
  • April 2024
  • March 2024
  • February 2024
  • January 2024
  • December 2023
  • November 2023
  • October 2023
  • September 2023
  • August 2023
  • July 2023
  • June 2023
  • May 2023
  • April 2023
  • March 2023
  • February 2023
  • January 2023
  • December 2022
  • November 2022
  • October 2022
  • September 2022
  • August 2022
  • July 2022
  • June 2022
  • May 2022
  • April 2022
  • March 2022
  • February 2022
  • January 2022
  • December 2021
  • November 2021

Categories

  • Apollo Answers
  • Course Introductions
  • Economic Intelligence
  • Hide from Wordpress Search
  • Investment Knowledge
  • Perspectives
  • Redirecting
  • The Daily Spark
  • The View from Apollo
  • The Weekly Brief
  • Uncategorized
  • White Papers

Significant Increase in the Number of Objects Launched Into Space

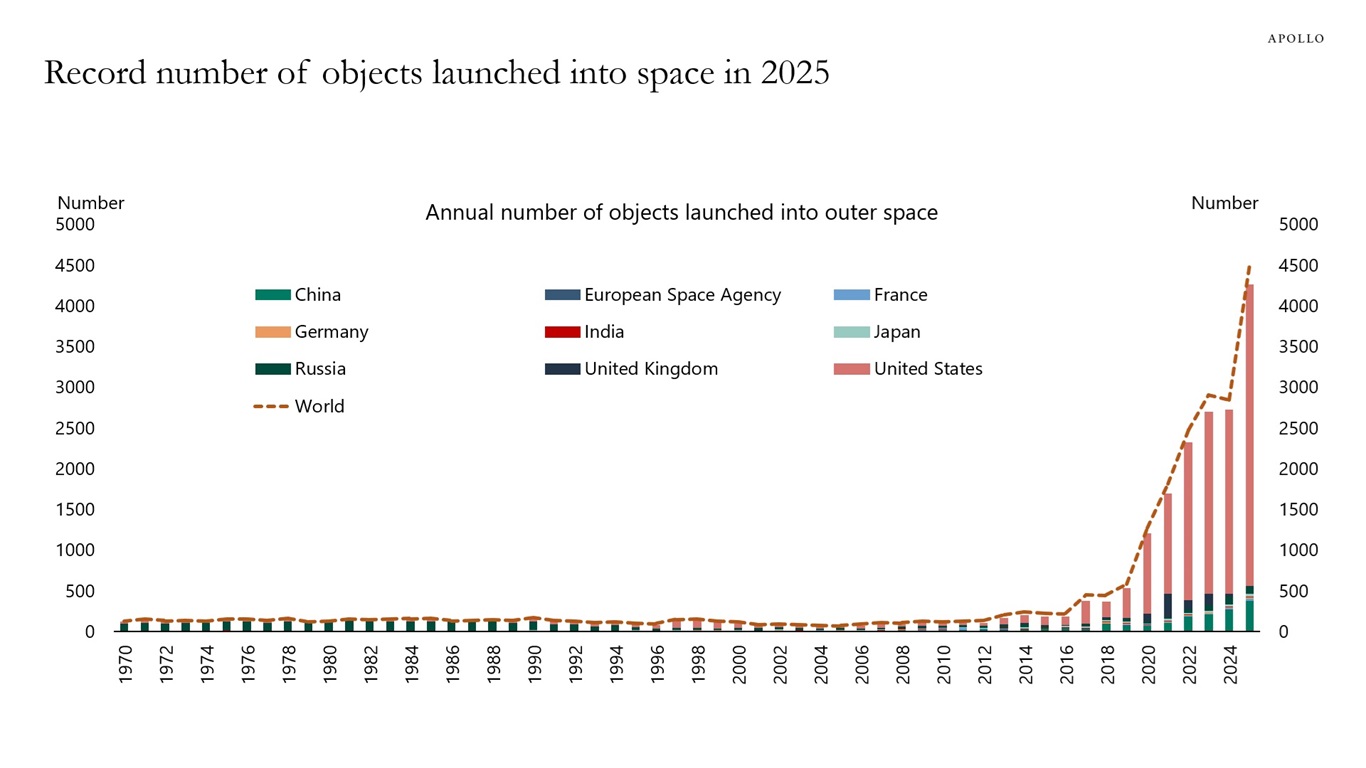
More than 4,500 objects were launched into space in 2025, up from 600 in 2019.

Record number of objects launched into space in 2025
Note: Objects are defined here as satellites, probes, landers, crewed spacecrafts, and space station flight elements launched into Earth’s orbit or beyond. Sources: Our World in Data, United Nations Office for Outer Space Affairs, Apollo Chief Economist

Download high-res chart

Recent Posts

  • Understanding the Rise and Recent Fall in Gold Prices
  • Outlook for Public and Private Markets
  • $20 Bills Falling, $100 Bills Rising
  • 3% vs. 60%
  • Factors Driving Job Losses in Software

Recent Comments

No comments to show.

Archives

  • April 2026
  • March 2026
  • February 2026
  • January 2026
  • December 2025
  • November 2025
  • October 2025
  • September 2025
  • August 2025
  • July 2025
  • June 2025
  • May 2025
  • April 2025
  • March 2025
  • February 2025
  • January 2025
  • December 2024
  • November 2024
  • October 2024
  • September 2024
  • August 2024
  • July 2024
  • June 2024
  • May 2024
  • April 2024
  • March 2024
  • February 2024
  • January 2024
  • December 2023
  • November 2023
  • October 2023
  • September 2023
  • August 2023
  • July 2023
  • June 2023
  • May 2023
  • April 2023
  • March 2023
  • February 2023
  • January 2023
  • December 2022
  • November 2022
  • October 2022
  • September 2022
  • August 2022
  • July 2022
  • June 2022
  • May 2022
  • April 2022
  • March 2022
  • February 2022
  • January 2022
  • December 2021
  • November 2021

Categories

  • Apollo Answers
  • Course Introductions
  • Economic Intelligence
  • Hide from Wordpress Search
  • Investment Knowledge
  • Perspectives
  • Redirecting
  • The Daily Spark
  • The View from Apollo
  • The Weekly Brief
  • Uncategorized
  • White Papers

Posts navigation

←Previous page Page 1 Page 2 Page 3 Page 4 Next page→
  • Privacy Notice
  • Terms of Use
  • Forward-Looking Statements
Apollo
© Apollo Global Management, Inc. All Rights Reserved.

The Apollo Academy is for informational and educational purposes only and nothing contained herein should be taken as investment advice or a recommendation to enter into any transaction. They are not an invitation by or on behalf of Apollo to any person to buy or sell any security or to adopt any investment strategy, and shall not form the basis of, nor may it accompany nor form part of, any right or contract to buy or sell any security or to adopt any investment strategy. There is no guarantee that the views and opinions expressed in this website will come to pass. For additional information, please see the disclaimers included in each piece of content or the legal page of our website here.