• Apollo.com
  • Login
  • Register Now
light site-logo
  • The Academy
  • Upcoming Events
        • Upcoming Events

  • Learning Center
        • New & UpdatedAlternative Investing Course 2.0

        • Alternative Investing Essentials Part OnePrivate Equity, Venture Capital, Private Credit
        • Alternative Investing Essentials Part TwoReal Estate, Infrastructure, Digital Assets, Hedge Funds
        • Practical ConsiderationsAsset Allocation, Risk Considerations, Fund Structures, Fees
        • Introductory Videos

          View All Videos

        •  Recent Classes & Videos

        • • The Evolution of DC Portfolios: Rethinking Income, Risk and Diversification
        • • 2026 Outlook
        • • Private Equity’s Edge: Delivering Alpha in a Changing Market
        • • Powering Innovation: Infrastructure Investing Across the AI Value Chain
        • • Mid-Year Outlook: At the Crossroads of Stagflation — What’s Next?
        • • Hybrid Investments: Flexible Structures for Volatile Times
        • • Private Credit Investing in Volatile Times
        • View All Classes

  • Alternative Perspectives
        • Investment Knowledge
        • The View from Apollo
          • Investment Knowledge

            A Reset in Software — And Why Discipline Always Matters

            March 31, 2026
          • The View From Apollo

            Private Equity Portfolios: Three Key Dimensions of Diversification

            March 31, 2026
          • Investment Knowledge White Papers

            Why Real Estate in 2026?

            March 17, 2026
  • The Daily Spark
  • Register for Apollo Academy: Alternative Investing Course
  • Login
  • About Apollo Academy
  • Upcoming Events
  • Learning Center
  • Alternative Perspectives
  • The Daily Spark
  • Register for Apollo Academy: Alternative Investing Course
  • Login
  • Alternative Investing Course 2.0
  • 2026 Outlook
  • Private Equity’s Edge: Delivering Alpha in a Changing Market
  • Powering Innovation: Infrastructure Investing Across the AI Value Chain
  • Mid-Year Outlook: At the Crossroads of Stagflation — What’s Next?
  • Hybrid Investments: Flexible Structures for Volatile Times
  • Private Credit Investing in Volatile Times
  • View All Classes
  • Introductory Videos
  • Alternative Investing Essentials Part One • Now Available On Demand
  • Alternative Investing Essentials Part Two • Now Available On Demand
  • Practical Considerations • Now Available On Demand
  • Investment Knowledge
  • The View from Apollo
Home March 2026

S&P 500 Concentration Approaching 50%

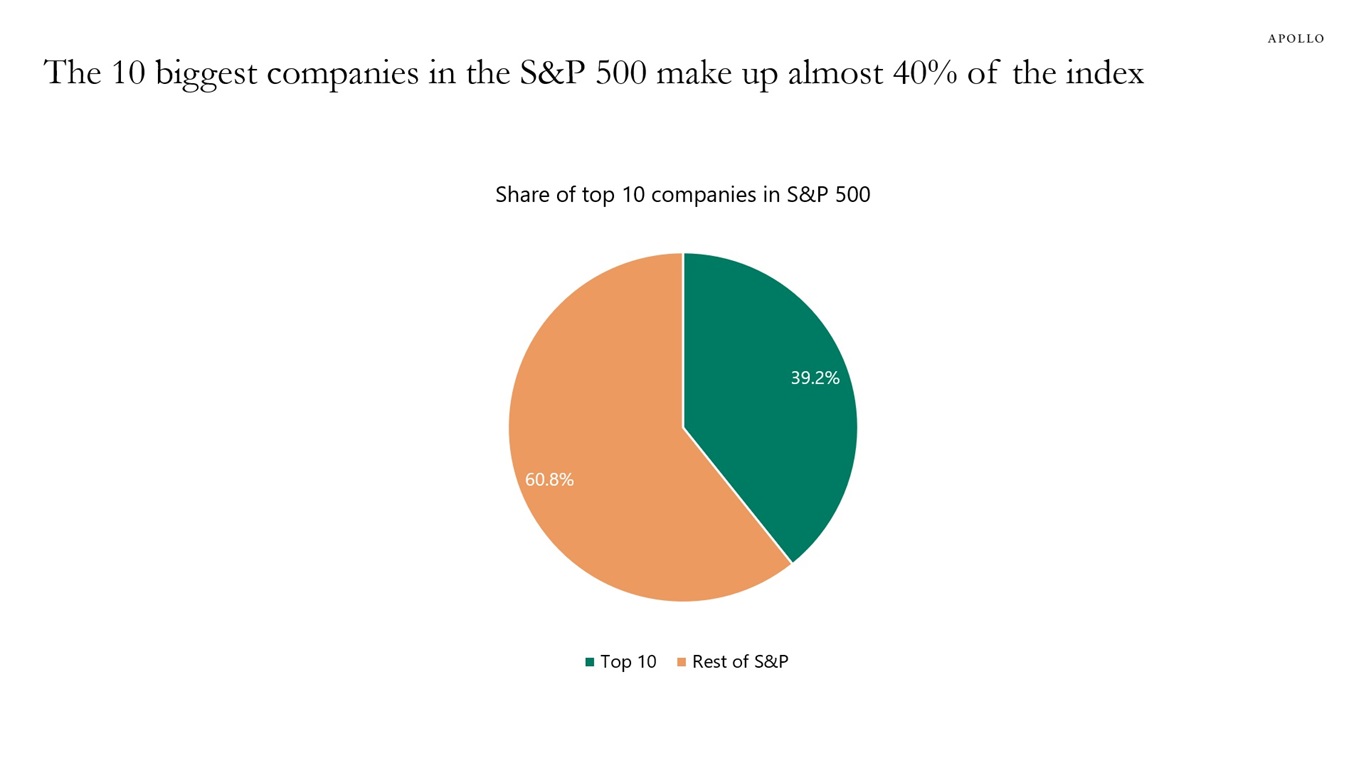
The 10 biggest companies in the S&P 500 make up almost 40% of the index, and if Anthropic, OpenAI and SpaceX are added later this year, the concentration could approach 50%, see chart below. The bottom line is that the S&P 500 basically doesn’t offer much diversification anymore.

The 10 biggest companies in the S&P 500 make up almost 40% of the index
Sources: Bloomberg, Apollo Chief Economist

Download high-res chart

Recent Posts

  • Understanding the Rise and Recent Fall in Gold Prices
  • Outlook for Public and Private Markets
  • $20 Bills Falling, $100 Bills Rising
  • 3% vs. 60%
  • Factors Driving Job Losses in Software

Recent Comments

No comments to show.

Archives

  • April 2026
  • March 2026
  • February 2026
  • January 2026
  • December 2025
  • November 2025
  • October 2025
  • September 2025
  • August 2025
  • July 2025
  • June 2025
  • May 2025
  • April 2025
  • March 2025
  • February 2025
  • January 2025
  • December 2024
  • November 2024
  • October 2024
  • September 2024
  • August 2024
  • July 2024
  • June 2024
  • May 2024
  • April 2024
  • March 2024
  • February 2024
  • January 2024
  • December 2023
  • November 2023
  • October 2023
  • September 2023
  • August 2023
  • July 2023
  • June 2023
  • May 2023
  • April 2023
  • March 2023
  • February 2023
  • January 2023
  • December 2022
  • November 2022
  • October 2022
  • September 2022
  • August 2022
  • July 2022
  • June 2022
  • May 2022
  • April 2022
  • March 2022
  • February 2022
  • January 2022
  • December 2021
  • November 2021

Categories

  • Apollo Answers
  • Course Introductions
  • Economic Intelligence
  • Hide from Wordpress Search
  • Investment Knowledge
  • Perspectives
  • Redirecting
  • The Daily Spark
  • The View from Apollo
  • The Weekly Brief
  • Uncategorized
  • White Papers

US Households Not Saving Enough for Retirement

Our chart book (available here) documents the growing retirement crisis.

The growing retirement crisis: Households not saving enough
Gross pension wealth for average earners by gender, multiple of annual earnings
Note: Pension wealth – a measure of the stock of future discounted flows of pension benefits – takes account of these factors. It can be thought of as the lump sum needed at the retirement age to purchase, without paying any fees, an annuity giving the same flow of pension payments as that promised by mandatory retirement-income schemes. Since women’s life expectancy is longer than men’s, pension wealth for women is higher in all countries. Sources: OECD, Apollo Chief Economist

Download high-res chart book

Recent Posts

  • Understanding the Rise and Recent Fall in Gold Prices
  • Outlook for Public and Private Markets
  • $20 Bills Falling, $100 Bills Rising
  • 3% vs. 60%
  • Factors Driving Job Losses in Software

Recent Comments

No comments to show.

Archives

  • April 2026
  • March 2026
  • February 2026
  • January 2026
  • December 2025
  • November 2025
  • October 2025
  • September 2025
  • August 2025
  • July 2025
  • June 2025
  • May 2025
  • April 2025
  • March 2025
  • February 2025
  • January 2025
  • December 2024
  • November 2024
  • October 2024
  • September 2024
  • August 2024
  • July 2024
  • June 2024
  • May 2024
  • April 2024
  • March 2024
  • February 2024
  • January 2024
  • December 2023
  • November 2023
  • October 2023
  • September 2023
  • August 2023
  • July 2023
  • June 2023
  • May 2023
  • April 2023
  • March 2023
  • February 2023
  • January 2023
  • December 2022
  • November 2022
  • October 2022
  • September 2022
  • August 2022
  • July 2022
  • June 2022
  • May 2022
  • April 2022
  • March 2022
  • February 2022
  • January 2022
  • December 2021
  • November 2021

Categories

  • Apollo Answers
  • Course Introductions
  • Economic Intelligence
  • Hide from Wordpress Search
  • Investment Knowledge
  • Perspectives
  • Redirecting
  • The Daily Spark
  • The View from Apollo
  • The Weekly Brief
  • Uncategorized
  • White Papers
The View from Apollo - A New Podcast Series

Torsten Slok on the US Economy: Resilience Under Pressure

AI investment, fiscal stimulus and an ongoing industrial renaissance continue to power the US economy. Yet geopolitical shocks, tariff shifts and inflation above target are creating persistent crosscurrents that complicate the outlook. As the first quarter of 2026 draws to a close, Apollo Chief Economist Torsten Slok examines the tension between solid fundamentals and mounting uncertainty, and what it could mean for investors.

Recent Posts

  • Understanding the Rise and Recent Fall in Gold Prices
  • Outlook for Public and Private Markets
  • $20 Bills Falling, $100 Bills Rising
  • 3% vs. 60%
  • Factors Driving Job Losses in Software

Recent Comments

No comments to show.

Archives

  • April 2026
  • March 2026
  • February 2026
  • January 2026
  • December 2025
  • November 2025
  • October 2025
  • September 2025
  • August 2025
  • July 2025
  • June 2025
  • May 2025
  • April 2025
  • March 2025
  • February 2025
  • January 2025
  • December 2024
  • November 2024
  • October 2024
  • September 2024
  • August 2024
  • July 2024
  • June 2024
  • May 2024
  • April 2024
  • March 2024
  • February 2024
  • January 2024
  • December 2023
  • November 2023
  • October 2023
  • September 2023
  • August 2023
  • July 2023
  • June 2023
  • May 2023
  • April 2023
  • March 2023
  • February 2023
  • January 2023
  • December 2022
  • November 2022
  • October 2022
  • September 2022
  • August 2022
  • July 2022
  • June 2022
  • May 2022
  • April 2022
  • March 2022
  • February 2022
  • January 2022
  • December 2021
  • November 2021

Categories

  • Apollo Answers
  • Course Introductions
  • Economic Intelligence
  • Hide from Wordpress Search
  • Investment Knowledge
  • Perspectives
  • Redirecting
  • The Daily Spark
  • The View from Apollo
  • The Weekly Brief
  • Uncategorized
  • White Papers

Software Maturity Wall

Software faces a massive $40 billion maturity wall in 2028, dominated by lower-rated B- credits, exposing the sector to refinancing risks amid AI disruption and rates higher for longer, see chart below.

Software: 2028 maturity wall approaching
Note: Data through February 2026. Sources: PitchBook | LCD; Morningstar LSTA US Leveraged Loan Index, Apollo Chief Economist

Download high-res chart

Recent Posts

  • Understanding the Rise and Recent Fall in Gold Prices
  • Outlook for Public and Private Markets
  • $20 Bills Falling, $100 Bills Rising
  • 3% vs. 60%
  • Factors Driving Job Losses in Software

Recent Comments

No comments to show.

Archives

  • April 2026
  • March 2026
  • February 2026
  • January 2026
  • December 2025
  • November 2025
  • October 2025
  • September 2025
  • August 2025
  • July 2025
  • June 2025
  • May 2025
  • April 2025
  • March 2025
  • February 2025
  • January 2025
  • December 2024
  • November 2024
  • October 2024
  • September 2024
  • August 2024
  • July 2024
  • June 2024
  • May 2024
  • April 2024
  • March 2024
  • February 2024
  • January 2024
  • December 2023
  • November 2023
  • October 2023
  • September 2023
  • August 2023
  • July 2023
  • June 2023
  • May 2023
  • April 2023
  • March 2023
  • February 2023
  • January 2023
  • December 2022
  • November 2022
  • October 2022
  • September 2022
  • August 2022
  • July 2022
  • June 2022
  • May 2022
  • April 2022
  • March 2022
  • February 2022
  • January 2022
  • December 2021
  • November 2021

Categories

  • Apollo Answers
  • Course Introductions
  • Economic Intelligence
  • Hide from Wordpress Search
  • Investment Knowledge
  • Perspectives
  • Redirecting
  • The Daily Spark
  • The View from Apollo
  • The Weekly Brief
  • Uncategorized
  • White Papers

Margin Debt at Record Highs

With margin debt at record highs, any downturn in stocks risks turning into a sharper correction as leveraged investors are forced to sell into falling markets, see chart below.

Margin debt at record high levels
Sources: FINRA, Haver Analytics, Apollo Chief Economist

Download high-res chart

Recent Posts

  • Understanding the Rise and Recent Fall in Gold Prices
  • Outlook for Public and Private Markets
  • $20 Bills Falling, $100 Bills Rising
  • 3% vs. 60%
  • Factors Driving Job Losses in Software

Recent Comments

No comments to show.

Archives

  • April 2026
  • March 2026
  • February 2026
  • January 2026
  • December 2025
  • November 2025
  • October 2025
  • September 2025
  • August 2025
  • July 2025
  • June 2025
  • May 2025
  • April 2025
  • March 2025
  • February 2025
  • January 2025
  • December 2024
  • November 2024
  • October 2024
  • September 2024
  • August 2024
  • July 2024
  • June 2024
  • May 2024
  • April 2024
  • March 2024
  • February 2024
  • January 2024
  • December 2023
  • November 2023
  • October 2023
  • September 2023
  • August 2023
  • July 2023
  • June 2023
  • May 2023
  • April 2023
  • March 2023
  • February 2023
  • January 2023
  • December 2022
  • November 2022
  • October 2022
  • September 2022
  • August 2022
  • July 2022
  • June 2022
  • May 2022
  • April 2022
  • March 2022
  • February 2022
  • January 2022
  • December 2021
  • November 2021

Categories

  • Apollo Answers
  • Course Introductions
  • Economic Intelligence
  • Hide from Wordpress Search
  • Investment Knowledge
  • Perspectives
  • Redirecting
  • The Daily Spark
  • The View from Apollo
  • The Weekly Brief
  • Uncategorized
  • White Papers

Public Equity Markets Have Changed—Why Do Portfolios Still Look the Same?

Public equity markets have changed significantly over the past decade. The number of listed companies has declined, market concentration has increased and valuations for the largest stocks have reached historically elevated levels. At the same time, correlations within public markets have risen and passive strategies have continued to gain share.

In this video, Co-Head of Apollo’s Aligned Alternatives Eric Hanno discusses why these structural shifts may prompt investors to reconsider traditional equity allocations and evaluate the potential role of an alternative approach to equity.

Key themes include:

  • Shrinking public markets and a smaller listed opportunity set
  • Increased concentration and sector exposure in major indices
  • Higher correlations and volatility during market stress
  • Private market strategies with more predictable or contractual cash flows and lower correlation to public equities

Watch the video


The information herein is provided for educational purposes only and should not be construed as financial or investment advice, nor should any information in this document be relied on when making an investment decision. Opinions and views expressed reflect the current opinions and views of the authors and Apollo Analysts as of the date hereof and are subject to change. Please see the end of this document for important disclosure information.


Important Disclosure Information

This presentation is for educational purposes only and should not be treated as research. This presentation may not be distributed, transmitted or otherwise communicated to others, in whole or in part, without the express written consent of Apollo Global Management, Inc. (together with its subsidiaries, “Apollo”).

The views and opinions expressed in this presentation are the views and opinions of the author(s) of the White Paper. They do not necessarily reflect the views and opinions of Apollo and are subject to change at any time without notice. Further, Apollo and its affiliates may have positions (long or short) or engage in securities transactions that are not consistent with the information and views expressed in this presentation. There can be no assurance that an investment strategy will be successful. Historic market trends are not reliable indicators of actual future market behavior or future performance of any particular investment which may differ materially, and should not be relied upon as such. Target allocations contained herein are subject to change. There is no assurance that the target allocations will be achieved, and actual allocations may be significantly different than that shown here. This presentation does not constitute an offer of any service or product of Apollo. It is not an invitation by or on behalf of Apollo to any person to buy or sell any security or to adopt any investment strategy, and shall not form the basis of, nor may it accompany nor form part of, any right or contract to buy or sell any security or to adopt any investment strategy. Nothing herein should be taken as investment advice or a recommendation to enter into any transaction.

Hyperlinks to third-party websites in this presentation are provided for reader convenience only. There can be no assurance that any trends discussed herein will continue. Unless otherwise noted, information included herein is presented as of the dates indicated. This presentation is not complete and the information contained herein may change at any time without notice. Apollo does not have any responsibility to update the presentation to account for such changes. Apollo has not made any representation or warranty, expressed or implied, with respect to fairness, correctness, accuracy, reasonableness, or completeness of any of the information contained herein, and expressly disclaims any responsibility or liability therefore. The information contained herein is not intended to provide, and should not be relied upon for, accounting, legal or tax advice or investment recommendations. Investors should make an independent investigation of the information contained herein, including consulting their tax, legal, accounting or other advisors about such information. Apollo does not act for you and is not responsible for providing you with the protections afforded to its clients.

Certain information contained herein may be “forward-looking” in nature. Due to various risks and uncertainties, actual events or results may differ materially from those reflected or contemplated in such forward-looking information. As such, undue reliance should not be placed on such information. Forward-looking statements may be identified by the use of terminology including, but not limited to, “may”, “will”, “should”, “expect”, “anticipate”, “target”, “project”, “estimate”, “intend”, “continue” or “believe” or the negatives thereof or other variations thereon or comparable terminology.

The Standard & Poor’s 500 (“S&P 500”) Index is a market-capitalization-weighted index of the 500 largest U.S. publicly traded companies by market value.

Additional information may be available upon request.

Recent Posts

  • Understanding the Rise and Recent Fall in Gold Prices
  • Outlook for Public and Private Markets
  • $20 Bills Falling, $100 Bills Rising
  • 3% vs. 60%
  • Factors Driving Job Losses in Software

Recent Comments

No comments to show.

Archives

  • April 2026
  • March 2026
  • February 2026
  • January 2026
  • December 2025
  • November 2025
  • October 2025
  • September 2025
  • August 2025
  • July 2025
  • June 2025
  • May 2025
  • April 2025
  • March 2025
  • February 2025
  • January 2025
  • December 2024
  • November 2024
  • October 2024
  • September 2024
  • August 2024
  • July 2024
  • June 2024
  • May 2024
  • April 2024
  • March 2024
  • February 2024
  • January 2024
  • December 2023
  • November 2023
  • October 2023
  • September 2023
  • August 2023
  • July 2023
  • June 2023
  • May 2023
  • April 2023
  • March 2023
  • February 2023
  • January 2023
  • December 2022
  • November 2022
  • October 2022
  • September 2022
  • August 2022
  • July 2022
  • June 2022
  • May 2022
  • April 2022
  • March 2022
  • February 2022
  • January 2022
  • December 2021
  • November 2021

Categories

  • Apollo Answers
  • Course Introductions
  • Economic Intelligence
  • Hide from Wordpress Search
  • Investment Knowledge
  • Perspectives
  • Redirecting
  • The Daily Spark
  • The View from Apollo
  • The Weekly Brief
  • Uncategorized
  • White Papers

What Is the Impact of $100 Oil Prices on the US Economy?

Our chart book (available here) looks at the simulated effects of $100 oil prices on the economy.

What is the impact of $100 oil prices on the US economy?

Note: Effects fade over several quarters. Source: Apollo Chief Economist

Download high-res chart book

Recent Posts

  • Understanding the Rise and Recent Fall in Gold Prices
  • Outlook for Public and Private Markets
  • $20 Bills Falling, $100 Bills Rising
  • 3% vs. 60%
  • Factors Driving Job Losses in Software

Recent Comments

No comments to show.

Archives

  • April 2026
  • March 2026
  • February 2026
  • January 2026
  • December 2025
  • November 2025
  • October 2025
  • September 2025
  • August 2025
  • July 2025
  • June 2025
  • May 2025
  • April 2025
  • March 2025
  • February 2025
  • January 2025
  • December 2024
  • November 2024
  • October 2024
  • September 2024
  • August 2024
  • July 2024
  • June 2024
  • May 2024
  • April 2024
  • March 2024
  • February 2024
  • January 2024
  • December 2023
  • November 2023
  • October 2023
  • September 2023
  • August 2023
  • July 2023
  • June 2023
  • May 2023
  • April 2023
  • March 2023
  • February 2023
  • January 2023
  • December 2022
  • November 2022
  • October 2022
  • September 2022
  • August 2022
  • July 2022
  • June 2022
  • May 2022
  • April 2022
  • March 2022
  • February 2022
  • January 2022
  • December 2021
  • November 2021

Categories

  • Apollo Answers
  • Course Introductions
  • Economic Intelligence
  • Hide from Wordpress Search
  • Investment Knowledge
  • Perspectives
  • Redirecting
  • The Daily Spark
  • The View from Apollo
  • The Weekly Brief
  • Uncategorized
  • White Papers

K-Shaped Expansion Continues

Consumer spending data from the New York Fed shows a clear K-shaped pattern where growth has been faster for high-income households than low-income households, see the first chart below. The stronger growth in consumer spending for high-income households is driven by the K-shaped growth in wages and wealth, see the second and third chart.

K-shaped pattern for consumer spending
Sources: Economic Heterogeneity Indicators (EHIs) – FEDERAL RESERVE BANK of NEW YORK, Apollo Chief Economist
K-shaped economy for wage growth
Sources: Federal Reserve Bank of Atlanta, Macrobond, Apollo Chief Economist
K-shaped economy for wealth
Sources: Federal Reserve Board, Haver Analytics, Apollo Chief Economist

Download high-res charts

Recent Posts

  • Understanding the Rise and Recent Fall in Gold Prices
  • Outlook for Public and Private Markets
  • $20 Bills Falling, $100 Bills Rising
  • 3% vs. 60%
  • Factors Driving Job Losses in Software

Recent Comments

No comments to show.

Archives

  • April 2026
  • March 2026
  • February 2026
  • January 2026
  • December 2025
  • November 2025
  • October 2025
  • September 2025
  • August 2025
  • July 2025
  • June 2025
  • May 2025
  • April 2025
  • March 2025
  • February 2025
  • January 2025
  • December 2024
  • November 2024
  • October 2024
  • September 2024
  • August 2024
  • July 2024
  • June 2024
  • May 2024
  • April 2024
  • March 2024
  • February 2024
  • January 2024
  • December 2023
  • November 2023
  • October 2023
  • September 2023
  • August 2023
  • July 2023
  • June 2023
  • May 2023
  • April 2023
  • March 2023
  • February 2023
  • January 2023
  • December 2022
  • November 2022
  • October 2022
  • September 2022
  • August 2022
  • July 2022
  • June 2022
  • May 2022
  • April 2022
  • March 2022
  • February 2022
  • January 2022
  • December 2021
  • November 2021

Categories

  • Apollo Answers
  • Course Introductions
  • Economic Intelligence
  • Hide from Wordpress Search
  • Investment Knowledge
  • Perspectives
  • Redirecting
  • The Daily Spark
  • The View from Apollo
  • The Weekly Brief
  • Uncategorized
  • White Papers

Net Unauthorized Immigration

Dallas Fed data show net unauthorized immigration flows turning negative, meaning more individuals are leaving the US than entering, see chart below.

Monthly new unauthorized immigration
Sources: Federal Reserve Bank of Dallas, Apollo Chief Economist

Download high-res chart

Recent Posts

  • Understanding the Rise and Recent Fall in Gold Prices
  • Outlook for Public and Private Markets
  • $20 Bills Falling, $100 Bills Rising
  • 3% vs. 60%
  • Factors Driving Job Losses in Software

Recent Comments

No comments to show.

Archives

  • April 2026
  • March 2026
  • February 2026
  • January 2026
  • December 2025
  • November 2025
  • October 2025
  • September 2025
  • August 2025
  • July 2025
  • June 2025
  • May 2025
  • April 2025
  • March 2025
  • February 2025
  • January 2025
  • December 2024
  • November 2024
  • October 2024
  • September 2024
  • August 2024
  • July 2024
  • June 2024
  • May 2024
  • April 2024
  • March 2024
  • February 2024
  • January 2024
  • December 2023
  • November 2023
  • October 2023
  • September 2023
  • August 2023
  • July 2023
  • June 2023
  • May 2023
  • April 2023
  • March 2023
  • February 2023
  • January 2023
  • December 2022
  • November 2022
  • October 2022
  • September 2022
  • August 2022
  • July 2022
  • June 2022
  • May 2022
  • April 2022
  • March 2022
  • February 2022
  • January 2022
  • December 2021
  • November 2021

Categories

  • Apollo Answers
  • Course Introductions
  • Economic Intelligence
  • Hide from Wordpress Search
  • Investment Knowledge
  • Perspectives
  • Redirecting
  • The Daily Spark
  • The View from Apollo
  • The Weekly Brief
  • Uncategorized
  • White Papers

New Business Formation Exploding Higher

The surge in new US business formation is being fueled by AI and large language models that are dramatically reducing the cost and complexity of launching a company, see chart below. As these firms scale, they will create jobs, underscoring that AI is likely to strengthen, not disrupt, the US labor market.

Weekly business formation exploding higher, likely driven by AI
Sources: US Census Bureau, Macrobond, Apollo Chief Economist

Download high-res chart

Recent Posts

  • Understanding the Rise and Recent Fall in Gold Prices
  • Outlook for Public and Private Markets
  • $20 Bills Falling, $100 Bills Rising
  • 3% vs. 60%
  • Factors Driving Job Losses in Software

Recent Comments

No comments to show.

Archives

  • April 2026
  • March 2026
  • February 2026
  • January 2026
  • December 2025
  • November 2025
  • October 2025
  • September 2025
  • August 2025
  • July 2025
  • June 2025
  • May 2025
  • April 2025
  • March 2025
  • February 2025
  • January 2025
  • December 2024
  • November 2024
  • October 2024
  • September 2024
  • August 2024
  • July 2024
  • June 2024
  • May 2024
  • April 2024
  • March 2024
  • February 2024
  • January 2024
  • December 2023
  • November 2023
  • October 2023
  • September 2023
  • August 2023
  • July 2023
  • June 2023
  • May 2023
  • April 2023
  • March 2023
  • February 2023
  • January 2023
  • December 2022
  • November 2022
  • October 2022
  • September 2022
  • August 2022
  • July 2022
  • June 2022
  • May 2022
  • April 2022
  • March 2022
  • February 2022
  • January 2022
  • December 2021
  • November 2021

Categories

  • Apollo Answers
  • Course Introductions
  • Economic Intelligence
  • Hide from Wordpress Search
  • Investment Knowledge
  • Perspectives
  • Redirecting
  • The Daily Spark
  • The View from Apollo
  • The Weekly Brief
  • Uncategorized
  • White Papers

Posts navigation

←Previous page Page 1 Page 2 Page 3 Page 4 Next page→
  • Privacy Notice
  • Terms of Use
  • Forward-Looking Statements
Apollo
© Apollo Global Management, Inc. All Rights Reserved.

The Apollo Academy is for informational and educational purposes only and nothing contained herein should be taken as investment advice or a recommendation to enter into any transaction. They are not an invitation by or on behalf of Apollo to any person to buy or sell any security or to adopt any investment strategy, and shall not form the basis of, nor may it accompany nor form part of, any right or contract to buy or sell any security or to adopt any investment strategy. There is no guarantee that the views and opinions expressed in this website will come to pass. For additional information, please see the disclaimers included in each piece of content or the legal page of our website here.