• Apollo.com
  • Login
  • Register Now
light site-logo
  • The Academy
  • Upcoming Events
        • Upcoming Events

        • 2026 OutlookTuesday, December 16, 2025 • 11:00am ET
  • Learning Center
        • New & UpdatedAlternative Investing Course 2.0

        • Alternative Investing Essentials Part OnePrivate Equity, Venture Capital, Private Credit
        • Alternative Investing Essentials Part TwoReal Estate, Infrastructure, Digital Assets, Hedge Funds
        • Practical ConsiderationsAsset Allocation, Risk Considerations, Fund Structures, Fees
        • Introductory Videos

          View All Videos

        •  Recent Classes & Videos

        • • Private Equity’s Edge: Delivering Alpha in a Changing Market
        • • Powering Innovation: Infrastructure Investing Across the AI Value Chain
        • • Mid-Year Outlook: At the Crossroads of Stagflation — What’s Next?
        • • Hybrid Investments: Flexible Structures for Volatile Times
        • • Private Credit Investing in Volatile Times
        • • Potential Implications of the Latest US Administration Policy Proposals
        • View All Classes

  • Alternative Perspectives
        • Investment Knowledge
        • The View from Apollo
          • Investment Knowledge

            Hybrid in Action: Delivering Bespoke Capital Solutions in a New Market Paradigm

            December 4, 2025
          • The View From Apollo

            Private Equity: Alpha in an Evolving Market

            November 24, 2025
          • Apollo Answers Investment Knowledge

            Apollo Answers: What’s Missing in Private Credit? Integrating Asset-Backed Finance

            October 27, 2025
  • The Daily Spark
        • Read The Daily Spark Blog


        • Want it delivered daily to your inbox?
          • The Daily Spark

            The Duration Mismatch in the Banking Sector Is a Risk to Financial Stability

            December 6, 2025
          • The Daily Spark

            Default Rates Are Falling

            December 5, 2025
          • The Daily Spark

            Top 5 Risks in 2026

            December 4, 2025
  • Register for Apollo Academy: Alternative Investing Course
  • Login
  • About Apollo Academy
  • Upcoming Events
  • Learning Center
  • Alternative Perspectives
  • The Daily Spark
  • Register for Apollo Academy: Alternative Investing Course
  • Login
  • 2026 Outlook
  • Alternative Investing Course 2.0
  • Private Equity’s Edge: Delivering Alpha in a Changing Market
  • Powering Innovation: Infrastructure Investing Across the AI Value Chain
  • Mid-Year Outlook: At the Crossroads of Stagflation — What’s Next?
  • Hybrid Investments: Flexible Structures for Volatile Times
  • Private Credit Investing in Volatile Times
  • Potential Implications of the Latest US Administration Policy Proposals
  • View All Classes
  • Introductory Videos
  • Alternative Investing Essentials Part One • Now Available On Demand
  • Alternative Investing Essentials Part Two • Now Available On Demand
  • Practical Considerations • Now Available On Demand
  • Investment Knowledge
  • The View from Apollo
Home January 2024

This Is Not a Soft Landing

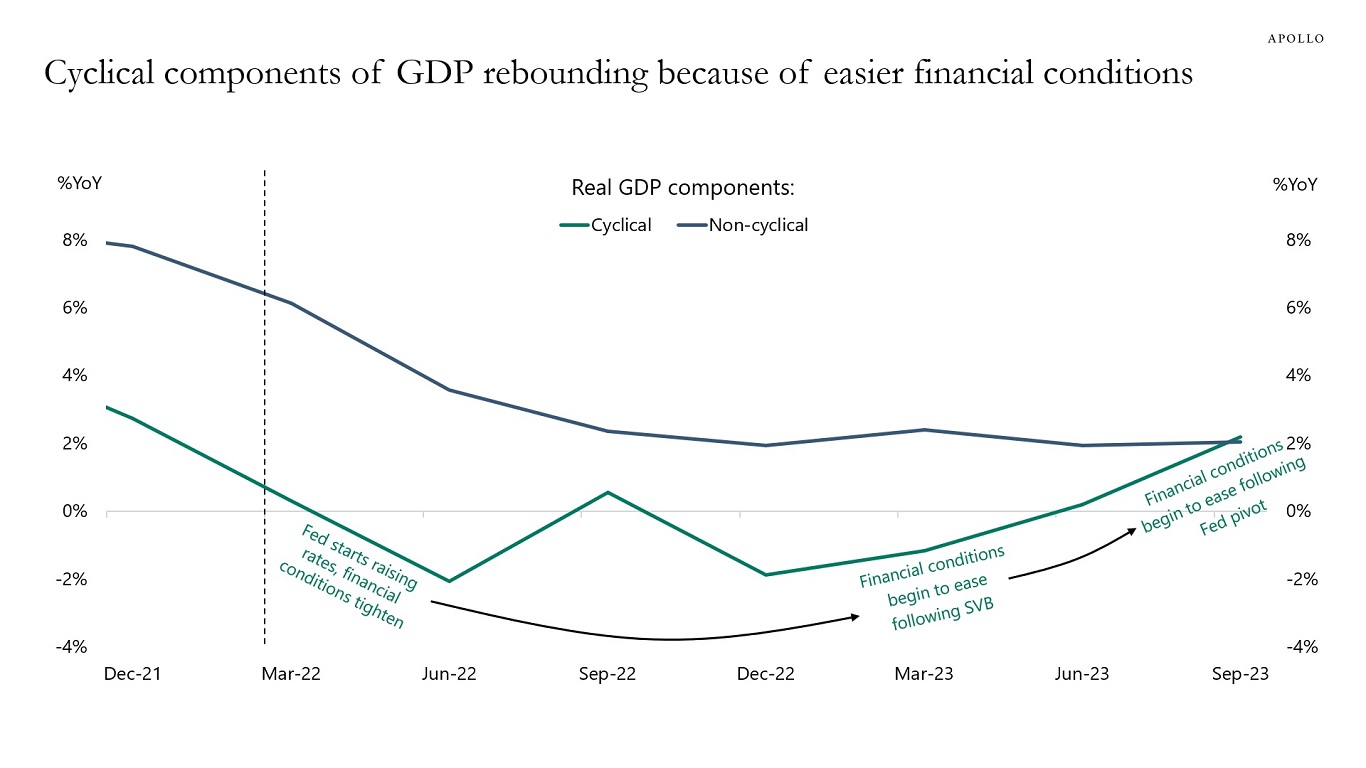
There is an ongoing debate about how core PCE inflation could come down from 5.5% to 3.2% without a slowdown in the economy, but this debate ignores that the cyclical components of GDP, including housing, have slowed sharply as a result of Fed hikes, and the non-cyclical components have continued to see strong growth in particular with strong post-Covid tailwinds to restaurants, hotels, and airlines.

The cyclical components of GDP are the interest rate-sensitive components such as housing, capex, and durable goods, and these parts of the economy slowed significantly when the Fed started raising rates, see chart below.

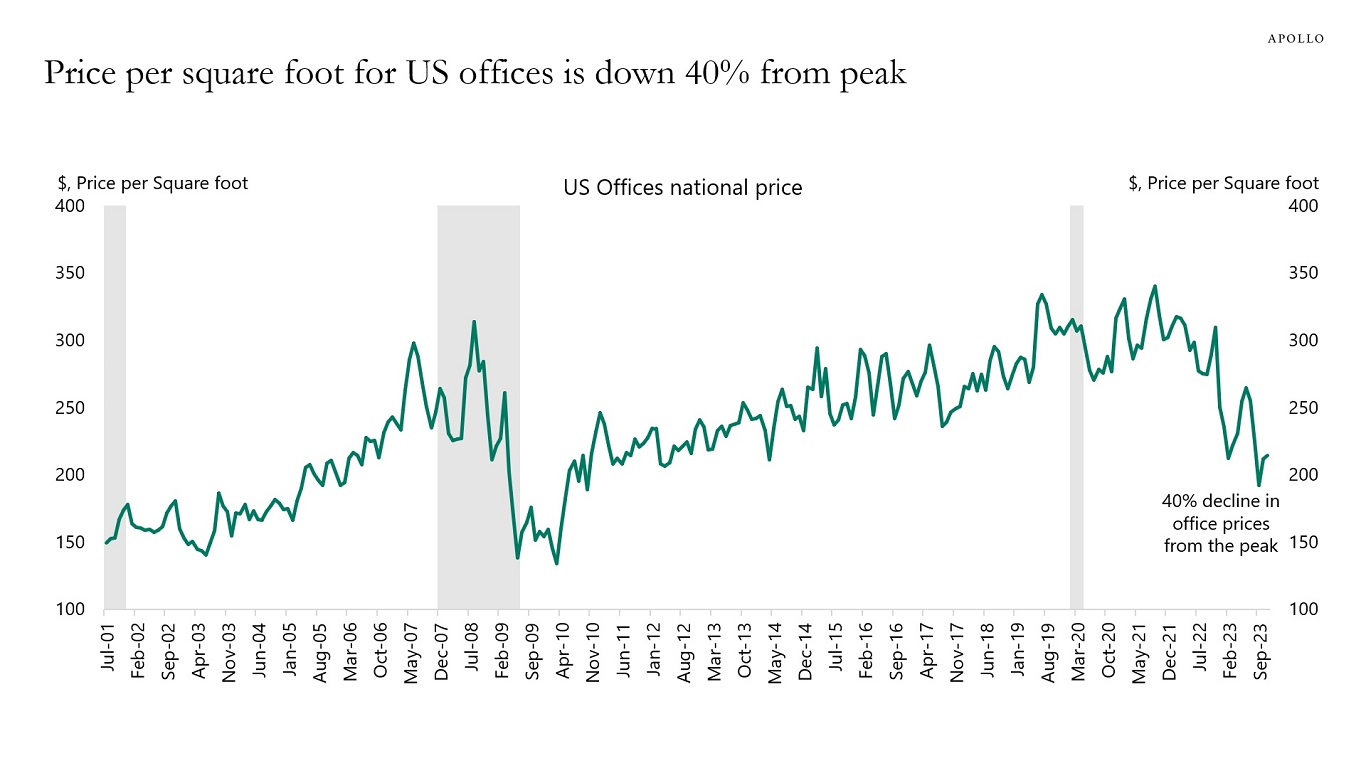
Put differently, it is misleading to say that Fed hikes have not had any negative impact on the economy. Fed hikes had a very negative effect on the interest rate-sensitive parts of the economy, most notably housing, and the result was a decline in housing inflation. With housing having a 40% weight in the CPI basket, the result was a decline in headline and core inflation for both CPI and PCE.

So why did the economy not slow down more, and why did Fed hikes not result in a rise in unemployment? There are two reasons.

First, the post-Covid economy saw surprising strength in the non-cyclical components of the economy, such as eating at restaurants, staying at hotels, and flying on airplanes, etc. Consumers wanted to travel, go to concerts and sporting events after Covid, and this has kept consumer spending strong.

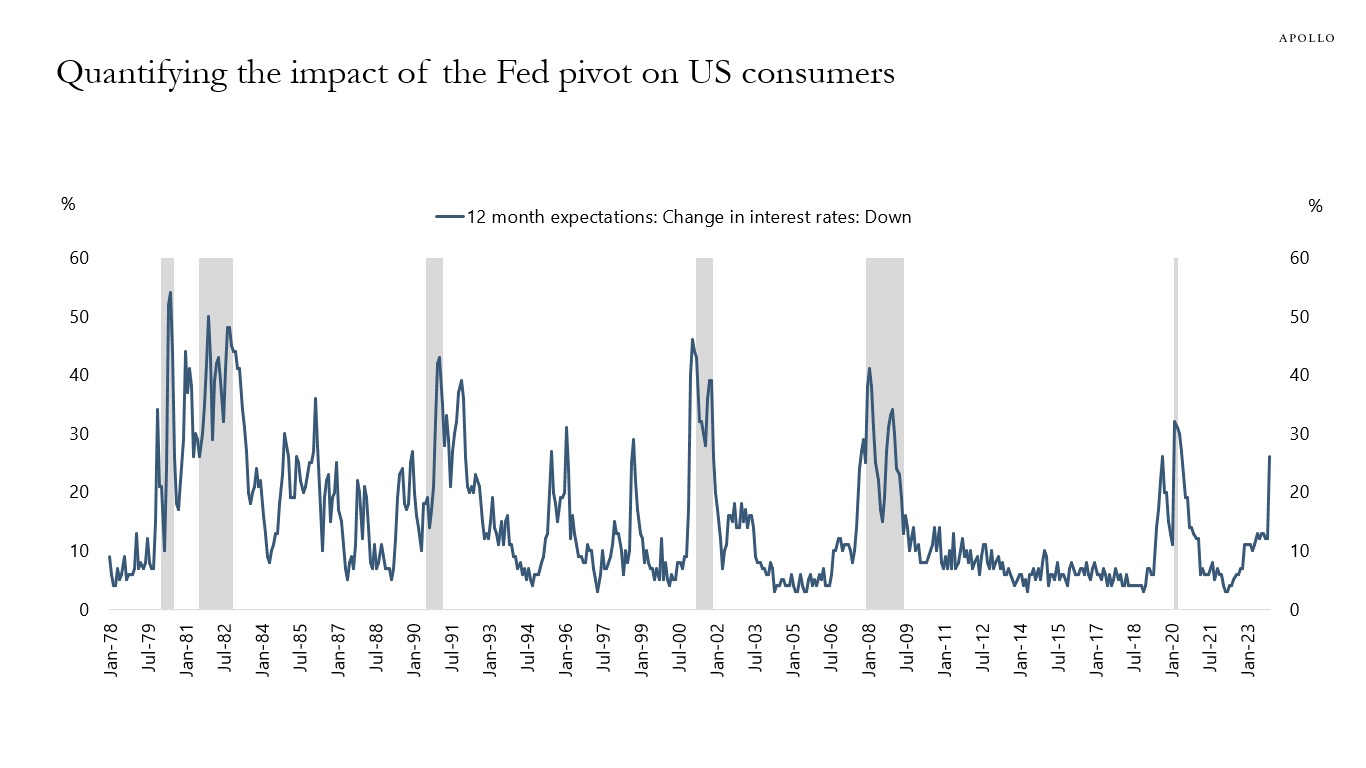
Second, financial conditions eased significantly following SVB, and this boosted GDP growth to 4.9% in the third quarter of 2023. Similarly, the rally in the stock market, credit markets, and Treasury markets since October and after the Fed pivot in December have also eased financial conditions significantly, likely boosting the cyclical components of GDP over the coming months.

As the chart below shows, the bottom line is that the non-cyclical components continue to grow steadily because of post-Covid strong demand for consumer services, and the cyclical components are rebounding because of easier financial conditions.

The likely scenario is that the economy will reaccelerate over the coming months, which will put renewed upward pressure on inflation and, hence, bring back a more hawkish Fed.

In short, the Fed is not done fighting inflation, and, as a result, it is too early to argue that this is a soft landing because both the cyclical and non-cyclical components of GDP are likely to be solid over the coming months, see again the chart below.

Cyclical components of GDP rebounding because of easier financial conditions
Source: BEA, Haver Analytics, Apollo Chief Economist. Note: Cyclical components include interest-sensitive components, i.e., durable goods consumption, nonresidential structures, equipment investment, and residential investment. Non-cyclical components include non-durable goods consumption, services consumption, and nonresidential investment in intellectual property products.

Download hi-res chart(s)

Recent Posts

  • The Duration Mismatch in the Banking Sector Is a Risk to Financial Stability
  • Default Rates Are Falling
  • Hybrid in Action: Delivering Bespoke Capital Solutions in a New Market Paradigm
  • Top 5 Risks in 2026
  • Swaption Volatility Remains Remarkably Low Despite Ongoing Fed Debate

Recent Comments

No comments to show.

Archives

  • December 2025
  • November 2025
  • October 2025
  • September 2025
  • August 2025
  • July 2025
  • June 2025
  • May 2025
  • April 2025
  • March 2025
  • February 2025
  • January 2025
  • December 2024
  • November 2024
  • October 2024
  • September 2024
  • August 2024
  • July 2024
  • June 2024
  • May 2024
  • April 2024
  • March 2024
  • February 2024
  • January 2024
  • December 2023
  • November 2023
  • October 2023
  • September 2023
  • August 2023
  • July 2023
  • June 2023
  • May 2023
  • April 2023
  • March 2023
  • February 2023
  • January 2023
  • December 2022
  • November 2022
  • October 2022
  • September 2022
  • August 2022
  • July 2022
  • June 2022
  • May 2022
  • April 2022
  • March 2022
  • February 2022
  • January 2022
  • December 2021
  • November 2021

Categories

  • Apollo Answers
  • Course Introductions
  • Economic Intelligence
  • Hide from Wordpress Search
  • Investment Knowledge
  • Perspectives
  • Redirecting
  • The Daily Spark
  • The View from Apollo
  • The Weekly Brief
  • Uncategorized
  • White Papers

Extreme Disagreement Among Forecasters About the Outlook for Long-Term Interest Rates

Some forecasters are currently predicting that 10-year rates will end the year above 5%, others are predicting a level below 3%, and the chart below shows the standard deviation of the 12-month ahead forecast for 10-year Treasury yields for 26 private sector forecasters since 2019.

The rising trend in the standard deviation of forecasts shows a very high level of disagreement among forecasters about what will happen to long-term interest rates in 2024.

This is not surprising because some would argue that a soft landing with Fed cuts and lower inflation would result in lower long-term interest rates.

Others would argue that a soft landing with no recession and the risk of reacceleration will push rates higher.

On a different note, others would argue that the key driver of rates in 2024 will be a higher term premium, driven by the coming massive increase in the supply of Treasuries.

What is most remarkable about the high level of disagreement among forecasters is that the same elevated level of uncertainty is entirely absent in the MOVE Index and the VIX Index.

The bottom line is that we have a busy year ahead of us in markets with extreme disagreement about the forces driving longer-term interest rates.

The outlook for 10-year rates: Extreme disagreement among forecasters
Source: Bloomberg, Apollo Chief Economist. (Note: We calculated standard deviation of individual analyst’s forecast for 12 months ahead for every month starting January 2019. The list of contributors in our calculation: UBS, Citigroup, HSBC holdings, Wells Fargo & Co, University Of Texas At El Paso, RBC Financial Group, Natixis SA, Naroff Economic Advisors, Mortgage Bankers Association, MacroFin Analytics LLC, Kasikornbank PCL, ING Groep NV, First Trust Advisors LP, Fannie Mae, Desjardins Securities Inc, Dai-ichi Life Research Institute Inc, Commerzbank, Action Economics, ABN Amro, Bank of Montreal, TD securities, Nomura, Barclays, Goldman Sachs, Bank of America, and Hamburg Commercial Bank AG.)

Download high-res chart(s)

Recent Posts

  • The Duration Mismatch in the Banking Sector Is a Risk to Financial Stability
  • Default Rates Are Falling
  • Hybrid in Action: Delivering Bespoke Capital Solutions in a New Market Paradigm
  • Top 5 Risks in 2026
  • Swaption Volatility Remains Remarkably Low Despite Ongoing Fed Debate

Recent Comments

No comments to show.

Archives

  • December 2025
  • November 2025
  • October 2025
  • September 2025
  • August 2025
  • July 2025
  • June 2025
  • May 2025
  • April 2025
  • March 2025
  • February 2025
  • January 2025
  • December 2024
  • November 2024
  • October 2024
  • September 2024
  • August 2024
  • July 2024
  • June 2024
  • May 2024
  • April 2024
  • March 2024
  • February 2024
  • January 2024
  • December 2023
  • November 2023
  • October 2023
  • September 2023
  • August 2023
  • July 2023
  • June 2023
  • May 2023
  • April 2023
  • March 2023
  • February 2023
  • January 2023
  • December 2022
  • November 2022
  • October 2022
  • September 2022
  • August 2022
  • July 2022
  • June 2022
  • May 2022
  • April 2022
  • March 2022
  • February 2022
  • January 2022
  • December 2021
  • November 2021

Categories

  • Apollo Answers
  • Course Introductions
  • Economic Intelligence
  • Hide from Wordpress Search
  • Investment Knowledge
  • Perspectives
  • Redirecting
  • The Daily Spark
  • The View from Apollo
  • The Weekly Brief
  • Uncategorized
  • White Papers

The Magnitude of the AI Bubble

The market cap of the Magnificent Seven is now four times the market cap of the entire Russell 2000, see the first chart below.

And the market cap of the Magnificent Seven is the same size as the market cap of the stock markets in the UK, Canada, and Japan combined, see the second chart below.

Microsoft alone is the size of the entire stock market in Canada.

Market cap of the Magnificent Seven is four times that of Russell 2000
Source: Bloomberg, Apollo Chief Economist
Market cap of the Magnificent Seven is the same as the combined market cap of the stock markets in the UK, Canada, and Japan
Source: Bloomberg, Apollo Chief Economist

Download high-res chart(s)

Recent Posts

  • The Duration Mismatch in the Banking Sector Is a Risk to Financial Stability
  • Default Rates Are Falling
  • Hybrid in Action: Delivering Bespoke Capital Solutions in a New Market Paradigm
  • Top 5 Risks in 2026
  • Swaption Volatility Remains Remarkably Low Despite Ongoing Fed Debate

Recent Comments

No comments to show.

Archives

  • December 2025
  • November 2025
  • October 2025
  • September 2025
  • August 2025
  • July 2025
  • June 2025
  • May 2025
  • April 2025
  • March 2025
  • February 2025
  • January 2025
  • December 2024
  • November 2024
  • October 2024
  • September 2024
  • August 2024
  • July 2024
  • June 2024
  • May 2024
  • April 2024
  • March 2024
  • February 2024
  • January 2024
  • December 2023
  • November 2023
  • October 2023
  • September 2023
  • August 2023
  • July 2023
  • June 2023
  • May 2023
  • April 2023
  • March 2023
  • February 2023
  • January 2023
  • December 2022
  • November 2022
  • October 2022
  • September 2022
  • August 2022
  • July 2022
  • June 2022
  • May 2022
  • April 2022
  • March 2022
  • February 2022
  • January 2022
  • December 2021
  • November 2021

Categories

  • Apollo Answers
  • Course Introductions
  • Economic Intelligence
  • Hide from Wordpress Search
  • Investment Knowledge
  • Perspectives
  • Redirecting
  • The Daily Spark
  • The View from Apollo
  • The Weekly Brief
  • Uncategorized
  • White Papers

The Impact of the Fed Pivot on Consumers

Data covering the period after the Fed pivot shows that US consumers significantly changed their expectations to interest rates after the December FOMC meeting. Specifically, the share of consumers expecting interest rates to go down jumped to levels last seen during the pandemic and during the financial crisis in 2008, see chart below. With almost 30% of households expecting interest rates to go down, it would make sense if consumers now start borrowing and spending at a faster pace.

Quantifying the impact of the Fed pivot on US consumers
Source: U. of Michigan Survey, Haver Analytics, Apollo Chief Economist

Download high-res chart(s)

Recent Posts

  • The Duration Mismatch in the Banking Sector Is a Risk to Financial Stability
  • Default Rates Are Falling
  • Hybrid in Action: Delivering Bespoke Capital Solutions in a New Market Paradigm
  • Top 5 Risks in 2026
  • Swaption Volatility Remains Remarkably Low Despite Ongoing Fed Debate

Recent Comments

No comments to show.

Archives

  • December 2025
  • November 2025
  • October 2025
  • September 2025
  • August 2025
  • July 2025
  • June 2025
  • May 2025
  • April 2025
  • March 2025
  • February 2025
  • January 2025
  • December 2024
  • November 2024
  • October 2024
  • September 2024
  • August 2024
  • July 2024
  • June 2024
  • May 2024
  • April 2024
  • March 2024
  • February 2024
  • January 2024
  • December 2023
  • November 2023
  • October 2023
  • September 2023
  • August 2023
  • July 2023
  • June 2023
  • May 2023
  • April 2023
  • March 2023
  • February 2023
  • January 2023
  • December 2022
  • November 2022
  • October 2022
  • September 2022
  • August 2022
  • July 2022
  • June 2022
  • May 2022
  • April 2022
  • March 2022
  • February 2022
  • January 2022
  • December 2021
  • November 2021

Categories

  • Apollo Answers
  • Course Introductions
  • Economic Intelligence
  • Hide from Wordpress Search
  • Investment Knowledge
  • Perspectives
  • Redirecting
  • The Daily Spark
  • The View from Apollo
  • The Weekly Brief
  • Uncategorized
  • White Papers

2024 Outlook for Private Markets

Fed cuts and lower costs of capital could boost private markets in 2024. Our latest chart book is available here.

Trends in private markets going into 2024

Download high-res chart(s)

Recent Posts

  • The Duration Mismatch in the Banking Sector Is a Risk to Financial Stability
  • Default Rates Are Falling
  • Hybrid in Action: Delivering Bespoke Capital Solutions in a New Market Paradigm
  • Top 5 Risks in 2026
  • Swaption Volatility Remains Remarkably Low Despite Ongoing Fed Debate

Recent Comments

No comments to show.

Archives

  • December 2025
  • November 2025
  • October 2025
  • September 2025
  • August 2025
  • July 2025
  • June 2025
  • May 2025
  • April 2025
  • March 2025
  • February 2025
  • January 2025
  • December 2024
  • November 2024
  • October 2024
  • September 2024
  • August 2024
  • July 2024
  • June 2024
  • May 2024
  • April 2024
  • March 2024
  • February 2024
  • January 2024
  • December 2023
  • November 2023
  • October 2023
  • September 2023
  • August 2023
  • July 2023
  • June 2023
  • May 2023
  • April 2023
  • March 2023
  • February 2023
  • January 2023
  • December 2022
  • November 2022
  • October 2022
  • September 2022
  • August 2022
  • July 2022
  • June 2022
  • May 2022
  • April 2022
  • March 2022
  • February 2022
  • January 2022
  • December 2021
  • November 2021

Categories

  • Apollo Answers
  • Course Introductions
  • Economic Intelligence
  • Hide from Wordpress Search
  • Investment Knowledge
  • Perspectives
  • Redirecting
  • The Daily Spark
  • The View from Apollo
  • The Weekly Brief
  • Uncategorized
  • White Papers

Outlook for US Banks After the Fed Pivot

The banking sector is facing a number of headwinds from a 40% decline in the price per square foot for office because of higher interest rates and more people working from home, $3 trillion in CRE holdings, and $684 billion in unrealized losses on Treasuries and mortgages, see charts below. The net result is a continued decline in the weekly data for bank lending, see the last chart below.

Our latest banking sector chart book is available here.

Source: Apollo Chief Economist
Price per square foot for US offices is down 40% from peak
Source: RCA, Bloomberg, Apollo Chief Economist
The amount of office space per worker has been declining
Source: REITS, BLS, Bloomberg, Apollo Chief Economist (Note: Office using employment includes professional and business services, Information and Financial activities)
US banks hold half of CRE debt outstanding
Source: S&P Capital IQ, Apollo Chief Economist
Unrealized losses on investment securities for banks
Source: FDIC, Apollo Chief Economist
Unrealized losses making up more than 30% of bank equity capital
Source: FDIC, Haver Analytics, Apollo Chief Economist
Weekly Fed data shows small and large bank lending growth slowing
Source: Federal Reserve Board, Haver Analytics, Apollo Chief Economist

Download hi-res chart(s)

Recent Posts

  • The Duration Mismatch in the Banking Sector Is a Risk to Financial Stability
  • Default Rates Are Falling
  • Hybrid in Action: Delivering Bespoke Capital Solutions in a New Market Paradigm
  • Top 5 Risks in 2026
  • Swaption Volatility Remains Remarkably Low Despite Ongoing Fed Debate

Recent Comments

No comments to show.

Archives

  • December 2025
  • November 2025
  • October 2025
  • September 2025
  • August 2025
  • July 2025
  • June 2025
  • May 2025
  • April 2025
  • March 2025
  • February 2025
  • January 2025
  • December 2024
  • November 2024
  • October 2024
  • September 2024
  • August 2024
  • July 2024
  • June 2024
  • May 2024
  • April 2024
  • March 2024
  • February 2024
  • January 2024
  • December 2023
  • November 2023
  • October 2023
  • September 2023
  • August 2023
  • July 2023
  • June 2023
  • May 2023
  • April 2023
  • March 2023
  • February 2023
  • January 2023
  • December 2022
  • November 2022
  • October 2022
  • September 2022
  • August 2022
  • July 2022
  • June 2022
  • May 2022
  • April 2022
  • March 2022
  • February 2022
  • January 2022
  • December 2021
  • November 2021

Categories

  • Apollo Answers
  • Course Introductions
  • Economic Intelligence
  • Hide from Wordpress Search
  • Investment Knowledge
  • Perspectives
  • Redirecting
  • The Daily Spark
  • The View from Apollo
  • The Weekly Brief
  • Uncategorized
  • White Papers

Credit Market Outlook After the Fed Pivot

Recent issuance in IG, HY, and loans has focused on refinancing and general corporate purpose (GCP), but after the Fed pivot, we are likely to see an increase in M&A activity in 2024 driven by lower cost of capital and pent-up M&A, see charts below. Our latest credit market outlook is available here.

High grade volume by proceeds
Source: Pitchbook LCD, Apollo Chief Economist. Note: GCP means General Corporate Purpose, which means making or financing any payment for working capital, capital expenditures, or any other general corporate purpose.
High yield volumes by proceeds
Source: Pitchbook LCD, Apollo Chief Economist
Loan volumes by proceeds
Source: Pitchbook LCD, Apollo Chief Economist

Download hi-res chart(s)

Recent Posts

  • The Duration Mismatch in the Banking Sector Is a Risk to Financial Stability
  • Default Rates Are Falling
  • Hybrid in Action: Delivering Bespoke Capital Solutions in a New Market Paradigm
  • Top 5 Risks in 2026
  • Swaption Volatility Remains Remarkably Low Despite Ongoing Fed Debate

Recent Comments

No comments to show.

Archives

  • December 2025
  • November 2025
  • October 2025
  • September 2025
  • August 2025
  • July 2025
  • June 2025
  • May 2025
  • April 2025
  • March 2025
  • February 2025
  • January 2025
  • December 2024
  • November 2024
  • October 2024
  • September 2024
  • August 2024
  • July 2024
  • June 2024
  • May 2024
  • April 2024
  • March 2024
  • February 2024
  • January 2024
  • December 2023
  • November 2023
  • October 2023
  • September 2023
  • August 2023
  • July 2023
  • June 2023
  • May 2023
  • April 2023
  • March 2023
  • February 2023
  • January 2023
  • December 2022
  • November 2022
  • October 2022
  • September 2022
  • August 2022
  • July 2022
  • June 2022
  • May 2022
  • April 2022
  • March 2022
  • February 2022
  • January 2022
  • December 2021
  • November 2021

Categories

  • Apollo Answers
  • Course Introductions
  • Economic Intelligence
  • Hide from Wordpress Search
  • Investment Knowledge
  • Perspectives
  • Redirecting
  • The Daily Spark
  • The View from Apollo
  • The Weekly Brief
  • Uncategorized
  • White Papers

Average Negative Equity for Car Owners: $6,000

The average negative equity for car owners has continued to increase and is now higher than in 2019, see chart below.

Average negative equity for car owners currently around $6,000
Source: Bloomberg, Apollo Chief Economist

Download hi-res chart(s)

Recent Posts

  • The Duration Mismatch in the Banking Sector Is a Risk to Financial Stability
  • Default Rates Are Falling
  • Hybrid in Action: Delivering Bespoke Capital Solutions in a New Market Paradigm
  • Top 5 Risks in 2026
  • Swaption Volatility Remains Remarkably Low Despite Ongoing Fed Debate

Recent Comments

No comments to show.

Archives

  • December 2025
  • November 2025
  • October 2025
  • September 2025
  • August 2025
  • July 2025
  • June 2025
  • May 2025
  • April 2025
  • March 2025
  • February 2025
  • January 2025
  • December 2024
  • November 2024
  • October 2024
  • September 2024
  • August 2024
  • July 2024
  • June 2024
  • May 2024
  • April 2024
  • March 2024
  • February 2024
  • January 2024
  • December 2023
  • November 2023
  • October 2023
  • September 2023
  • August 2023
  • July 2023
  • June 2023
  • May 2023
  • April 2023
  • March 2023
  • February 2023
  • January 2023
  • December 2022
  • November 2022
  • October 2022
  • September 2022
  • August 2022
  • July 2022
  • June 2022
  • May 2022
  • April 2022
  • March 2022
  • February 2022
  • January 2022
  • December 2021
  • November 2021

Categories

  • Apollo Answers
  • Course Introductions
  • Economic Intelligence
  • Hide from Wordpress Search
  • Investment Knowledge
  • Perspectives
  • Redirecting
  • The Daily Spark
  • The View from Apollo
  • The Weekly Brief
  • Uncategorized
  • White Papers

How Overvalued Are the Magnificent Seven?

The market cap of the Magnificent Seven is now the same size as the combined market cap of the stock markets in Japan, Canada, and the UK, see chart below.

Market cap of the Magnificent Seven is the same as the combined market cap of the stock markets in the UK, Canada, and Japan
Source: Bloomberg, Apollo Chief Economist

Download hi-res chart(s)

Recent Posts

  • The Duration Mismatch in the Banking Sector Is a Risk to Financial Stability
  • Default Rates Are Falling
  • Hybrid in Action: Delivering Bespoke Capital Solutions in a New Market Paradigm
  • Top 5 Risks in 2026
  • Swaption Volatility Remains Remarkably Low Despite Ongoing Fed Debate

Recent Comments

No comments to show.

Archives

  • December 2025
  • November 2025
  • October 2025
  • September 2025
  • August 2025
  • July 2025
  • June 2025
  • May 2025
  • April 2025
  • March 2025
  • February 2025
  • January 2025
  • December 2024
  • November 2024
  • October 2024
  • September 2024
  • August 2024
  • July 2024
  • June 2024
  • May 2024
  • April 2024
  • March 2024
  • February 2024
  • January 2024
  • December 2023
  • November 2023
  • October 2023
  • September 2023
  • August 2023
  • July 2023
  • June 2023
  • May 2023
  • April 2023
  • March 2023
  • February 2023
  • January 2023
  • December 2022
  • November 2022
  • October 2022
  • September 2022
  • August 2022
  • July 2022
  • June 2022
  • May 2022
  • April 2022
  • March 2022
  • February 2022
  • January 2022
  • December 2021
  • November 2021

Categories

  • Apollo Answers
  • Course Introductions
  • Economic Intelligence
  • Hide from Wordpress Search
  • Investment Knowledge
  • Perspectives
  • Redirecting
  • The Daily Spark
  • The View from Apollo
  • The Weekly Brief
  • Uncategorized
  • White Papers

2024: Lagged Effects of Fed Hikes Versus the Fed Pivot

The Fed pivot in December parallels what happened a decade ago.

In 2013, the taper tantrum triggered a quick tightening in financial conditions due to a modest change in Fed communication.

Today, we are seeing a similar significant change in financial conditions on the back of a modest shift in Fed communication, but with the opposite sign.

The Fed pivot in December was a modest change in Fed communication, but the subsequent easing in financial conditions has been dramatic.

As a result, 2024 will be the year of the lagged effects of Fed hikes versus the Fed pivot. If the Fed pivot continues to push mortgage rates lower, stock prices higher, and credit spreads tighter, we could get a solid rebound in the economy over the coming months, particularly in housing, which will trigger a rebound in employment growth, see chart below.

If housing rebounds, we will have a rebound in housing-related employment
Source: BLS, Haver Analytics, Apollo Chief Economist

Download hi-res chart(s)

Recent Posts

  • The Duration Mismatch in the Banking Sector Is a Risk to Financial Stability
  • Default Rates Are Falling
  • Hybrid in Action: Delivering Bespoke Capital Solutions in a New Market Paradigm
  • Top 5 Risks in 2026
  • Swaption Volatility Remains Remarkably Low Despite Ongoing Fed Debate

Recent Comments

No comments to show.

Archives

  • December 2025
  • November 2025
  • October 2025
  • September 2025
  • August 2025
  • July 2025
  • June 2025
  • May 2025
  • April 2025
  • March 2025
  • February 2025
  • January 2025
  • December 2024
  • November 2024
  • October 2024
  • September 2024
  • August 2024
  • July 2024
  • June 2024
  • May 2024
  • April 2024
  • March 2024
  • February 2024
  • January 2024
  • December 2023
  • November 2023
  • October 2023
  • September 2023
  • August 2023
  • July 2023
  • June 2023
  • May 2023
  • April 2023
  • March 2023
  • February 2023
  • January 2023
  • December 2022
  • November 2022
  • October 2022
  • September 2022
  • August 2022
  • July 2022
  • June 2022
  • May 2022
  • April 2022
  • March 2022
  • February 2022
  • January 2022
  • December 2021
  • November 2021

Categories

  • Apollo Answers
  • Course Introductions
  • Economic Intelligence
  • Hide from Wordpress Search
  • Investment Knowledge
  • Perspectives
  • Redirecting
  • The Daily Spark
  • The View from Apollo
  • The Weekly Brief
  • Uncategorized
  • White Papers

Posts navigation

←Previous page Page 1 Page 2 Page 3 Page 4 Next page→
  • Privacy Notice
  • Terms of Use
  • Forward-Looking Statements
Apollo
© Apollo Global Management, Inc. All Rights Reserved.

The Apollo Academy is for informational and educational purposes only and nothing contained herein should be taken as investment advice or a recommendation to enter into any transaction. They are not an invitation by or on behalf of Apollo to any person to buy or sell any security or to adopt any investment strategy, and shall not form the basis of, nor may it accompany nor form part of, any right or contract to buy or sell any security or to adopt any investment strategy. There is no guarantee that the views and opinions expressed in this website will come to pass. For additional information, please see the disclaimers included in each piece of content or the legal page of our website here.