• Apollo.com
  • Login
  • Register Now
light site-logo
  • The Academy
  • Upcoming Events
        • Upcoming Events

        • 2026 OutlookTuesday, December 16, 2025 • 11:00am ET
  • Learning Center
        • New & UpdatedAlternative Investing Course 2.0

        • Alternative Investing Essentials Part OnePrivate Equity, Venture Capital, Private Credit
        • Alternative Investing Essentials Part TwoReal Estate, Infrastructure, Digital Assets, Hedge Funds
        • Practical ConsiderationsAsset Allocation, Risk Considerations, Fund Structures, Fees
        • Introductory Videos

          View All Videos

        •  Recent Classes & Videos

        • • Private Equity’s Edge: Delivering Alpha in a Changing Market
        • • Powering Innovation: Infrastructure Investing Across the AI Value Chain
        • • Mid-Year Outlook: At the Crossroads of Stagflation — What’s Next?
        • • Hybrid Investments: Flexible Structures for Volatile Times
        • • Private Credit Investing in Volatile Times
        • • Potential Implications of the Latest US Administration Policy Proposals
        • View All Classes

  • Alternative Perspectives
        • Investment Knowledge
        • The View from Apollo
          • Investment Knowledge White Papers

            The Financing Gap in Sports: Unlocking a $2.5 Trillion Opportunity

            December 12, 2025
          • The View From Apollo

            Private Equity: Alpha in an Evolving Market

            November 24, 2025
          • Investment Knowledge

            Hybrid in Action: Delivering Bespoke Capital Solutions in a New Market Paradigm

            December 4, 2025
  • The Daily Spark
        • Read The Daily Spark Blog


        • Want it delivered daily to your inbox?
          • The Daily Spark

            Strong Technical Demand for Credit

            December 15, 2025
          • The Daily Spark

            Fiscal Situation in Germany vs. Spain

            December 14, 2025
          • The Daily Spark

            Hedge Fund Leverage Rising Rapidly

            December 13, 2025
  • Register for Apollo Academy: Alternative Investing Course
  • Login
  • About Apollo Academy
  • Upcoming Events
  • Learning Center
  • Alternative Perspectives
  • The Daily Spark
  • Register for Apollo Academy: Alternative Investing Course
  • Login
  • 2026 Outlook
  • Alternative Investing Course 2.0
  • Private Equity’s Edge: Delivering Alpha in a Changing Market
  • Powering Innovation: Infrastructure Investing Across the AI Value Chain
  • Mid-Year Outlook: At the Crossroads of Stagflation — What’s Next?
  • Hybrid Investments: Flexible Structures for Volatile Times
  • Private Credit Investing in Volatile Times
  • Potential Implications of the Latest US Administration Policy Proposals
  • View All Classes
  • Introductory Videos
  • Alternative Investing Essentials Part One • Now Available On Demand
  • Alternative Investing Essentials Part Two • Now Available On Demand
  • Practical Considerations • Now Available On Demand
  • Investment Knowledge
  • The View from Apollo
Home March 2025

This Is a Wait-and-See Economy

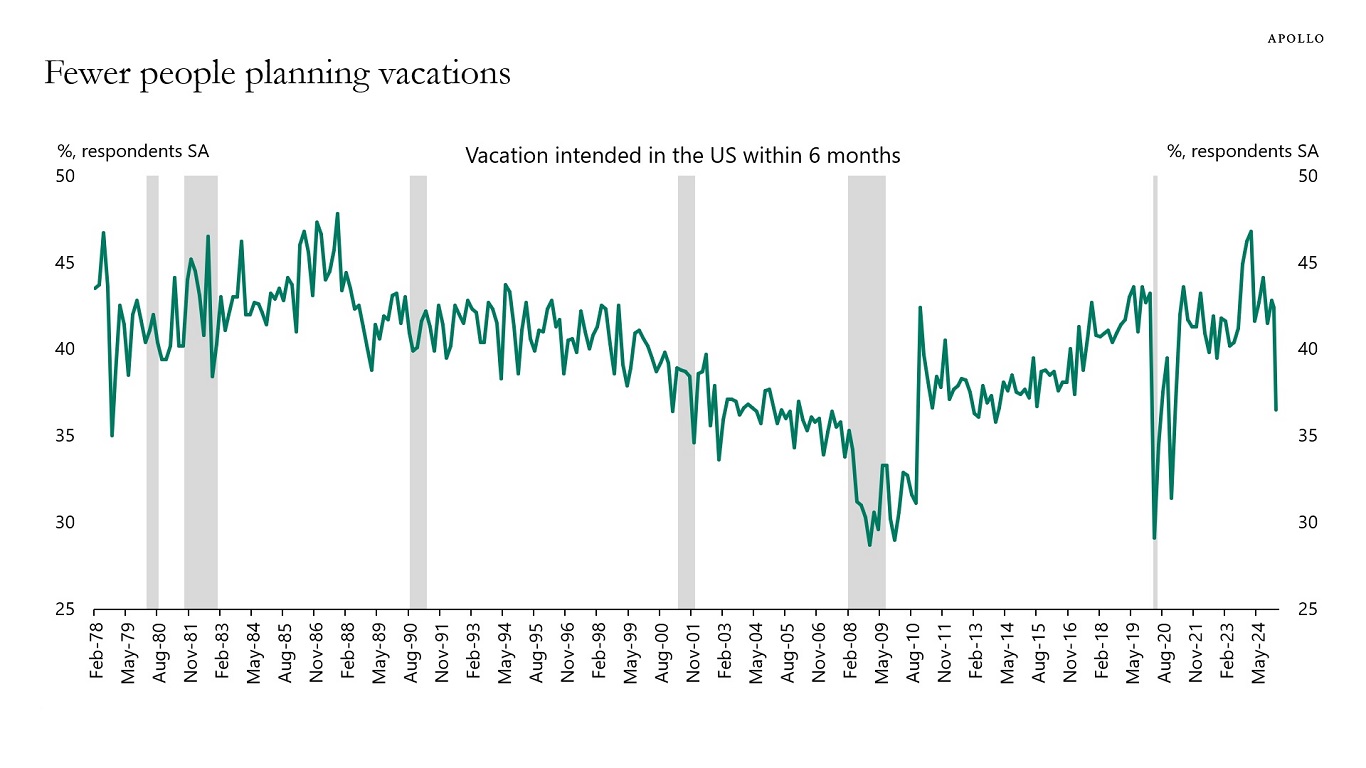
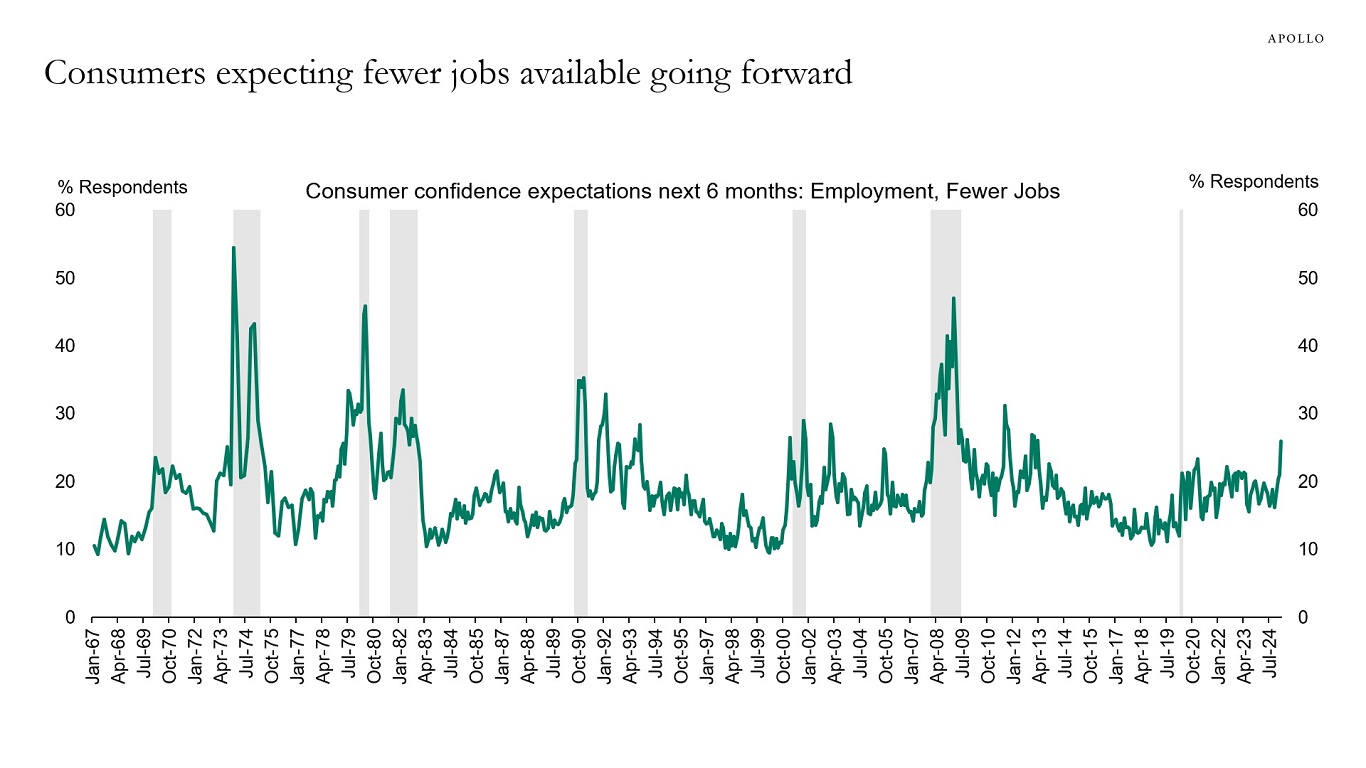
What characterizes a wait-and-see economy is that consumers and firms are more cautious about spending decisions. Consumers are more reluctant to plan vacations, to buy cars, and to buy new washers and dryers. Similarly, firms are more reluctant to hire and more reluctant to do capex.

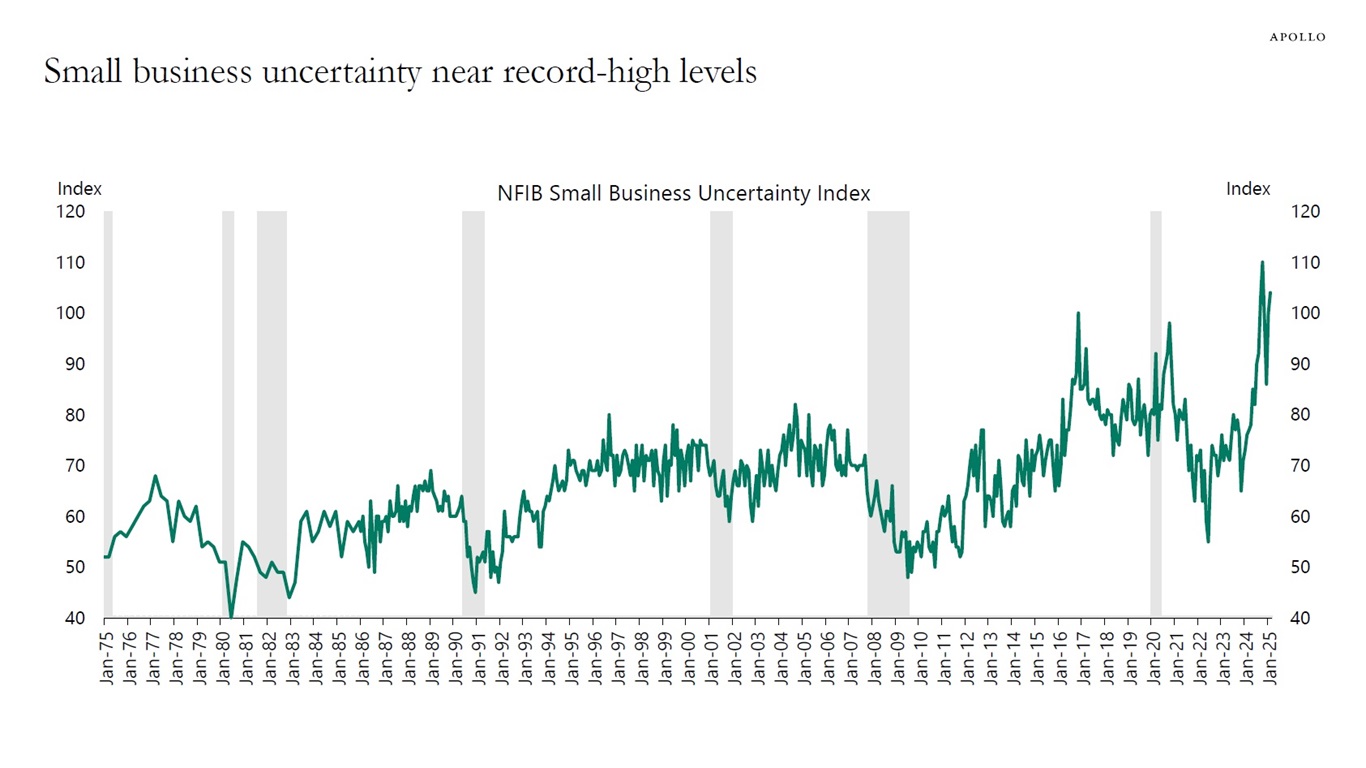
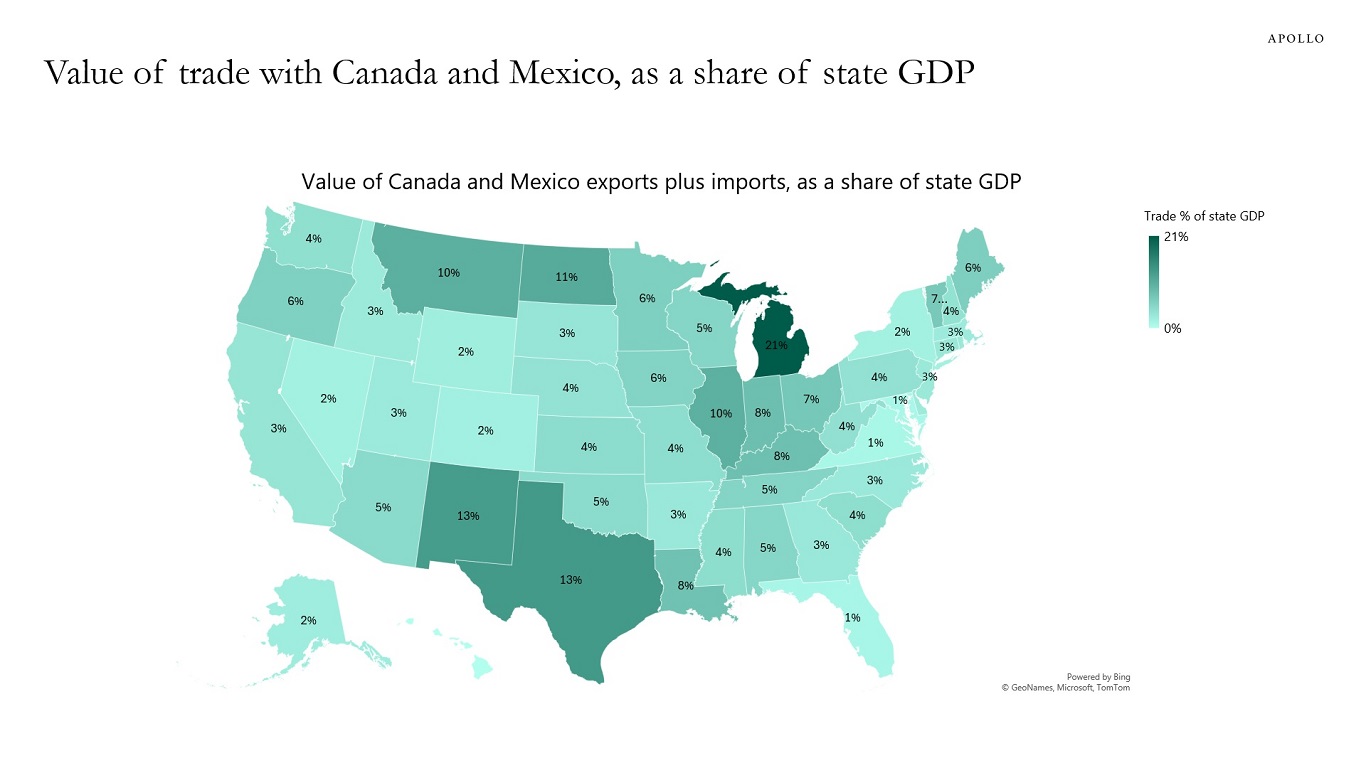
The wait-and-see economy is no longer just for companies directly involved in trade with Canada and Mexico. Uncertainty for small businesses is near all-time high levels. This is a problem because small businesses are the foundation of the economy, accounting for more than 80% of total US employment, see the first chart below.

Markets are not yet pricing in the coming slowdown in the hard data. The spread between CCC and single-B has only widened modestly and is still significantly tighter than where it was during the summer of 2022—when the economy was doing just fine—see the second chart. In a slowdown scenario, investors would start to migrate to higher-quality names.

The bottom line is that a wait-and-see economy eventually leads to a slowdown in the hard data. And markets should prepare for that scenario.

Small businesses account for more than 80% of total US employment
Source: Bloomberg, BLS, Apollo Chief Economist
The spread between CCC and single-B has only widened modestly
Source: Bloomberg, ICE BofA, Apollo Chief Economist

Download high-res charts

Recent Posts

  • Strong Technical Demand for Credit
  • Fiscal Situation in Germany vs. Spain
  • Hedge Fund Leverage Rising Rapidly
  • The Financing Gap in Sports: Unlocking a $2.5 Trillion Opportunity
  • The US Retirement Crisis

Recent Comments

No comments to show.

Archives

  • December 2025
  • November 2025
  • October 2025
  • September 2025
  • August 2025
  • July 2025
  • June 2025
  • May 2025
  • April 2025
  • March 2025
  • February 2025
  • January 2025
  • December 2024
  • November 2024
  • October 2024
  • September 2024
  • August 2024
  • July 2024
  • June 2024
  • May 2024
  • April 2024
  • March 2024
  • February 2024
  • January 2024
  • December 2023
  • November 2023
  • October 2023
  • September 2023
  • August 2023
  • July 2023
  • June 2023
  • May 2023
  • April 2023
  • March 2023
  • February 2023
  • January 2023
  • December 2022
  • November 2022
  • October 2022
  • September 2022
  • August 2022
  • July 2022
  • June 2022
  • May 2022
  • April 2022
  • March 2022
  • February 2022
  • January 2022
  • December 2021
  • November 2021

Categories

  • Apollo Answers
  • Course Introductions
  • Economic Intelligence
  • Hide from Wordpress Search
  • Investment Knowledge
  • Perspectives
  • Redirecting
  • The Daily Spark
  • The View from Apollo
  • The Weekly Brief
  • Uncategorized
  • White Papers

Small Business Uncertainty Near Record-High Levels

The February NFIB survey of small businesses shows that business uncertainty is near the highest levels since the survey started in the 1970s, see chart below.

Small business uncertainty near record-high levels
Source: NFIB, Bloomberg, Apollo Chief Economist

Download high-res chart

Recent Posts

  • Strong Technical Demand for Credit
  • Fiscal Situation in Germany vs. Spain
  • Hedge Fund Leverage Rising Rapidly
  • The Financing Gap in Sports: Unlocking a $2.5 Trillion Opportunity
  • The US Retirement Crisis

Recent Comments

No comments to show.

Archives

  • December 2025
  • November 2025
  • October 2025
  • September 2025
  • August 2025
  • July 2025
  • June 2025
  • May 2025
  • April 2025
  • March 2025
  • February 2025
  • January 2025
  • December 2024
  • November 2024
  • October 2024
  • September 2024
  • August 2024
  • July 2024
  • June 2024
  • May 2024
  • April 2024
  • March 2024
  • February 2024
  • January 2024
  • December 2023
  • November 2023
  • October 2023
  • September 2023
  • August 2023
  • July 2023
  • June 2023
  • May 2023
  • April 2023
  • March 2023
  • February 2023
  • January 2023
  • December 2022
  • November 2022
  • October 2022
  • September 2022
  • August 2022
  • July 2022
  • June 2022
  • May 2022
  • April 2022
  • March 2022
  • February 2022
  • January 2022
  • December 2021
  • November 2021

Categories

  • Apollo Answers
  • Course Introductions
  • Economic Intelligence
  • Hide from Wordpress Search
  • Investment Knowledge
  • Perspectives
  • Redirecting
  • The Daily Spark
  • The View from Apollo
  • The Weekly Brief
  • Uncategorized
  • White Papers

Significant Manufacturing Capacity in China

Sixty-seven percent of global manufacturing capacity for electric vehicles is in China.

Similarly, most manufacturing capacity for batteries, solar, and wind is also in China, see chart below.

Most manufacturing capacity is in China
Note: Data for 2023. RoW = Rest of World. “Electric cars” values are calculated based on 2023 production numbers, adjusted according to the utilization rates of car assembly plants in the region. Source: IEA analysis based on IEA (2024a) and IEA (2023b), Apollo Chief Economist

Download high-res chart

Recent Posts

  • Strong Technical Demand for Credit
  • Fiscal Situation in Germany vs. Spain
  • Hedge Fund Leverage Rising Rapidly
  • The Financing Gap in Sports: Unlocking a $2.5 Trillion Opportunity
  • The US Retirement Crisis

Recent Comments

No comments to show.

Archives

  • December 2025
  • November 2025
  • October 2025
  • September 2025
  • August 2025
  • July 2025
  • June 2025
  • May 2025
  • April 2025
  • March 2025
  • February 2025
  • January 2025
  • December 2024
  • November 2024
  • October 2024
  • September 2024
  • August 2024
  • July 2024
  • June 2024
  • May 2024
  • April 2024
  • March 2024
  • February 2024
  • January 2024
  • December 2023
  • November 2023
  • October 2023
  • September 2023
  • August 2023
  • July 2023
  • June 2023
  • May 2023
  • April 2023
  • March 2023
  • February 2023
  • January 2023
  • December 2022
  • November 2022
  • October 2022
  • September 2022
  • August 2022
  • July 2022
  • June 2022
  • May 2022
  • April 2022
  • March 2022
  • February 2022
  • January 2022
  • December 2021
  • November 2021

Categories

  • Apollo Answers
  • Course Introductions
  • Economic Intelligence
  • Hide from Wordpress Search
  • Investment Knowledge
  • Perspectives
  • Redirecting
  • The Daily Spark
  • The View from Apollo
  • The Weekly Brief
  • Uncategorized
  • White Papers
The View from Apollo - A New Podcast Series

Beyond 60/40: Private Assets in an Era of High Public Valuations

Listen to Apollo Chief Economist Torsten Slok speak with Matt O’Mara, Apollo Partner and co-head of Apollo Aligned Alternatives, about how a combination of expensive public assets, recalcitrant inflation, and higher-for-longer interest rates could be creating new challenges for 60/40 portfolios and an attractive entry point to private markets.

Recent Posts

  • Strong Technical Demand for Credit
  • Fiscal Situation in Germany vs. Spain
  • Hedge Fund Leverage Rising Rapidly
  • The Financing Gap in Sports: Unlocking a $2.5 Trillion Opportunity
  • The US Retirement Crisis

Recent Comments

No comments to show.

Archives

  • December 2025
  • November 2025
  • October 2025
  • September 2025
  • August 2025
  • July 2025
  • June 2025
  • May 2025
  • April 2025
  • March 2025
  • February 2025
  • January 2025
  • December 2024
  • November 2024
  • October 2024
  • September 2024
  • August 2024
  • July 2024
  • June 2024
  • May 2024
  • April 2024
  • March 2024
  • February 2024
  • January 2024
  • December 2023
  • November 2023
  • October 2023
  • September 2023
  • August 2023
  • July 2023
  • June 2023
  • May 2023
  • April 2023
  • March 2023
  • February 2023
  • January 2023
  • December 2022
  • November 2022
  • October 2022
  • September 2022
  • August 2022
  • July 2022
  • June 2022
  • May 2022
  • April 2022
  • March 2022
  • February 2022
  • January 2022
  • December 2021
  • November 2021

Categories

  • Apollo Answers
  • Course Introductions
  • Economic Intelligence
  • Hide from Wordpress Search
  • Investment Knowledge
  • Perspectives
  • Redirecting
  • The Daily Spark
  • The View from Apollo
  • The Weekly Brief
  • Uncategorized
  • White Papers

Medicaid Coverage by State

Medicaid provides healthcare coverage to low-income families (generally making less than $25,000 a year), and roughly 20% of the US population, or about 72 million people, are covered by Medicaid.

Percentage of the population covered by Medicaid
Note: Data for 2023. Source: KFF Health Insurance Coverage of the Total Population, Apollo Chief Economist

Download high-res chart

Recent Posts

  • Strong Technical Demand for Credit
  • Fiscal Situation in Germany vs. Spain
  • Hedge Fund Leverage Rising Rapidly
  • The Financing Gap in Sports: Unlocking a $2.5 Trillion Opportunity
  • The US Retirement Crisis

Recent Comments

No comments to show.

Archives

  • December 2025
  • November 2025
  • October 2025
  • September 2025
  • August 2025
  • July 2025
  • June 2025
  • May 2025
  • April 2025
  • March 2025
  • February 2025
  • January 2025
  • December 2024
  • November 2024
  • October 2024
  • September 2024
  • August 2024
  • July 2024
  • June 2024
  • May 2024
  • April 2024
  • March 2024
  • February 2024
  • January 2024
  • December 2023
  • November 2023
  • October 2023
  • September 2023
  • August 2023
  • July 2023
  • June 2023
  • May 2023
  • April 2023
  • March 2023
  • February 2023
  • January 2023
  • December 2022
  • November 2022
  • October 2022
  • September 2022
  • August 2022
  • July 2022
  • June 2022
  • May 2022
  • April 2022
  • March 2022
  • February 2022
  • January 2022
  • December 2021
  • November 2021

Categories

  • Apollo Answers
  • Course Introductions
  • Economic Intelligence
  • Hide from Wordpress Search
  • Investment Knowledge
  • Perspectives
  • Redirecting
  • The Daily Spark
  • The View from Apollo
  • The Weekly Brief
  • Uncategorized
  • White Papers

What Is the Mar-a-Lago Accord?

The US dollar is the global reserve currency because America is the most dynamic economy in the world, and the US provides stability and security. As a result, there is upward pressure on the US dollar because everyone wants to own the world’s safest asset.

This safe-haven upward pressure on the dollar overwhelms the negative impact on the dollar coming from the US current account deficit.

With safe asset flows putting constant upward pressure on the dollar, there is a need for a deal—a Mar-a-Lago Accord—to put downward pressure on the US dollar to increase US exports and bring manufacturing jobs back to the US.

The Mar-a-Largo Accord is the idea that the US will give the G7, the Middle East, and Latin America security and access to US markets, and in return, these countries agree to intervene to depreciate the US dollar, grow the size of the US manufacturing sector, and solve the US fiscal debt problems by swapping existing US government debt with new US Treasury century bonds.

In short, the idea is that the US provides the world with security, and in return, the rest of the world helps push the dollar down in order to grow the US manufacturing sector.

There are two instruments for the US to achieve this goal. The first tool is tariffs, which also have the benefit that tariffs raise the tax revenue for the US government. The second tool is a sovereign wealth fund to likely accumulate foreign currencies such as EUR, JPY, and RMB to intervene in FX markets to help put additional downward pressure on the US dollar.

For markets, this raises three questions:

1) The changes that are required to existing US manufacturing production, including eliminating Canada and Mexico from all auto supply chains, will take many years. Can the US achieve the long-term gain without too much short-term pain?

2) Globalization has for decades put downward pressure on US inflation. Will a more segmented global economy with a much bigger manufacturing sector in the US put too much upward pressure on US inflation, given the higher wage costs in the US than in many other countries?

3) With tariffs being implemented, the rest of the world may over time begin to decrease its reliance on US markets and also increase their own defense spending. Under such a scenario, what are the incentives for the rest of the world to sign a Mar-a-Lago Accord?

What is the Mar-a-Lago Accord?

The US gives the rest of the world:
1. Security
2. Access to US markets/US consumers

The US gets from the rest of the world:
1. A weaker dollar
2. A bigger manufacturing sector
3. Existing US Treasury debt swapped to new Treasury century bonds

Two tools to achieve such an outcome:
1.Tariffs to grow the US manufacturing sector and to exert pressure on countries to sign the Mar-a-Lago Accord
2.A US sovereign wealth fund that can be used to buy foreign currencies to depreciate the dollar
Source: Apollo Chief Economist

Download high-res chart

Recent Posts

  • Strong Technical Demand for Credit
  • Fiscal Situation in Germany vs. Spain
  • Hedge Fund Leverage Rising Rapidly
  • The Financing Gap in Sports: Unlocking a $2.5 Trillion Opportunity
  • The US Retirement Crisis

Recent Comments

No comments to show.

Archives

  • December 2025
  • November 2025
  • October 2025
  • September 2025
  • August 2025
  • July 2025
  • June 2025
  • May 2025
  • April 2025
  • March 2025
  • February 2025
  • January 2025
  • December 2024
  • November 2024
  • October 2024
  • September 2024
  • August 2024
  • July 2024
  • June 2024
  • May 2024
  • April 2024
  • March 2024
  • February 2024
  • January 2024
  • December 2023
  • November 2023
  • October 2023
  • September 2023
  • August 2023
  • July 2023
  • June 2023
  • May 2023
  • April 2023
  • March 2023
  • February 2023
  • January 2023
  • December 2022
  • November 2022
  • October 2022
  • September 2022
  • August 2022
  • July 2022
  • June 2022
  • May 2022
  • April 2022
  • March 2022
  • February 2022
  • January 2022
  • December 2021
  • November 2021

Categories

  • Apollo Answers
  • Course Introductions
  • Economic Intelligence
  • Hide from Wordpress Search
  • Investment Knowledge
  • Perspectives
  • Redirecting
  • The Daily Spark
  • The View from Apollo
  • The Weekly Brief
  • Uncategorized
  • White Papers

Adjustment Costs Associated with Changing Policies

There are adjustment costs associated with changing trade policy and changing the size of the government sector, see chart below. The immediate question for markets is how big the short-term pain will be, see chart below.

DOGE and tariffs: Short-term pain, long-term gain?
Source: Apollo Chief Economist

Download high-res chart

Recent Posts

  • Strong Technical Demand for Credit
  • Fiscal Situation in Germany vs. Spain
  • Hedge Fund Leverage Rising Rapidly
  • The Financing Gap in Sports: Unlocking a $2.5 Trillion Opportunity
  • The US Retirement Crisis

Recent Comments

No comments to show.

Archives

  • December 2025
  • November 2025
  • October 2025
  • September 2025
  • August 2025
  • July 2025
  • June 2025
  • May 2025
  • April 2025
  • March 2025
  • February 2025
  • January 2025
  • December 2024
  • November 2024
  • October 2024
  • September 2024
  • August 2024
  • July 2024
  • June 2024
  • May 2024
  • April 2024
  • March 2024
  • February 2024
  • January 2024
  • December 2023
  • November 2023
  • October 2023
  • September 2023
  • August 2023
  • July 2023
  • June 2023
  • May 2023
  • April 2023
  • March 2023
  • February 2023
  • January 2023
  • December 2022
  • November 2022
  • October 2022
  • September 2022
  • August 2022
  • July 2022
  • June 2022
  • May 2022
  • April 2022
  • March 2022
  • February 2022
  • January 2022
  • December 2021
  • November 2021

Categories

  • Apollo Answers
  • Course Introductions
  • Economic Intelligence
  • Hide from Wordpress Search
  • Investment Knowledge
  • Perspectives
  • Redirecting
  • The Daily Spark
  • The View from Apollo
  • The Weekly Brief
  • Uncategorized
  • White Papers

Investors Aggressively Buying Downside Protection

Investors are getting very worried about the downside risks to their portfolios. VIX call volume buying is near record-high levels, and S&P 500 put volume buying is near record-high levels, see charts below.

VIX call volume buying is near record-high levels
Source: Bloomberg, Apollo Chief Economist
S&P 500 put volume buying is near record-high levels
Source: Bloomberg, Apollo Chief Economist

Download high-res charts

Recent Posts

  • Strong Technical Demand for Credit
  • Fiscal Situation in Germany vs. Spain
  • Hedge Fund Leverage Rising Rapidly
  • The Financing Gap in Sports: Unlocking a $2.5 Trillion Opportunity
  • The US Retirement Crisis

Recent Comments

No comments to show.

Archives

  • December 2025
  • November 2025
  • October 2025
  • September 2025
  • August 2025
  • July 2025
  • June 2025
  • May 2025
  • April 2025
  • March 2025
  • February 2025
  • January 2025
  • December 2024
  • November 2024
  • October 2024
  • September 2024
  • August 2024
  • July 2024
  • June 2024
  • May 2024
  • April 2024
  • March 2024
  • February 2024
  • January 2024
  • December 2023
  • November 2023
  • October 2023
  • September 2023
  • August 2023
  • July 2023
  • June 2023
  • May 2023
  • April 2023
  • March 2023
  • February 2023
  • January 2023
  • December 2022
  • November 2022
  • October 2022
  • September 2022
  • August 2022
  • July 2022
  • June 2022
  • May 2022
  • April 2022
  • March 2022
  • February 2022
  • January 2022
  • December 2021
  • November 2021

Categories

  • Apollo Answers
  • Course Introductions
  • Economic Intelligence
  • Hide from Wordpress Search
  • Investment Knowledge
  • Perspectives
  • Redirecting
  • The Daily Spark
  • The View from Apollo
  • The Weekly Brief
  • Uncategorized
  • White Papers

The States Most Impacted by Tariffs on Canada and Mexico

The chart below shows Canada and Mexico imports plus exports as a share of state GDP, and the states that are most impacted by the trade war with Canada and Mexico are Michigan, Texas, New Mexico, North Dakota, Montana, Illinois, Kentucky, Indiana, Louisiana, and Ohio.

Value of trade with Canada and Mexico, as a share of state GDP
Note: Data for 2024. Source: International Trade Administration, BEA, Apollo Chief Economist

Download high-res chart

Recent Posts

  • Strong Technical Demand for Credit
  • Fiscal Situation in Germany vs. Spain
  • Hedge Fund Leverage Rising Rapidly
  • The Financing Gap in Sports: Unlocking a $2.5 Trillion Opportunity
  • The US Retirement Crisis

Recent Comments

No comments to show.

Archives

  • December 2025
  • November 2025
  • October 2025
  • September 2025
  • August 2025
  • July 2025
  • June 2025
  • May 2025
  • April 2025
  • March 2025
  • February 2025
  • January 2025
  • December 2024
  • November 2024
  • October 2024
  • September 2024
  • August 2024
  • July 2024
  • June 2024
  • May 2024
  • April 2024
  • March 2024
  • February 2024
  • January 2024
  • December 2023
  • November 2023
  • October 2023
  • September 2023
  • August 2023
  • July 2023
  • June 2023
  • May 2023
  • April 2023
  • March 2023
  • February 2023
  • January 2023
  • December 2022
  • November 2022
  • October 2022
  • September 2022
  • August 2022
  • July 2022
  • June 2022
  • May 2022
  • April 2022
  • March 2022
  • February 2022
  • January 2022
  • December 2021
  • November 2021

Categories

  • Apollo Answers
  • Course Introductions
  • Economic Intelligence
  • Hide from Wordpress Search
  • Investment Knowledge
  • Perspectives
  • Redirecting
  • The Daily Spark
  • The View from Apollo
  • The Weekly Brief
  • Uncategorized
  • White Papers

Short-Term Pain, Long-Term Gain?

There are adjustment costs associated with changing trade policy and changing the size of the government sector, and the immediate question for markets is how big the short-term pain will be.

  1. The impact on markets and the economy depends entirely on how long the 25% tariffs on Canada and Mexico are in place. If they are removed tomorrow or later this week, then the impact on the economy will be small. If they continue for months, then the negative impact will be more significant, especially to the auto sector.
  2. The bigger risk to markets is sentiment. We are already seeing consumer sentiment and corporate sentiment being impacted, see charts below. If policy uncertainty persists, consumers and firms may begin to hold back spending decisions. Combined with DOGE-driven layoffs, this will put upward pressure on the unemployment rate.
  3. From a Fed perspective, the biggest problem is that tariffs increase prices and hence inflation. That is why a trade war, by definition, is a stagflation shock: Higher prices and lower sales. If tariffs on Canada and Mexico continue for several months, then the Fed will focus on the rising unemployment rate and start cutting rates soon.

The biggest downside risk is that policy uncertainty could create a sudden stop in the economy where consumers stop buying cars, stop going to restaurants, and stop going on vacation, and companies stop hiring and stop doing capex. The employment report on Friday will be stale. The key indicator to watch over the coming weeks is jobless claims, which come out every Thursday at 8:30 am ET.

Fewer people planning vacations
Source: Conference Board, Bloomberg, Apollo Chief Economist
Consumers expecting fewer jobs available going forward
Source: Conference Board, Haver Analytics, Apollo Chief Economist
Corporate capital spending plans reversing
Source: Business Roundtable; NFIB; Federal Reserve Bank of Philadelphia, Dallas, New York, Kansas and Richmond; Apollo Chief Economist

Download high-res charts

Recent Posts

  • Strong Technical Demand for Credit
  • Fiscal Situation in Germany vs. Spain
  • Hedge Fund Leverage Rising Rapidly
  • The Financing Gap in Sports: Unlocking a $2.5 Trillion Opportunity
  • The US Retirement Crisis

Recent Comments

No comments to show.

Archives

  • December 2025
  • November 2025
  • October 2025
  • September 2025
  • August 2025
  • July 2025
  • June 2025
  • May 2025
  • April 2025
  • March 2025
  • February 2025
  • January 2025
  • December 2024
  • November 2024
  • October 2024
  • September 2024
  • August 2024
  • July 2024
  • June 2024
  • May 2024
  • April 2024
  • March 2024
  • February 2024
  • January 2024
  • December 2023
  • November 2023
  • October 2023
  • September 2023
  • August 2023
  • July 2023
  • June 2023
  • May 2023
  • April 2023
  • March 2023
  • February 2023
  • January 2023
  • December 2022
  • November 2022
  • October 2022
  • September 2022
  • August 2022
  • July 2022
  • June 2022
  • May 2022
  • April 2022
  • March 2022
  • February 2022
  • January 2022
  • December 2021
  • November 2021

Categories

  • Apollo Answers
  • Course Introductions
  • Economic Intelligence
  • Hide from Wordpress Search
  • Investment Knowledge
  • Perspectives
  • Redirecting
  • The Daily Spark
  • The View from Apollo
  • The Weekly Brief
  • Uncategorized
  • White Papers

Posts navigation

←Previous page Page 1 Page 2 Page 3 Page 4 Next page→
  • Privacy Notice
  • Terms of Use
  • Forward-Looking Statements
Apollo
© Apollo Global Management, Inc. All Rights Reserved.

The Apollo Academy is for informational and educational purposes only and nothing contained herein should be taken as investment advice or a recommendation to enter into any transaction. They are not an invitation by or on behalf of Apollo to any person to buy or sell any security or to adopt any investment strategy, and shall not form the basis of, nor may it accompany nor form part of, any right or contract to buy or sell any security or to adopt any investment strategy. There is no guarantee that the views and opinions expressed in this website will come to pass. For additional information, please see the disclaimers included in each piece of content or the legal page of our website here.