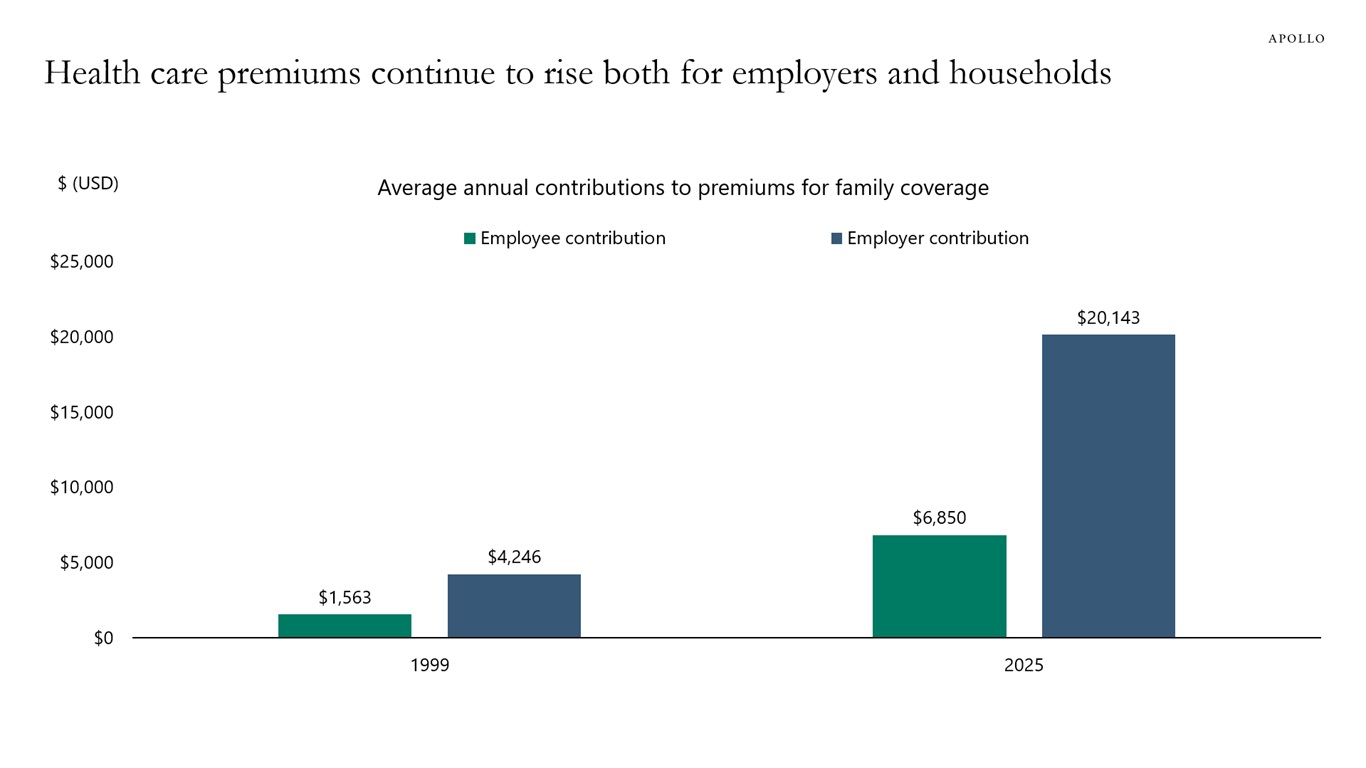
The average family in the US currently pays $6,850 annually for health insurance, and the average annual payment for employers is $20,143, see chart below.
That is a total annual cost for health insurance per family of $26,993


The average family in the US currently pays $6,850 annually for health insurance, and the average annual payment for employers is $20,143, see chart below.
That is a total annual cost for health insurance per family of $26,993
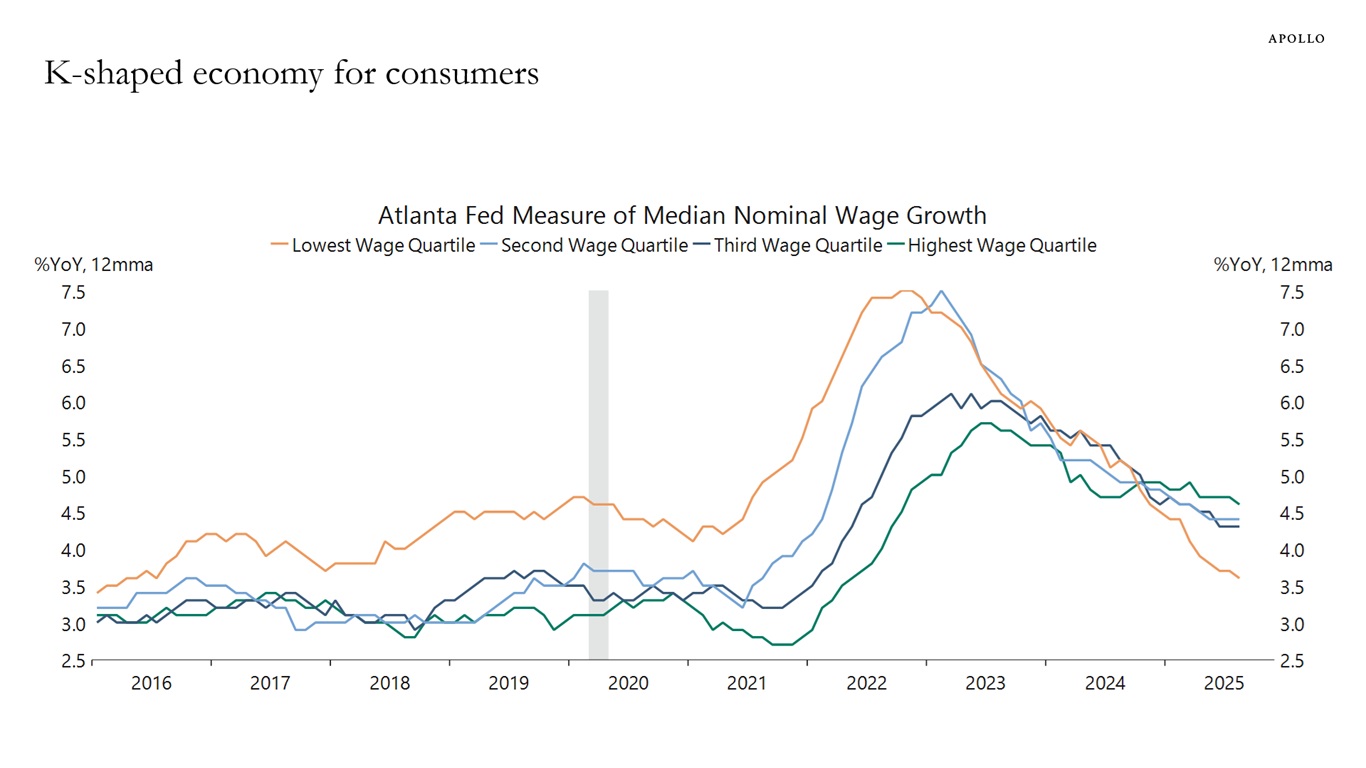
Before and during the pandemic, lower-income households experienced higher wage growth than other income groups. But that has changed over the past year, see chart below. Today, wage growth for low-income workers is significantly lower than wage growth for middle- and high-income workers.
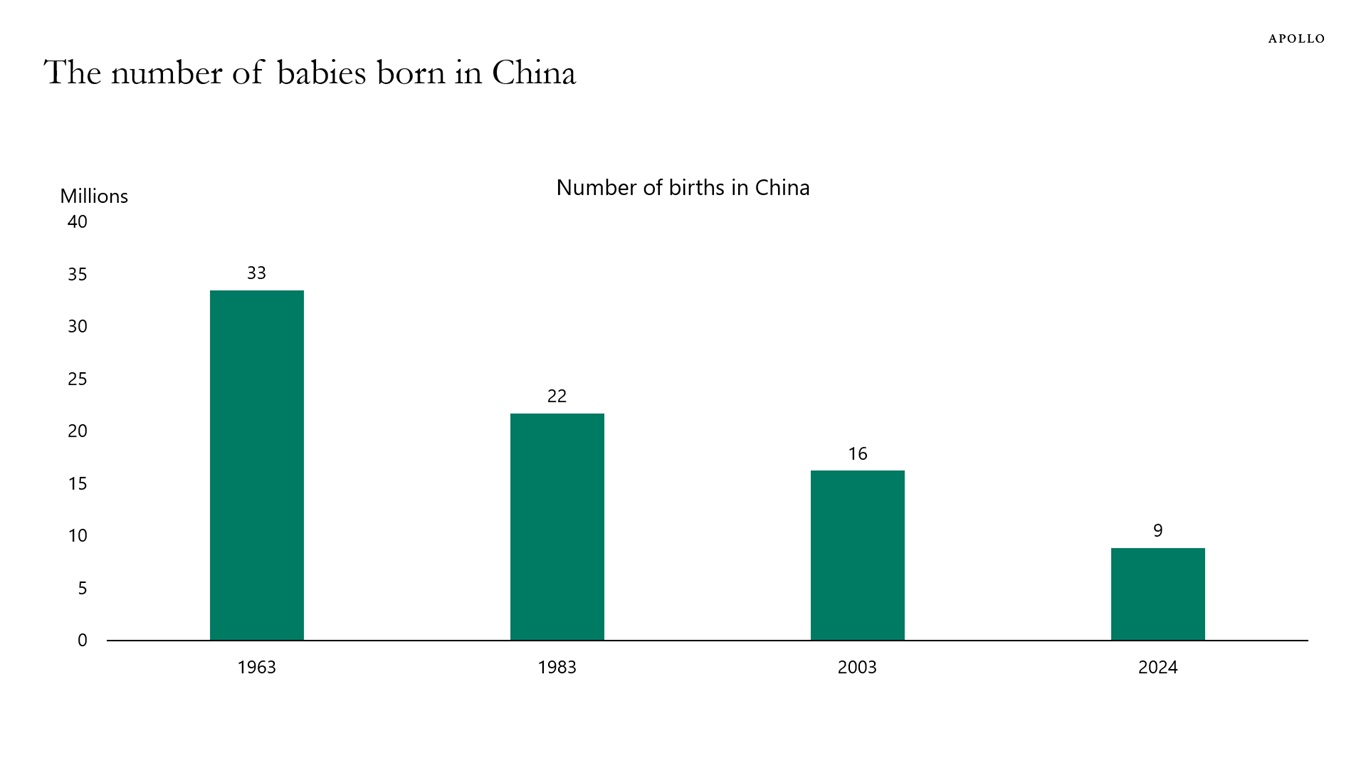
In 1963, 33 million babies were born in China. In 2024, there were 9 million, see chart below.
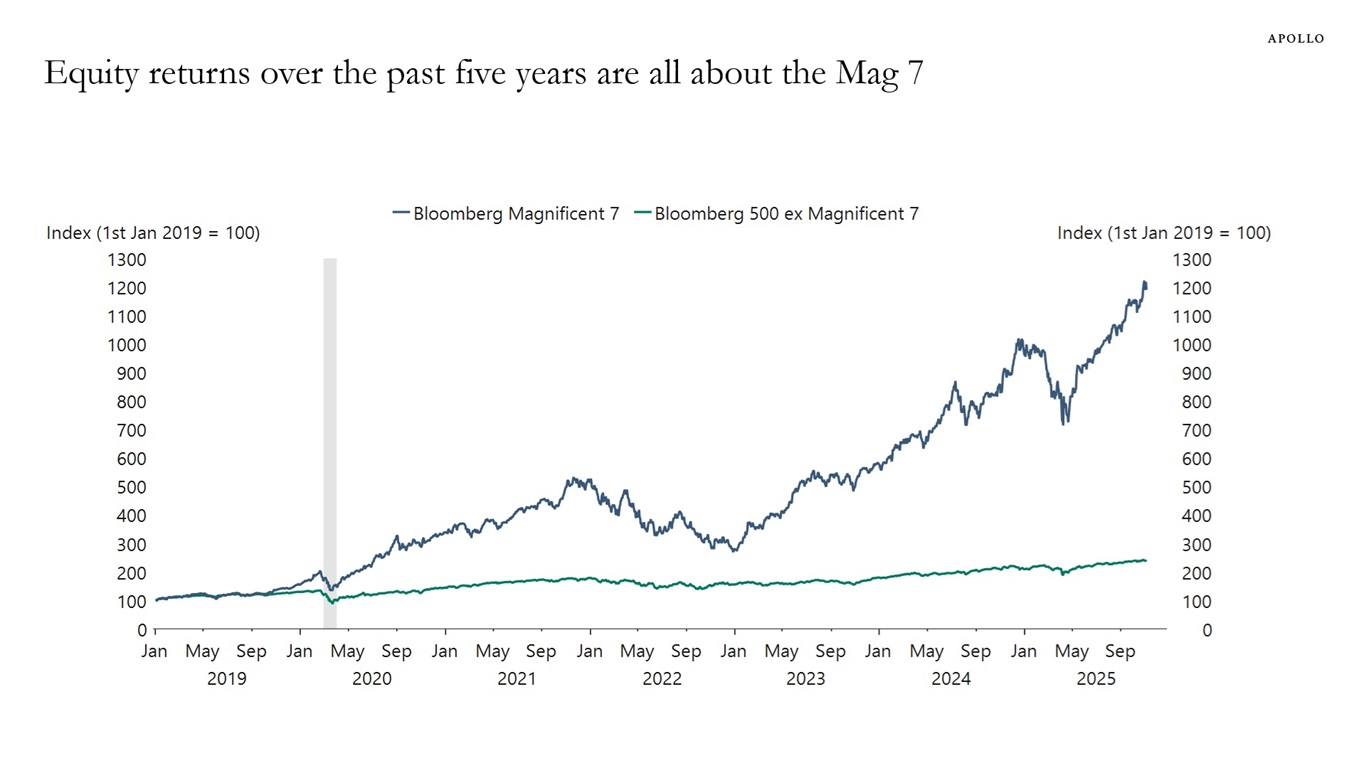
Equity returns over the past five years are all about the Magnificent Seven versus everyone else, see chart below.
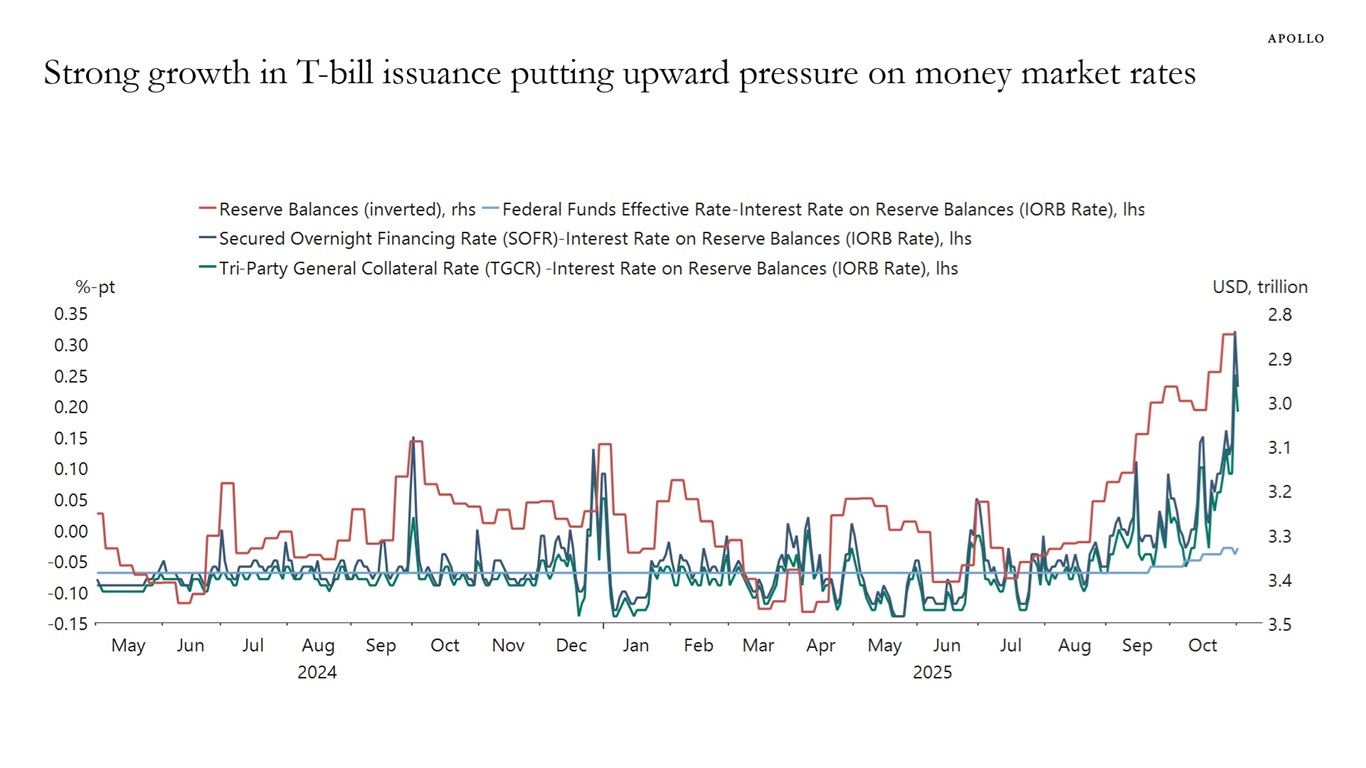
Fed balance sheet reduction and heavy T-bill issuance are putting upward pressure on spreads in money markets, see charts below.
The ongoing government shutdown has amplified this dynamic, as the Treasury General Account balance has risen with delayed federal spending, further draining reserves from the banking system.
With fewer reserves, funding markets face heightened competition for cash, pushing SOFR and TGCR above the IORB.
Money market funds shifting from the Fed’s reverse repo facility to higher-yielding assets, combined with year-end balance sheet constraints, are adding to the strain.
The bottom line is that the financial system is nearing the point where reserves are no longer ample. We are watching this development very closely because if rates volatility in funding markets persists, it could begin to have consequences for credit markets.
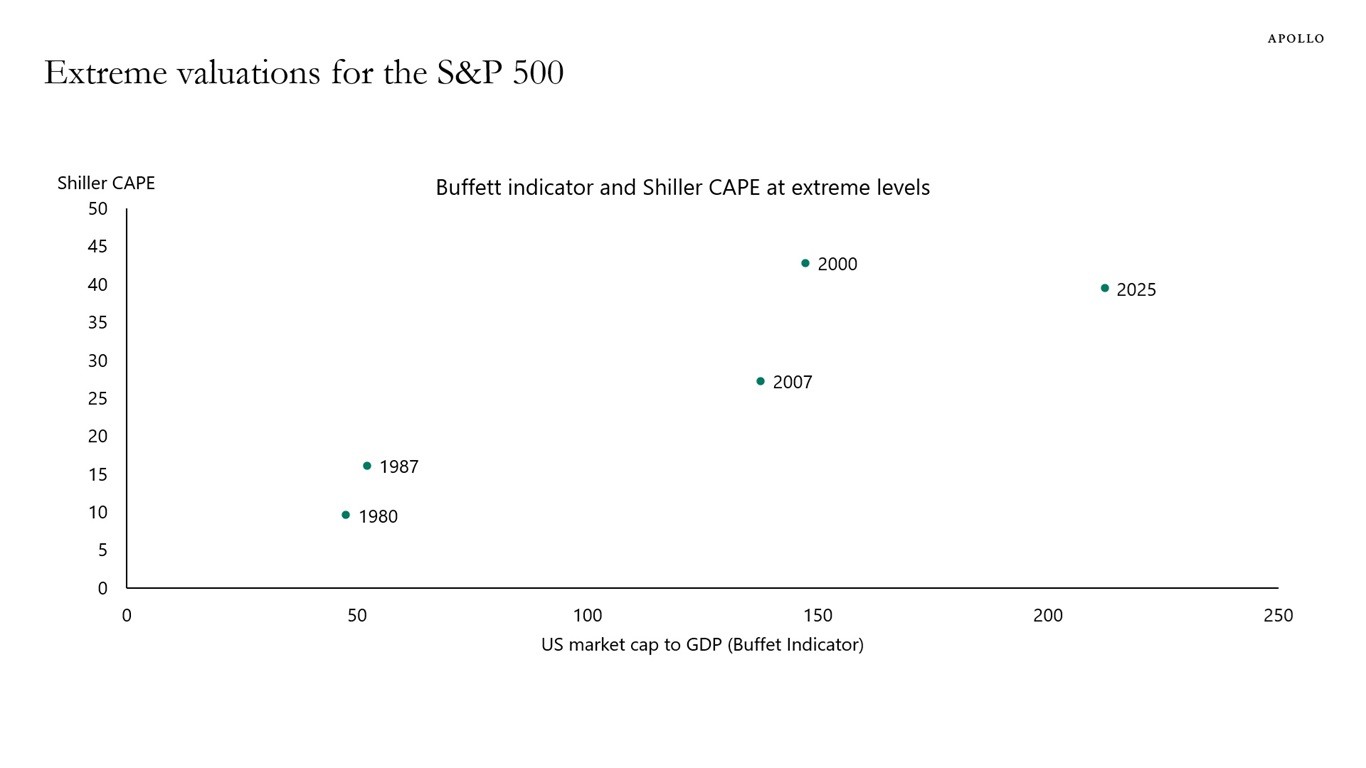
Plotting the Warren Buffet indicator (US stock market cap to GDP) versus the Shiller cyclically adjusted P/E ratio shows that the S&P 500 today is at historically extreme valuations, see chart below.
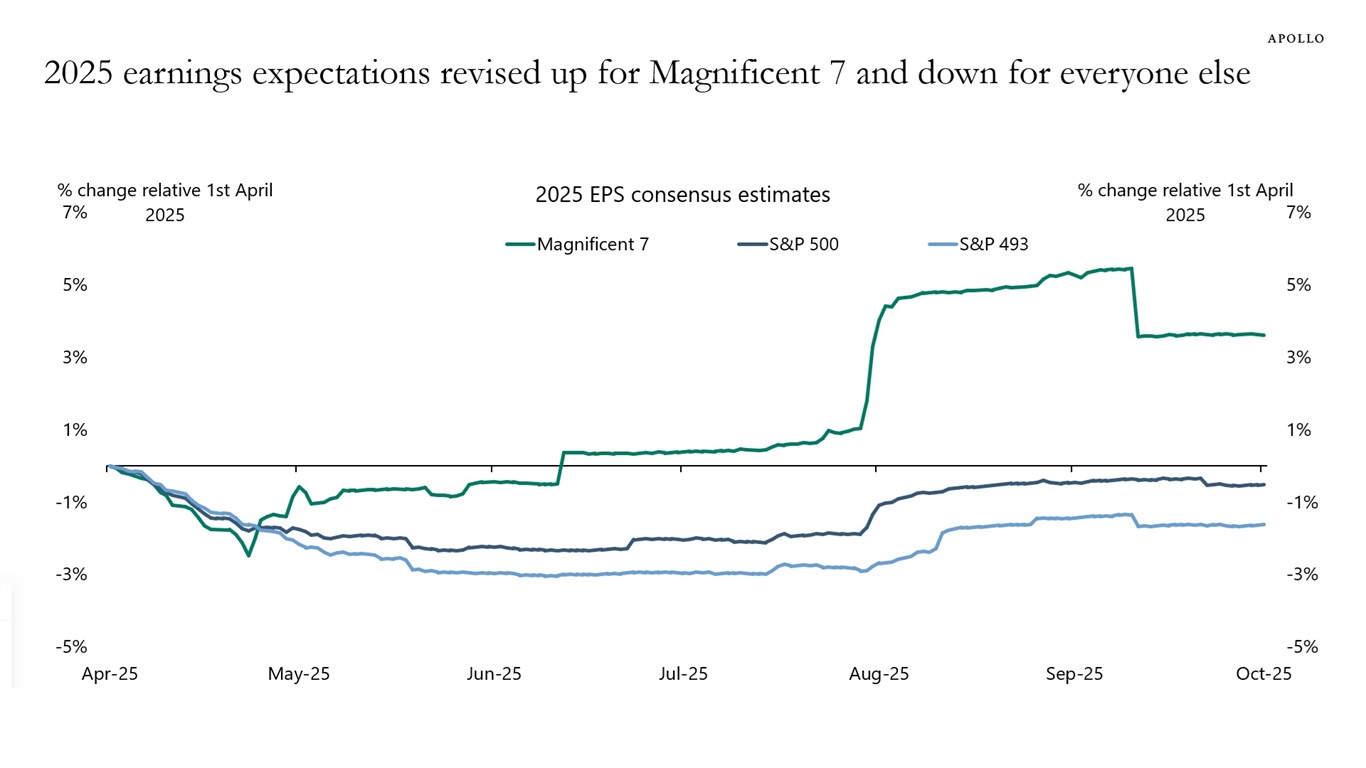
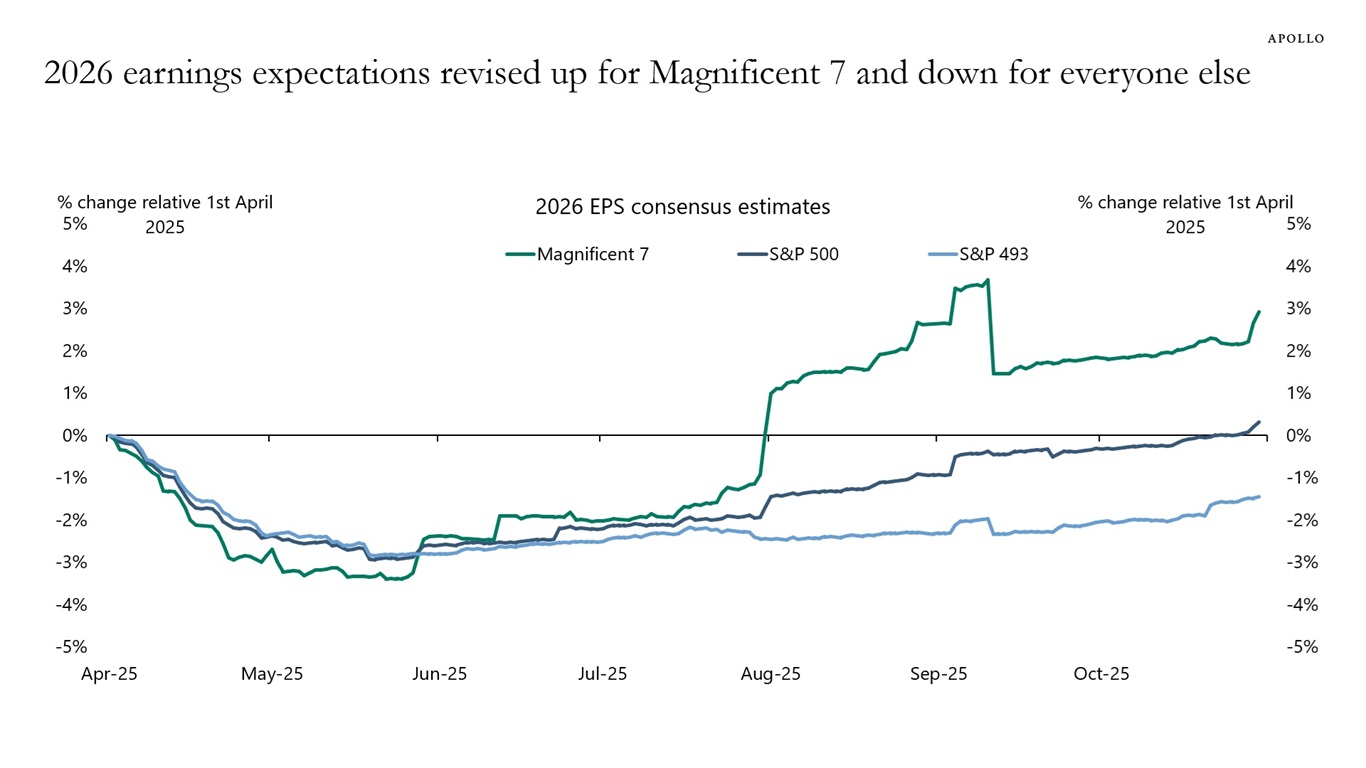
Since earlier this year, earnings expectations have increased for the Magnificent Seven and declined for the S&P 493, see charts below.
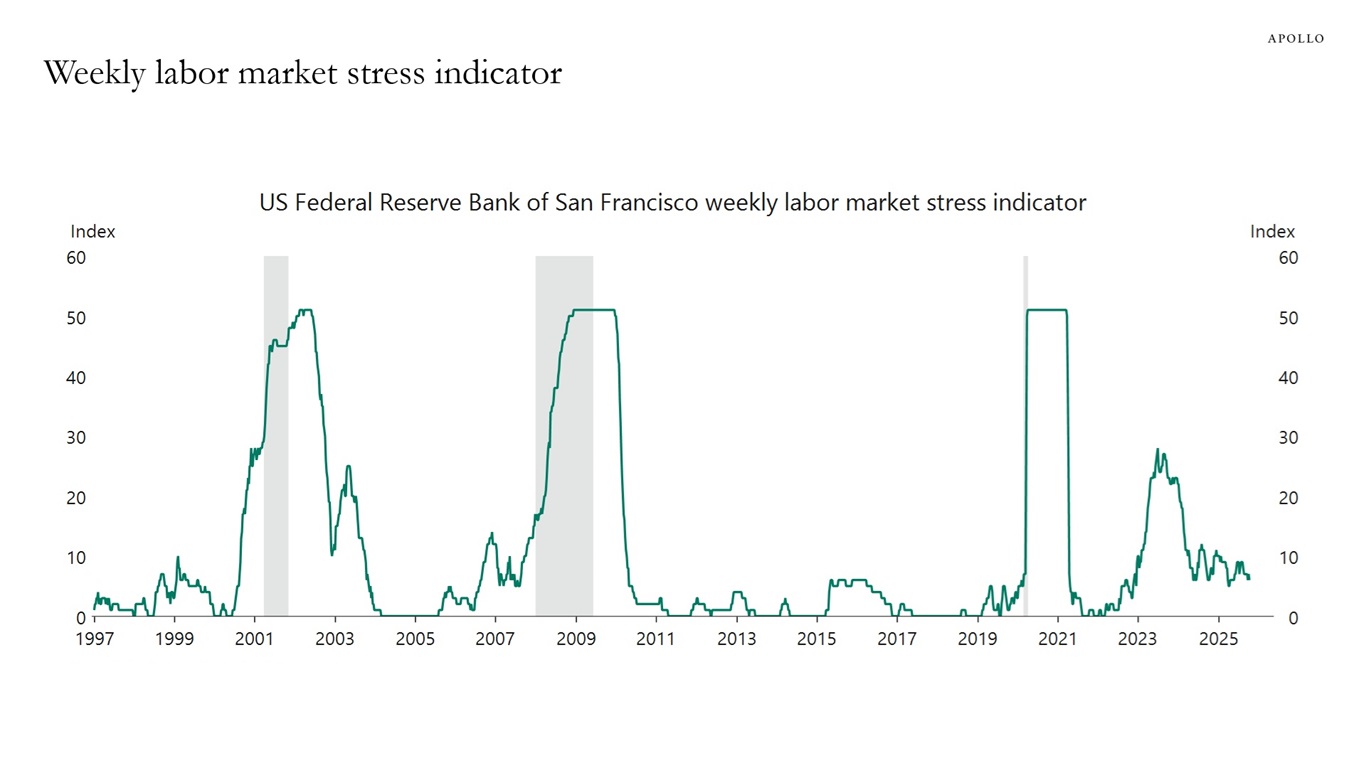
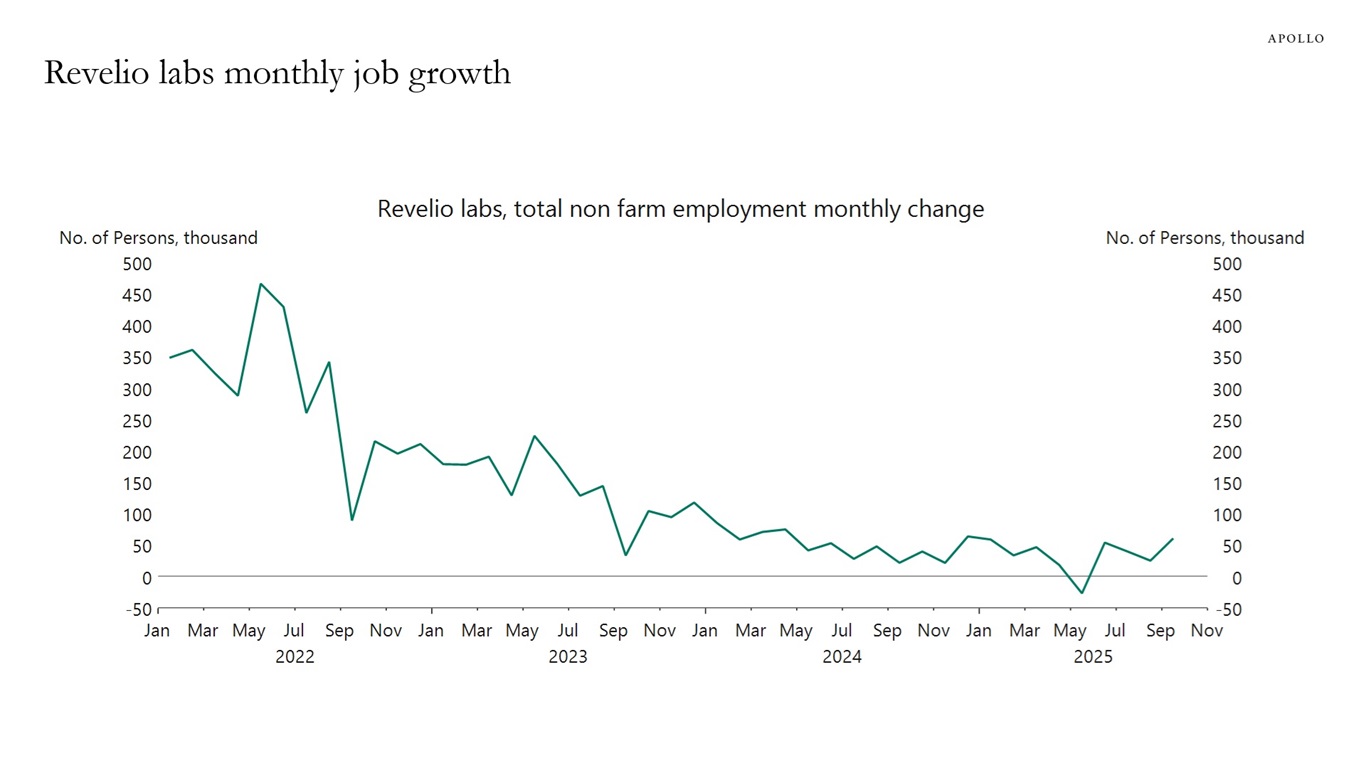
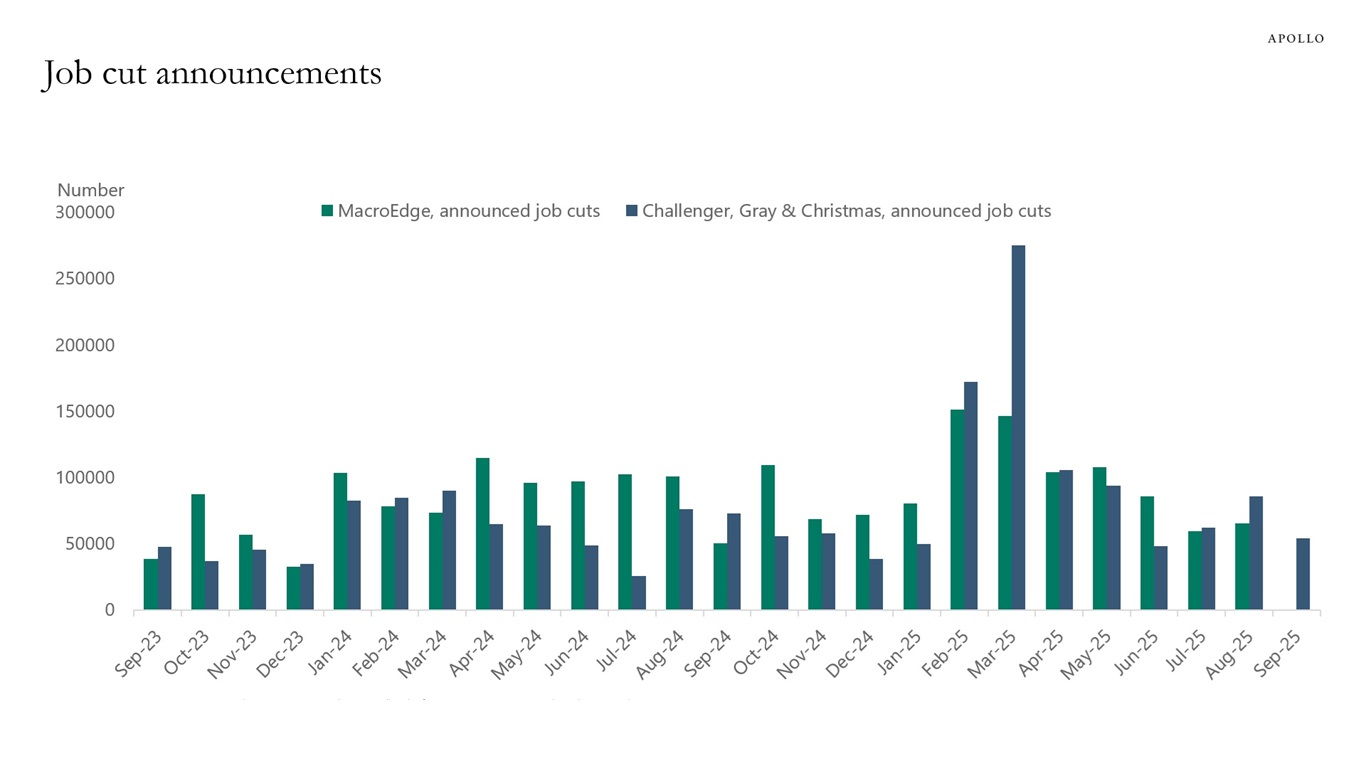
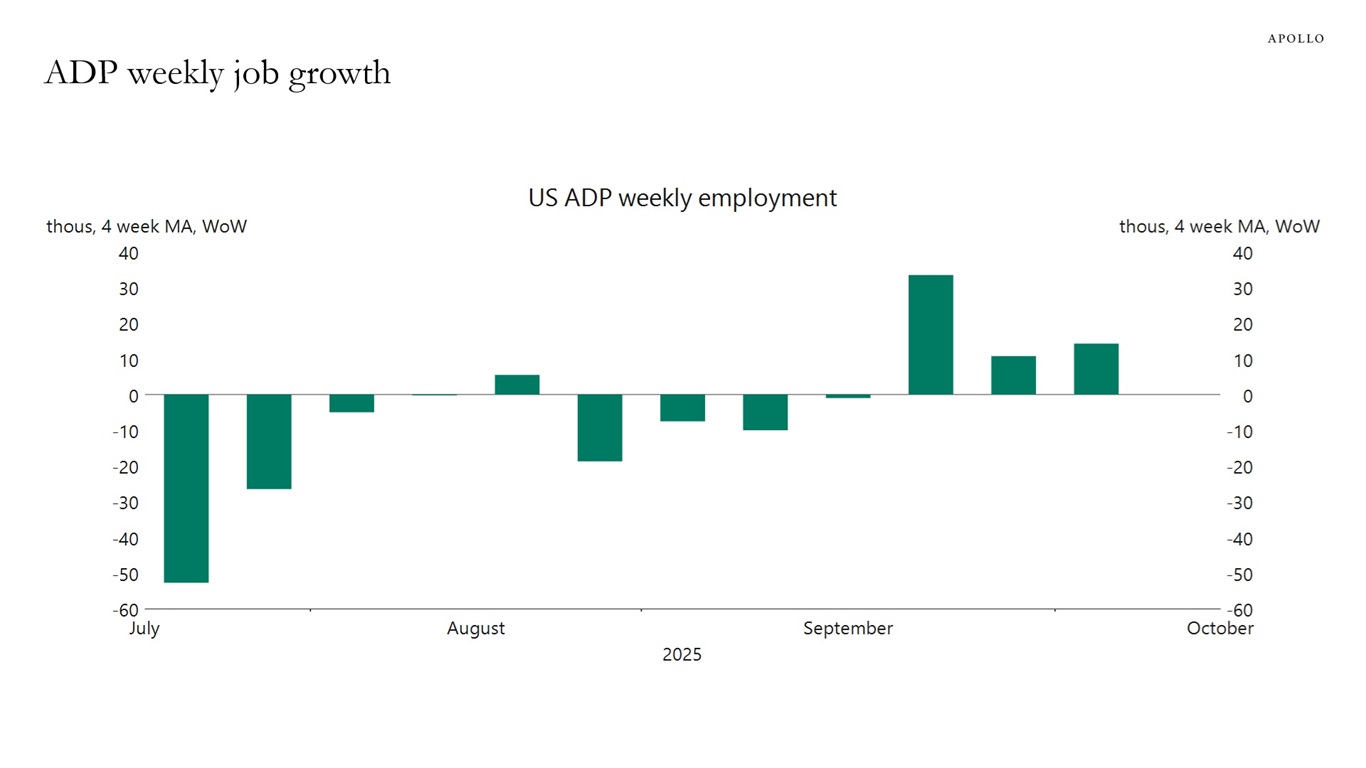
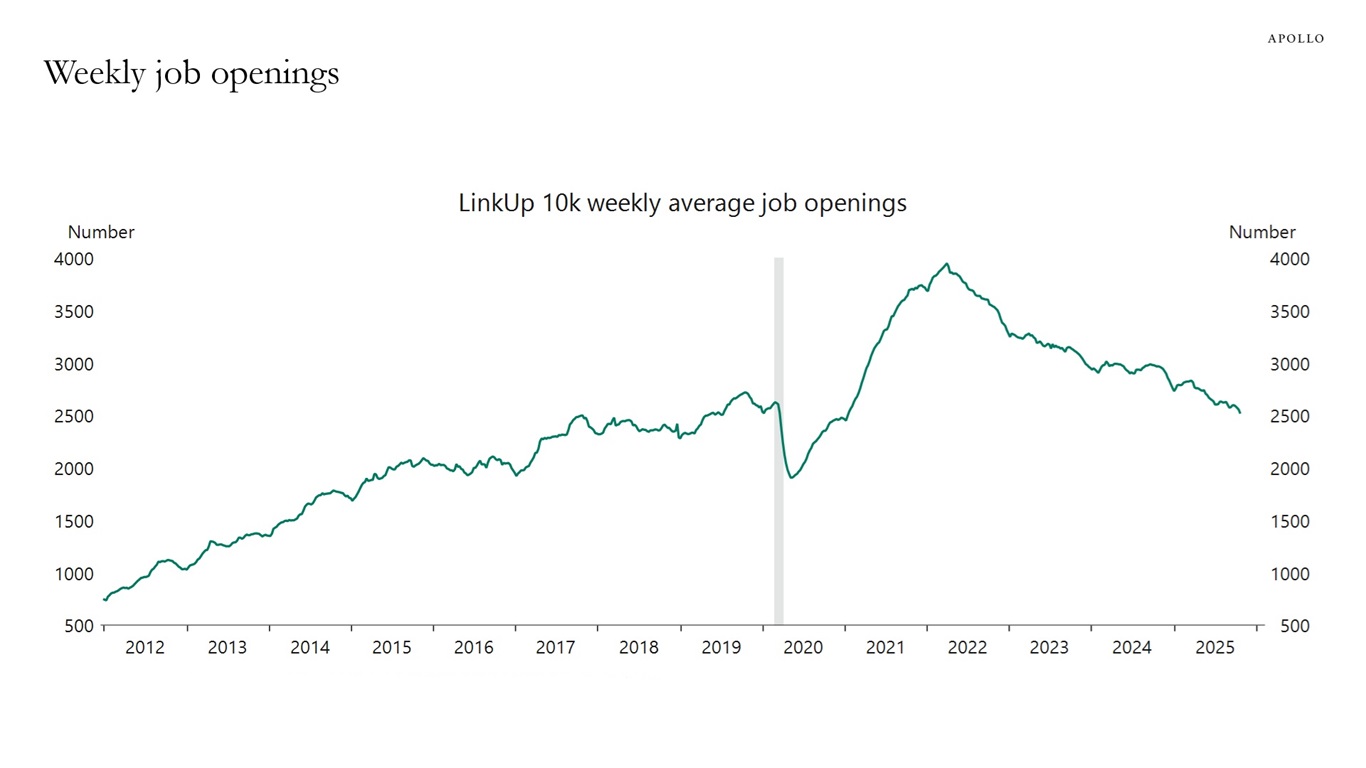
Alternative indicators from Revelio Labs, ADP, Challenger, MacroEdge, LinkUp, Indeed, Paychex, NFIB, San Francisco Fed and state-level jobless claims show a labor market that is still doing well.
Most importantly, there are no signs of a sudden rise in unemployment for cyclical reasons or AI reasons.
Our chart book with alternative indicators for the labor market is available here.
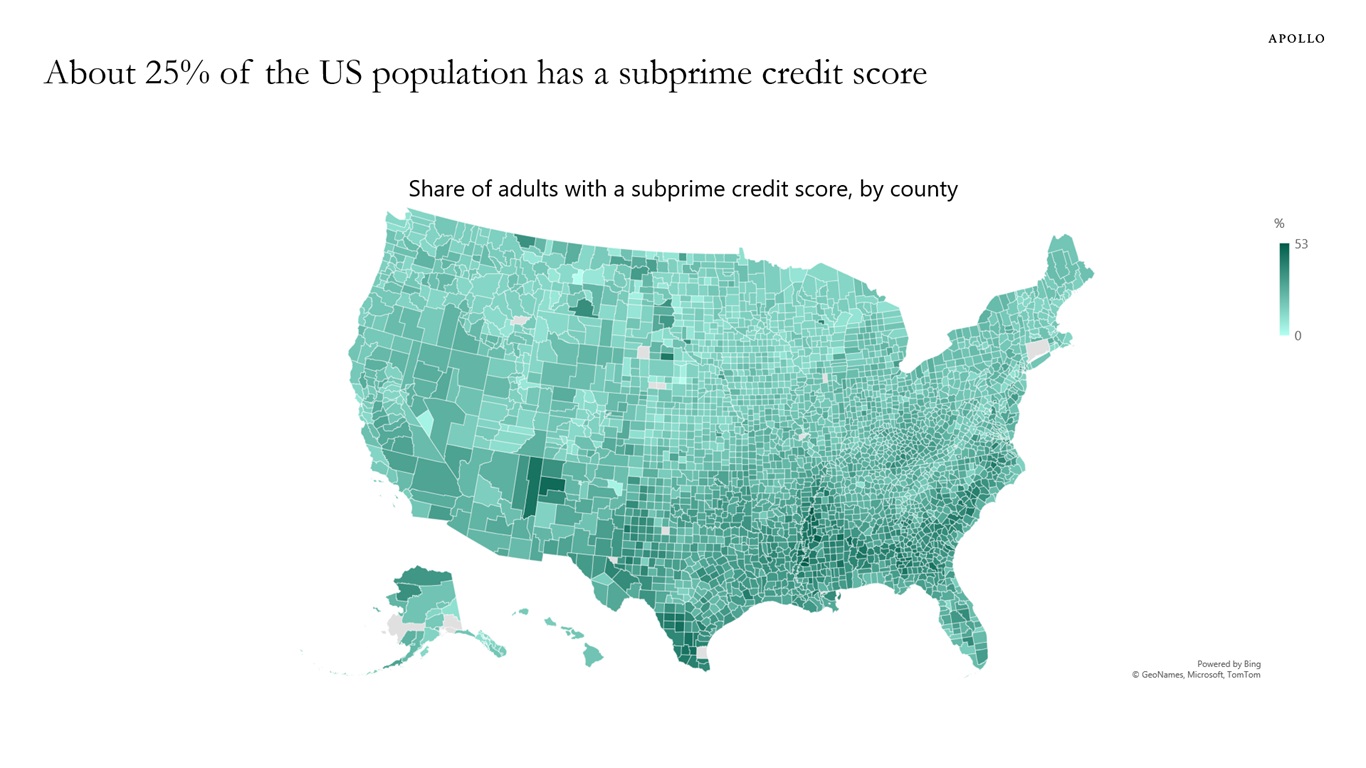
Roughly 25% of the US adult population have a FICO score below 660, see chart below.
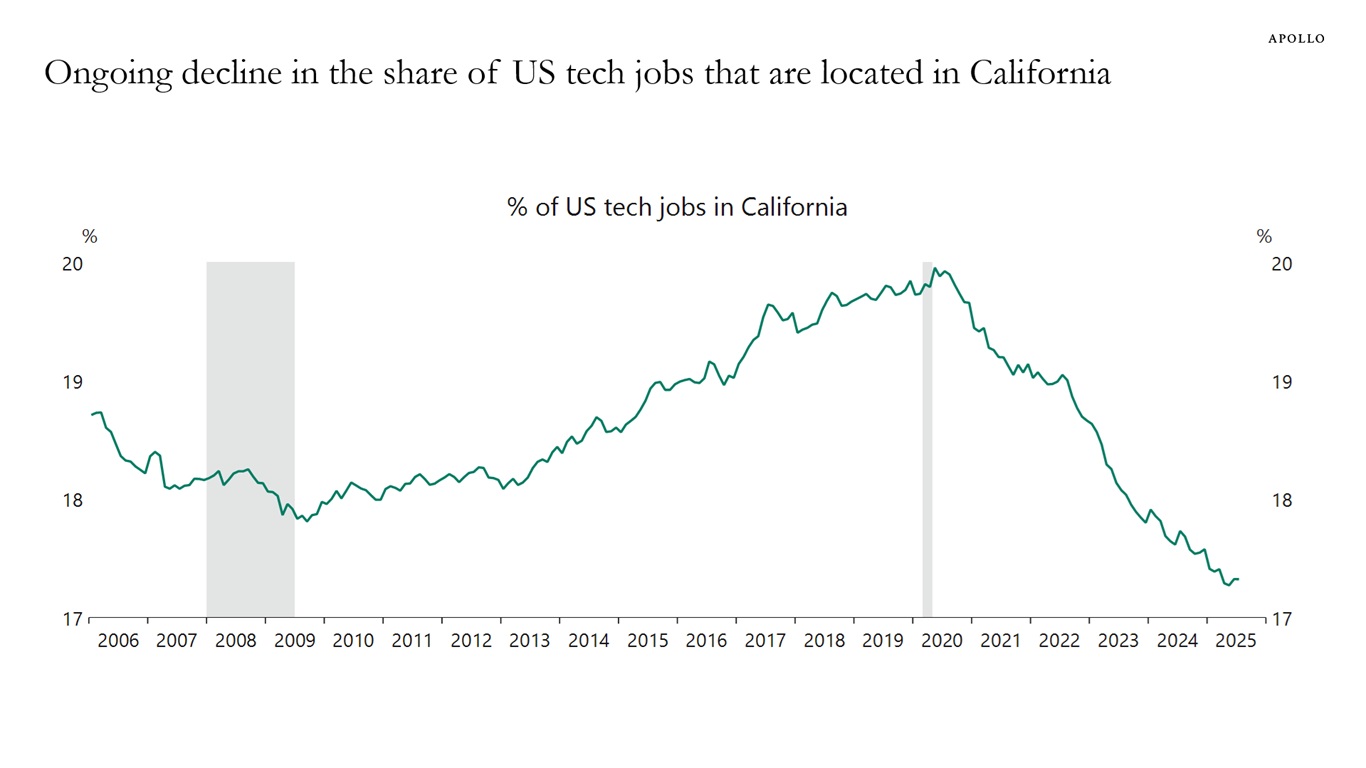
A smaller and smaller share of all tech jobs in the US are in California, see chart below.