Sports are no longer just culture or entertainment; they are a scalable, investable asset class. Financing this business is becoming one of today’s most compelling growth stories—and where the next records are poised to be broken.
Key Takeaways
- A $2.5 Trillion Global Industry: Sports have expanded far beyond tickets and local sponsorships into a diversified global ecosystem spanning media, merchandise, wellness, and live entertainment—with scalable monetization across multiple channels.
- Media Rights as the Growth Engine: Live sports remain the strongest driver of mass audiences, supporting more than $60 billion in annual, inflation-linked media contracts that anchor franchise valuations and function like long-duration, infrastructure-style revenue streams.
- Institutional Capital Enters the Game: As valuations exceeded the reach of individual owners, leagues opened the door to private equity, sovereign wealth funds, and pensions. Institutional participation is still early, giving first movers a structural advantage in navigating league frameworks, underwriting risk, and establishing credibility.
- Durable, Scarce, and Culturally Entrenched: Sports assets have compounded at roughly 13% annually for six decades. Their scarcity, global reach, and deep emotional resonance make them unusually resistant to technological change and macro volatility.
- A Financing Opportunity Ahead: With most franchises still under-levered at around 10% loan-to-value and traditional lenders slow to engage, significant whitespace remains for private credit and hybrid financing solutions to optimize balance sheets, unlock liquidity, and capture equity-like upside with credit-like risk.
The information herein is provided for educational purposes only and should not be construed as financial or investment advice, nor should any information in this document be relied on when making an investment decision. Opinions and views expressed reflect the current opinions and views of the authors and Apollo Analysts as of the date hereof and are subject to change. Please see the end of this document for important disclosure information.
Important Disclosure Information
This presentation is for educational purposes only and should not be treated as research. This presentation may not be distributed, transmitted or otherwise communicated to others, in whole or in part, without the express written consent of Apollo Global Management, Inc. (together with its subsidiaries, “Apollo”).
The views and opinions expressed in this presentation are the views and opinions of the author(s) of the White Paper. They do not necessarily reflect the views and opinions of Apollo and are subject to change at any time without notice. Further, Apollo and its affiliates may have positions (long or short) or engage in securities transactions that are not consistent with the information and views expressed in this presentation. There can be no assurance that an investment strategy will be successful. Historic market trends are not reliable indicators of actual future market behavior or future performance of any particular investment which may differ materially, and should not be relied upon as such. Target allocations contained herein are subject to change. There is no assurance that the target allocations will be achieved, and actual allocations may be significantly different than that shown here. This presentation does not constitute an offer of any service or product of Apollo. It is not an invitation by or on behalf of Apollo to any person to buy or sell any security or to adopt any investment strategy, and shall not form the basis of, nor may it accompany nor form part of, any right or contract to buy or sell any security or to adopt any investment strategy. Nothing herein should be taken as investment advice or a recommendation to enter into any transaction.
Hyperlinks to third-party websites in this presentation are provided for reader convenience only. There can be no assurance that any trends discussed herein will continue. Unless otherwise noted, information included herein is presented as of the dates indicated. This presentation is not complete and the information contained herein may change at any time without notice. Apollo does not have any responsibility to update the presentation to account for such changes. Apollo has not made any representation or warranty, expressed or implied, with respect to fairness, correctness, accuracy, reasonableness, or completeness of any of the information contained herein, and expressly disclaims any responsibility or liability therefore. The information contained herein is not intended to provide, and should not be relied upon for, accounting, legal or tax advice or investment recommendations. Investors should make an independent investigation of the information contained herein, including consulting their tax, legal, accounting or other advisors about such information. Apollo does not act for you and is not responsible for providing you with the protections afforded to its clients.
Certain information contained herein may be “forward-looking” in nature. Due to various risks and uncertainties, actual events or results may differ materially from those reflected or contemplated in such forward-looking information. As such, undue reliance should not be placed on such information. Forward-looking statements may be identified by the use of terminology including, but not limited to, “may”, “will”, “should”, “expect”, “anticipate”, “target”, “project”, “estimate”, “intend”, “continue” or “believe” or the negatives thereof or other variations thereon or comparable terminology.
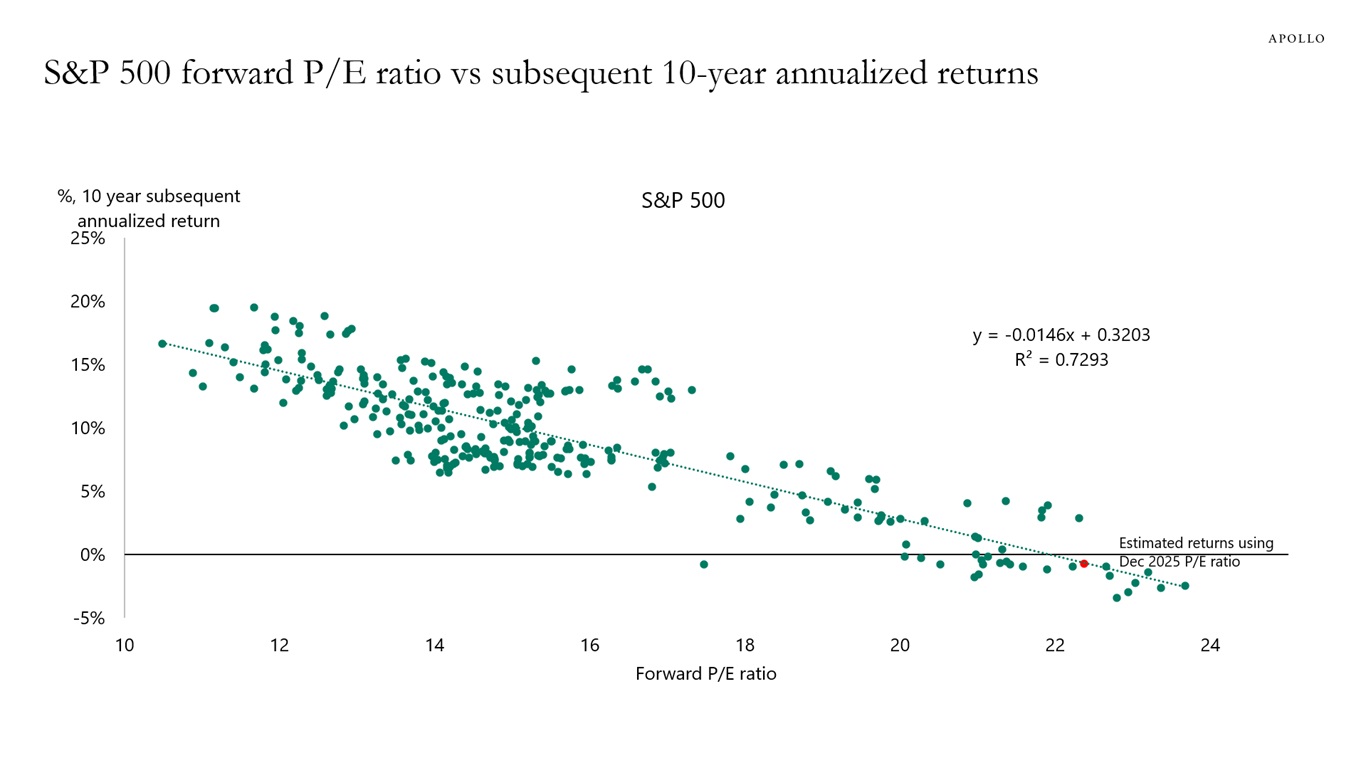
The Standard & Poor’s 500 (“S&P 500”) Index is a market-capitalization-weighted index of the 500 largest U.S. publicly traded companies by market value.
Additional information may be available upon request.