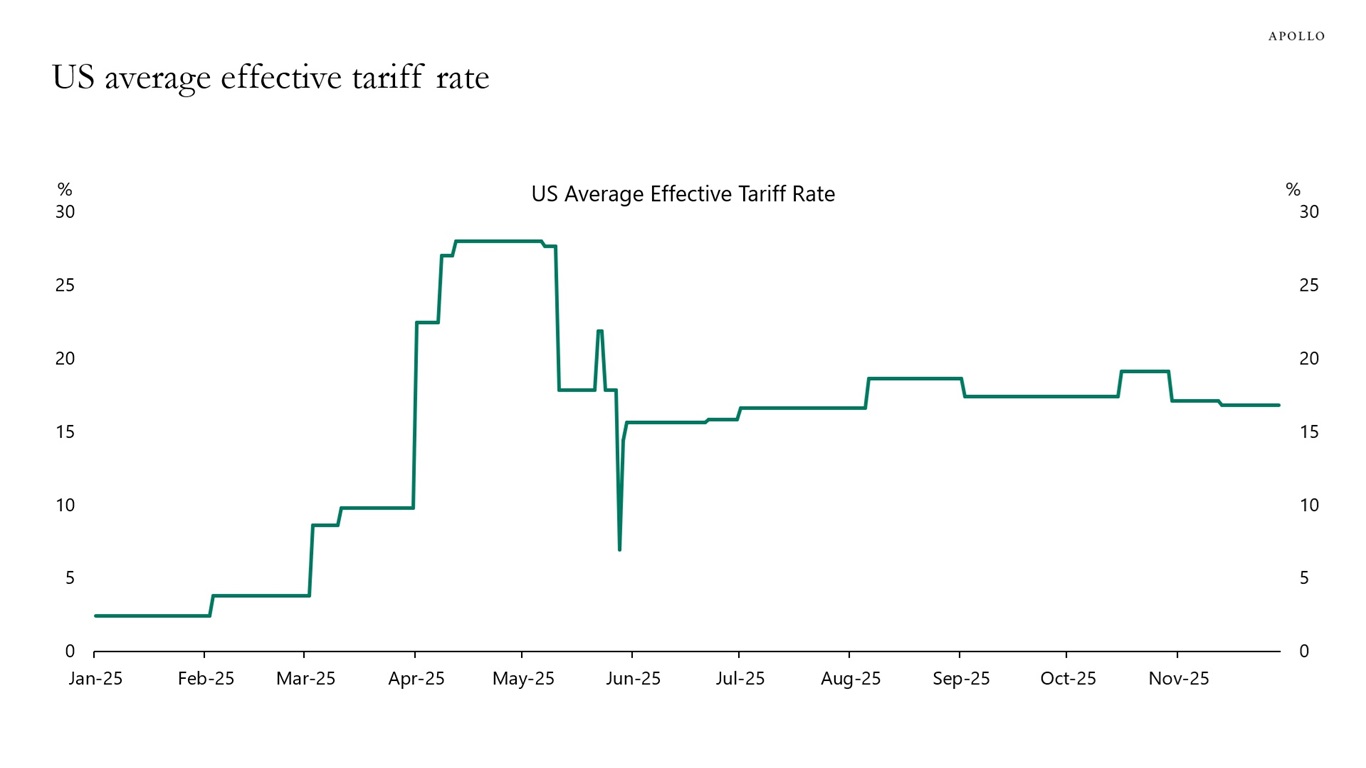
Data from the Yale Budget Lab shows that the US average effective tariff rate is currently roughly half of the level seen in April 2025, see chart below.


Data from the Yale Budget Lab shows that the US average effective tariff rate is currently roughly half of the level seen in April 2025, see chart below.
Training and running frontier AI models requires capital on a scale rarely seen in the private sector. Hyperscaler capex has already tripled since 2023, and forecasts now point to more than $2.7 trillion of cumulative AI-related spending from 2025 to 2029.
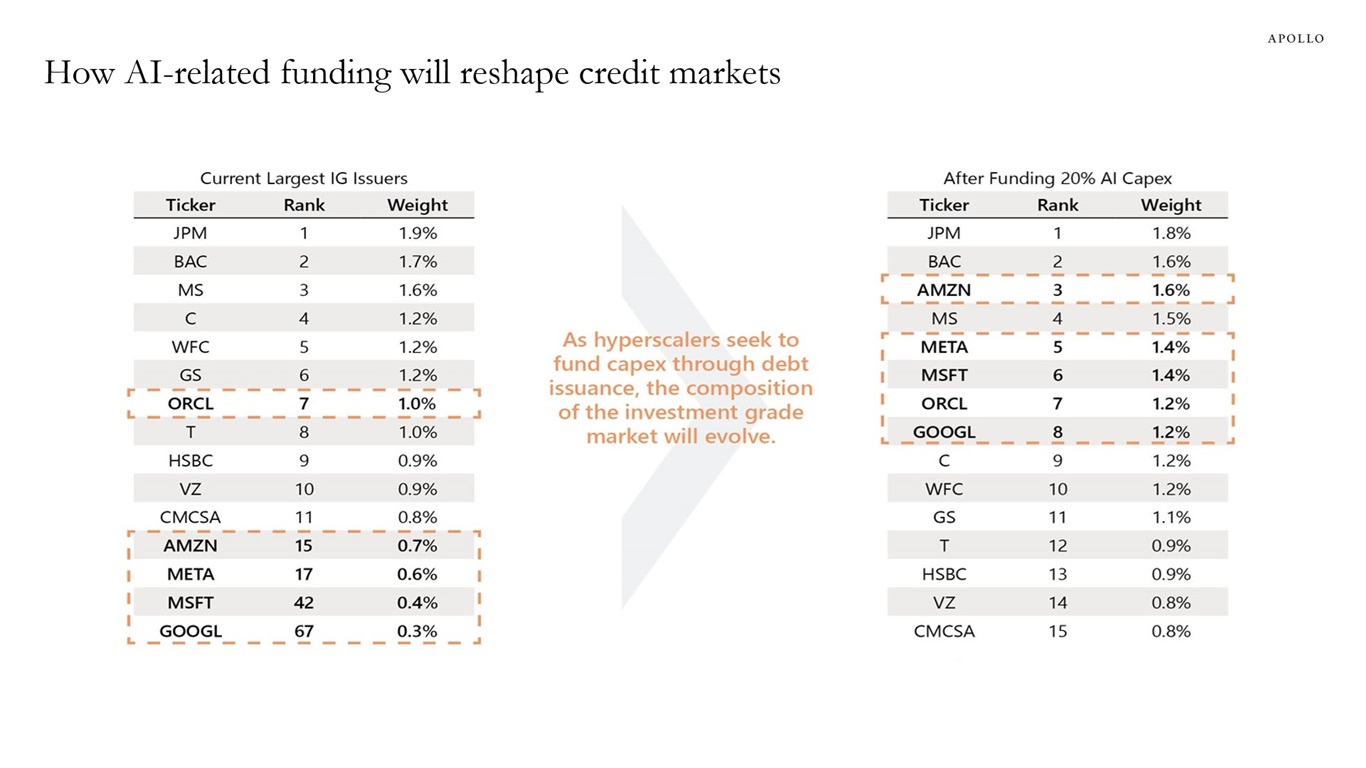
What began as a largely self-funded capex cycle is quickly becoming a financing event. In the final three months of 2025 alone, Oracle, Meta, Google and Amazon issued roughly $90 billion in bonds. As AI investment increasingly turns to debt markets, we expect this shift to meaningfully reorder the top ranks of the investment grade credit universe.
As the chart below illustrates, financing just 20% of AI capex through IG markets would materially reshape index composition — propelling Amazon into the top 3 issuers and pushing Meta, Microsoft, Oracle and Google into the top 10, with Google jumping from 67th to 8th.
This is one of the core themes explored in our 2026 Credit Outlook. In addition, we also highlight several forces reshaping credit markets:
Read more of our thinking and insights here.

Equity markets are entering a structurally different era. Public markets sit near record highs, driven by concentration, technical flows and negative equity risk premia — a tough starting point for future appreciation. Private equity, meanwhile, is confronting the end of a decade that ended in 2022 where cheap debt and multiple expansion could substitute for genuine value creation. Returns and realizations have predictably lagged after the interest rate reset in 2022.
In an easy‑money environment, many managers effectively subsisted on a “buy high, sell higher” strategy and generated less value from buying well and operational improvements.
The question for 2026 and beyond is not whether private equity will remain relevant, it is which strategy will excel in an environment that looks different than the recent past. The answer, we believe, lies in a return to the roots of the asset class: disciplined buying, hands-on operational improvement and clear, repeatable pathways to liquidity. These fundamentals were central to PE’s earliest successes but were lost sight of during periods of excess against an ultra-accommodative backdrop. We believe a return to fundamentals will define those strategies best positioned to outperform in a world with normalized rates.
In this article (the first in a series about the new private equity landscape), we explore how the asset class should return to its core principles to help deliver excess returns over public markets. These are the same principles that have historically driven returns in the private equity industry, except for the 2010–2022 period.
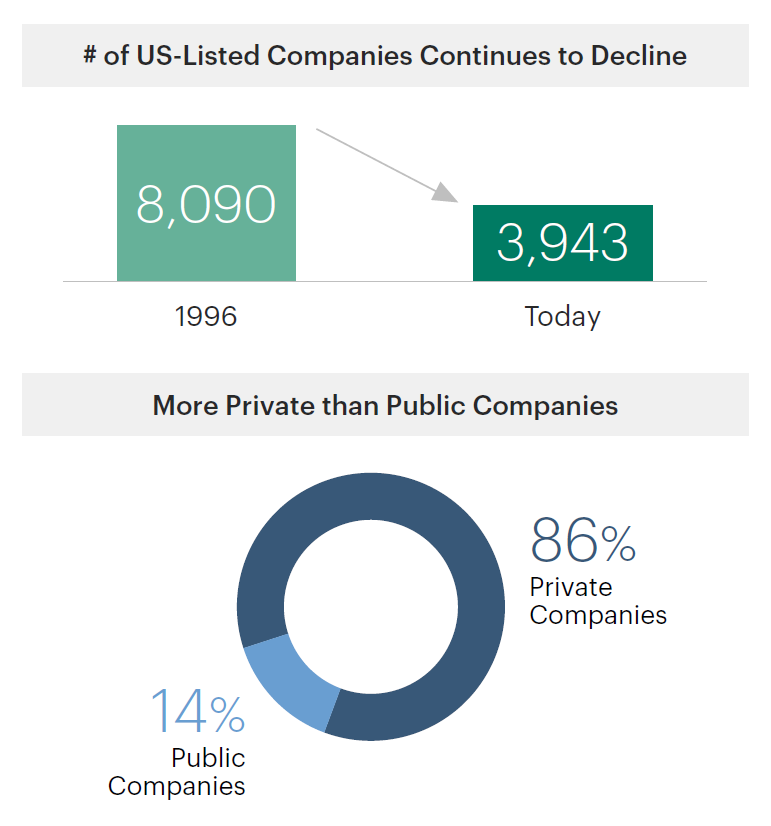
On the surface, public equity markets appear healthy. In reality, these markets are defined by a shrinking opportunity set, narrow leadership and returns driven by the reflexivity of index investing, which pushes up the valuation of the largest companies:
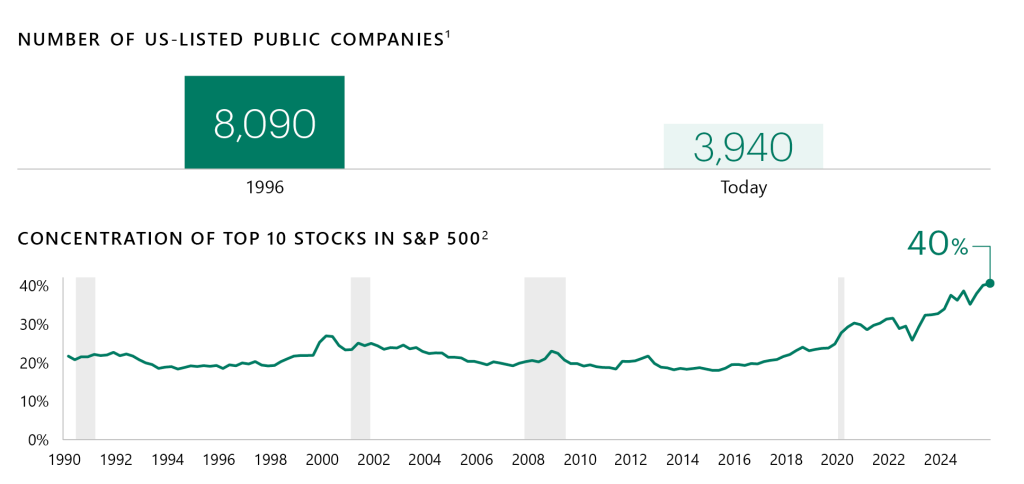
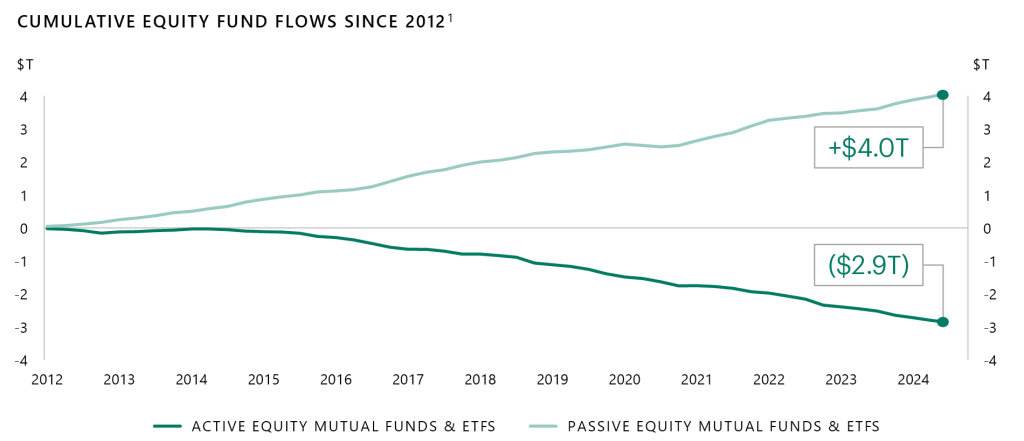
These are not cyclical quirks but long‑term secular trends away from active management and towards index investing. While indexation has benefited investors with lower costs, it has also distorted price discovery and fundamental valuation.
Private equity investing has changed just as dramatically. A decade of ultra‑low rates allowed many managers to rely on expanding multiples, cheap leverage and buoyant exit markets. We believe that era has ended. Higher financing costs, slower exits and a recalibration of pricing power have revealed which managers depended on beta versus those whose returns stem from operational value creation, along with shrewd asset sourcing and selection. In that environment, financial engineering often played a larger role in driving returns than hands‑on operational improvement. A carve‑out, a strategy in which an underperforming business is separated from a parent company and repositioned as a standalone enterprise, historically exemplified the asset class’s operational roots. As financing costs have risen, exit markets have slowed and pricing power has recalibrated, the distinction between managers who generate returns through operational value creation and those more reliant on favorable market conditions has become increasingly apparent.
“The next 10 years will look significantly different from the last 15 — an era buttressed by a zero-interest-rate policy and multiple expansion.”
Bain & Company, Global Private Equity Report 2025
Going forward, can private equity get back to the fundamentals that made investing in the space different and value-additive? Traditionally, private equity emphasized long-term value creation and operational efficiency improvements outside the constraints of quarterly public market reporting and short-term performance pressures.
One fact captures today’s challenge: since 2018, capital calls have exceeded distributions by roughly $1.5 trillion.1 The effects are clear: exits are slow, DPI is depressed and fund lives are stretching significantly beyond the expected 10-year terms, dragging down IRRs.
These pressures reveal structural weaknesses in the industry:
These challenges are not temporary. They are symptoms of a regime shift, one that exposes managers without a true value creation engine. The dispersion between top and bottom quartile funds now exceeds 25 percentage points — a sign that private equity is no longer a rising-tide-lifts-all-boats industry.3
In our view, the firms that will outperform in 2026 and beyond will do so by reclaiming the practices that defined private equity’s foundational decades: buy well, control the controllable, make fundamental improvements to a business and look to return capital early and often.
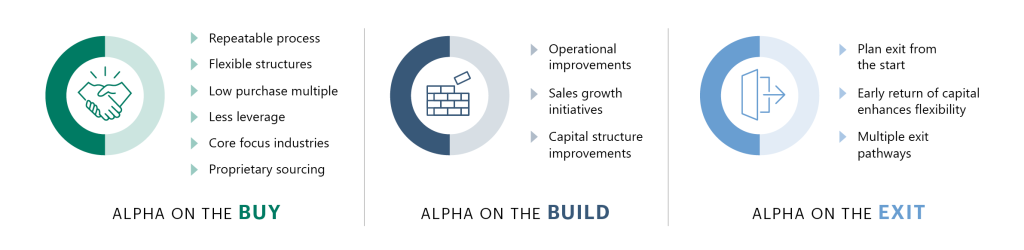
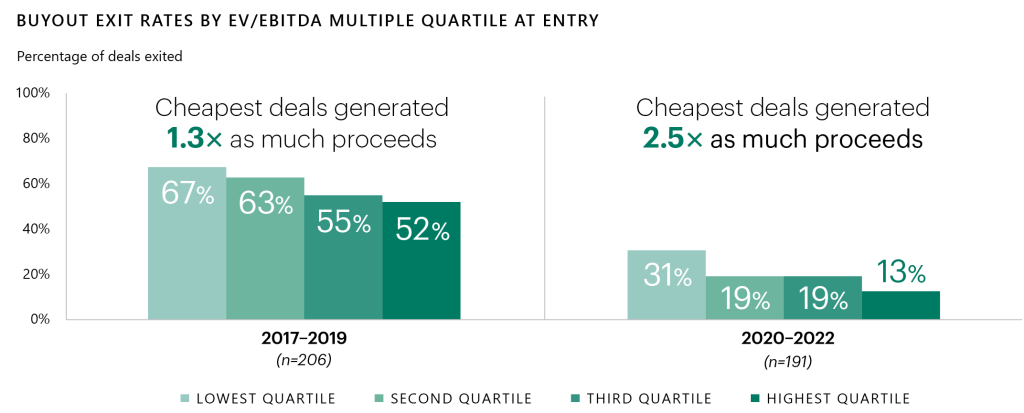
Purchase price is once again the dominant driver of returns. Managers often succeeding today share several traits:
In an environment where valuations remain high and debt is more expensive, disciplined buying is not defensive, it is alpha.
Cheap leverage can no longer mask a weak value creation capability. Leading managers distinguish themselves by how they operate:
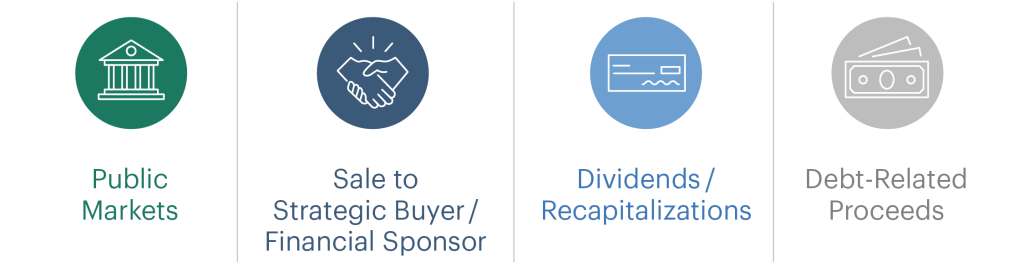
While there has been some recovery in private equity exit activity, volumes remain well below five-year averages.4 Even if exit volumes normalize, the backlog of assets needing to be sold is so significant that distribution yields, as a percentage of assets held, are unlikely to normalize as well. In a constrained exit environment, liquidity becomes a strategic capability. Leading firms typically approach exits with discipline and flexibility:
Firms generating strong DPI today are distinguished not by perfect market timing but by flexible, multi-channel liquidity strategies.
Private equity stands at an inflection point. We believe the era of easy money has ended, and with it the illusion that overly simple strategies like buying good companies at any price can reliably deliver alpha. Over time, private equity has distinguished itself from public markets through active ownership and long-term value creation, often in environments far less accommodating than the one that just passed. Private equity has a way of reinventing itself and, this time, that reinvention is just a return to fundamentals and the original promise of the asset class: to buy intelligently, improve relentlessly and return capital through disciplined, flexible execution.
The managers we believe will outperform in 2026 and beyond will not be the ones chasing beta or momentum. They will be those returning to the craft: the builders, the operators and the investors for whom value creation is not a buzzword but a repeatable system.
Private equity’s path forward is not new. It is a return to its roots.
1 Source: Morgan Stanley Research. Digging into the DPI Drought. June 2025.
2 Source: McKinsey Global Private Markets Review 2024. Represents total return for buyout deals that were entered in 2010 or later and exited in 2021 or before.
3 Note: Private equity includes buyout, growth/expansion, diversified and turnaround funds across vintage years from 2005-2019. Data (20-year IRRs) as of December 31, 2024. Source: Preqin
4 Source: Bain & Company Global Private Equity Report 2025
The information herein is provided for educational purposes only and should not be construed as financial or investment advice, nor should any information in this document be relied on when making an investment decision. Opinions and views expressed reflect the current opinions and views of the authors and Apollo Analysts as of the date hereof and are subject to change. Please see the end of this document for important disclosure information.
Important Disclosure Information
This presentation is for educational purposes only and should not be treated as research. This presentation may not be distributed, transmitted or otherwise communicated to others, in whole or in part, without the express written consent of Apollo Global Management, Inc. (together with its subsidiaries, “Apollo”).
The views and opinions expressed in this presentation are the views and opinions of the author(s) of the White Paper. They do not necessarily reflect the views and opinions of Apollo and are subject to change at any time without notice. Further, Apollo and its affiliates may have positions (long or short) or engage in securities transactions that are not consistent with the information and views expressed in this presentation. There can be no assurance that an investment strategy will be successful. Historic market trends are not reliable indicators of actual future market behavior or future performance of any particular investment which may differ materially, and should not be relied upon as such. Target allocations contained herein are subject to change. There is no assurance that the target allocations will be achieved, and actual allocations may be significantly different than that shown here. This presentation does not constitute an offer of any service or product of Apollo. It is not an invitation by or on behalf of Apollo to any person to buy or sell any security or to adopt any investment strategy, and shall not form the basis of, nor may it accompany nor form part of, any right or contract to buy or sell any security or to adopt any investment strategy. Nothing herein should be taken as investment advice or a recommendation to enter into any transaction.
Hyperlinks to third-party websites in this presentation are provided for reader convenience only. There can be no assurance that any trends discussed herein will continue. Unless otherwise noted, information included herein is presented as of the dates indicated. This presentation is not complete and the information contained herein may change at any time without notice. Apollo does not have any responsibility to update the presentation to account for such changes. Apollo has not made any representation or warranty, expressed or implied, with respect to fairness, correctness, accuracy, reasonableness, or completeness of any of the information contained herein, and expressly disclaims any responsibility or liability therefore. The information contained herein is not intended to provide, and should not be relied upon for, accounting, legal or tax advice or investment recommendations. Investors should make an independent investigation of the information contained herein, including consulting their tax, legal, accounting or other advisors about such information. Apollo does not act for you and is not responsible for providing you with the protections afforded to its clients.
Certain information contained herein may be “forward-looking” in nature. Due to various risks and uncertainties, actual events or results may differ materially from those reflected or contemplated in such forward-looking information. As such, undue reliance should not be placed on such information. Forward-looking statements may be identified by the use of terminology including, but not limited to, “may”, “will”, “should”, “expect”, “anticipate”, “target”, “project”, “estimate”, “intend”, “continue” or “believe” or the negatives thereof or other variations thereon or comparable terminology.
The Standard & Poor’s 500 (“S&P 500”) Index is a market-capitalization-weighted index of the 500 largest U.S. publicly traded companies by market value.
Additional information may be available upon request.
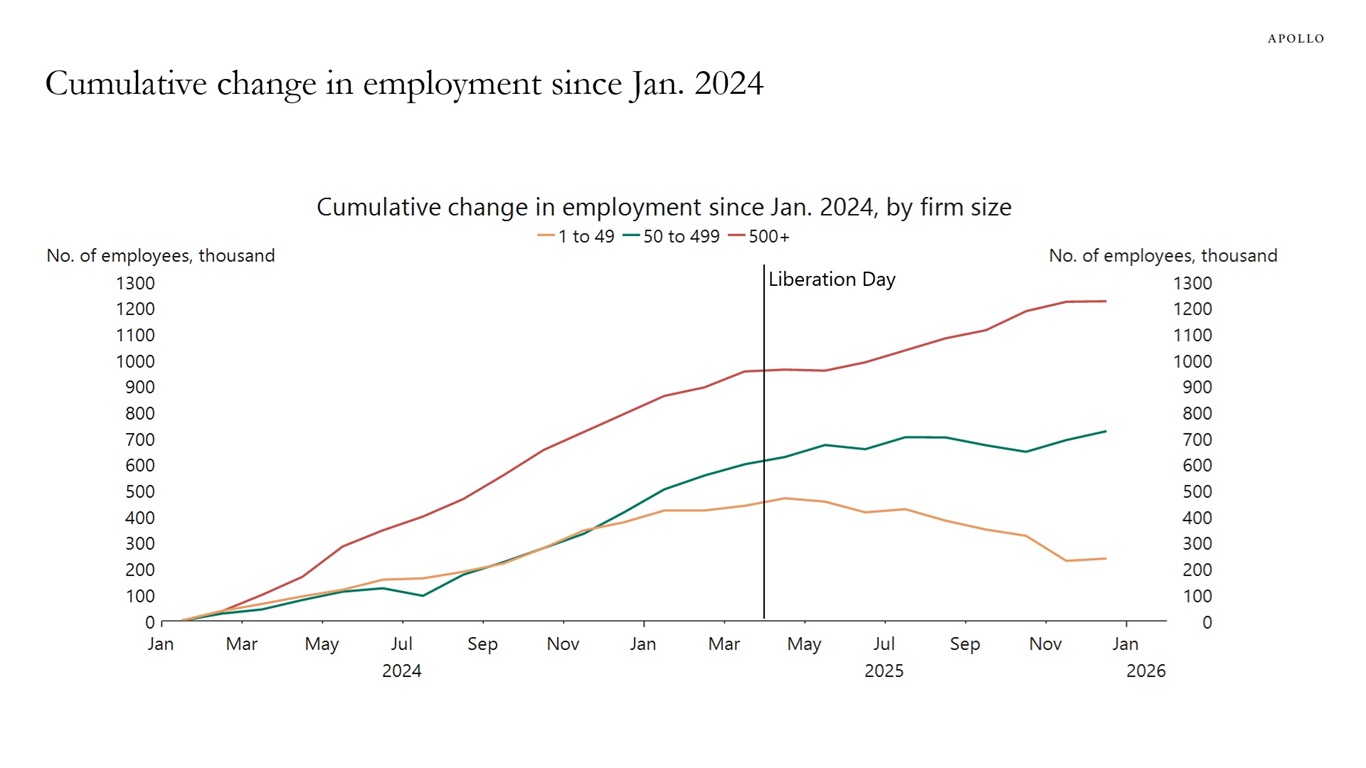
Employment growth in large companies is outpacing job growth in smaller companies.
The source of the underperformance of small businesses could be AI or it could be the trade war.
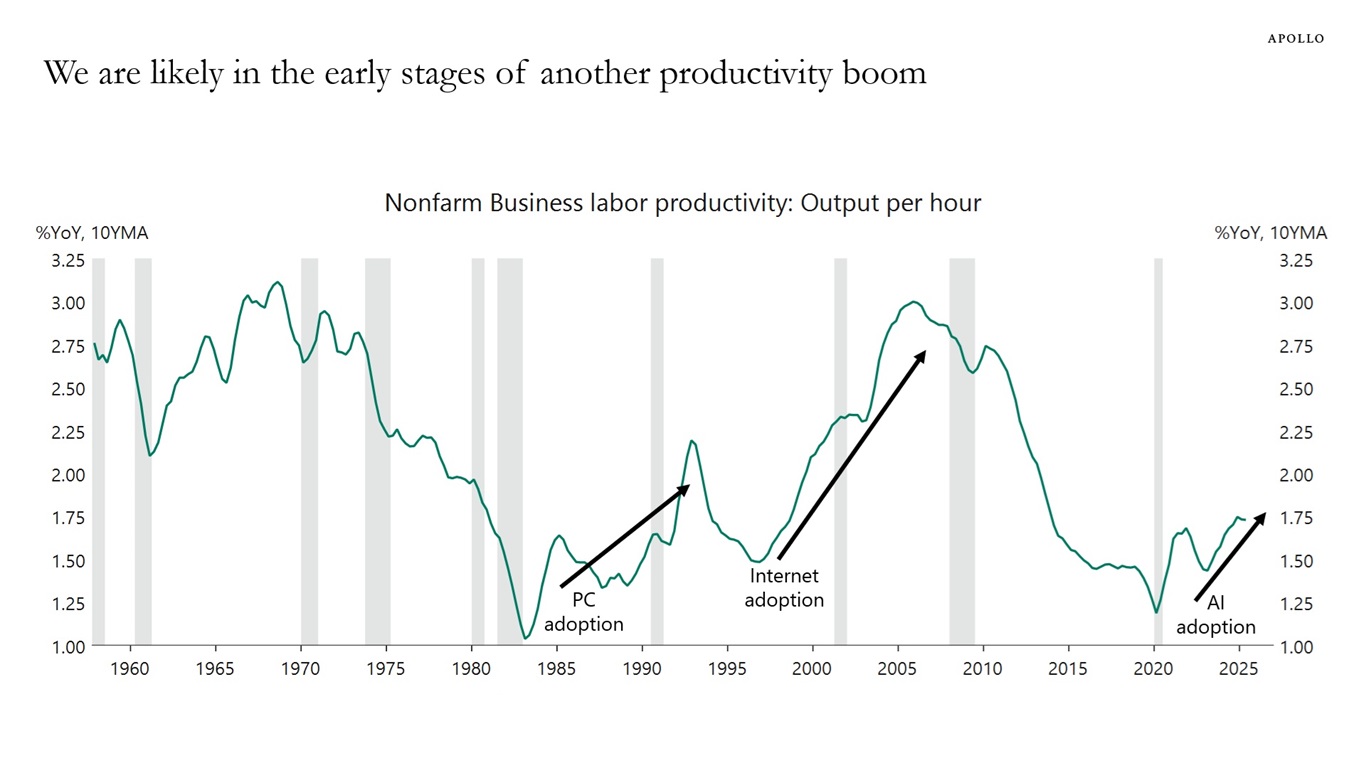
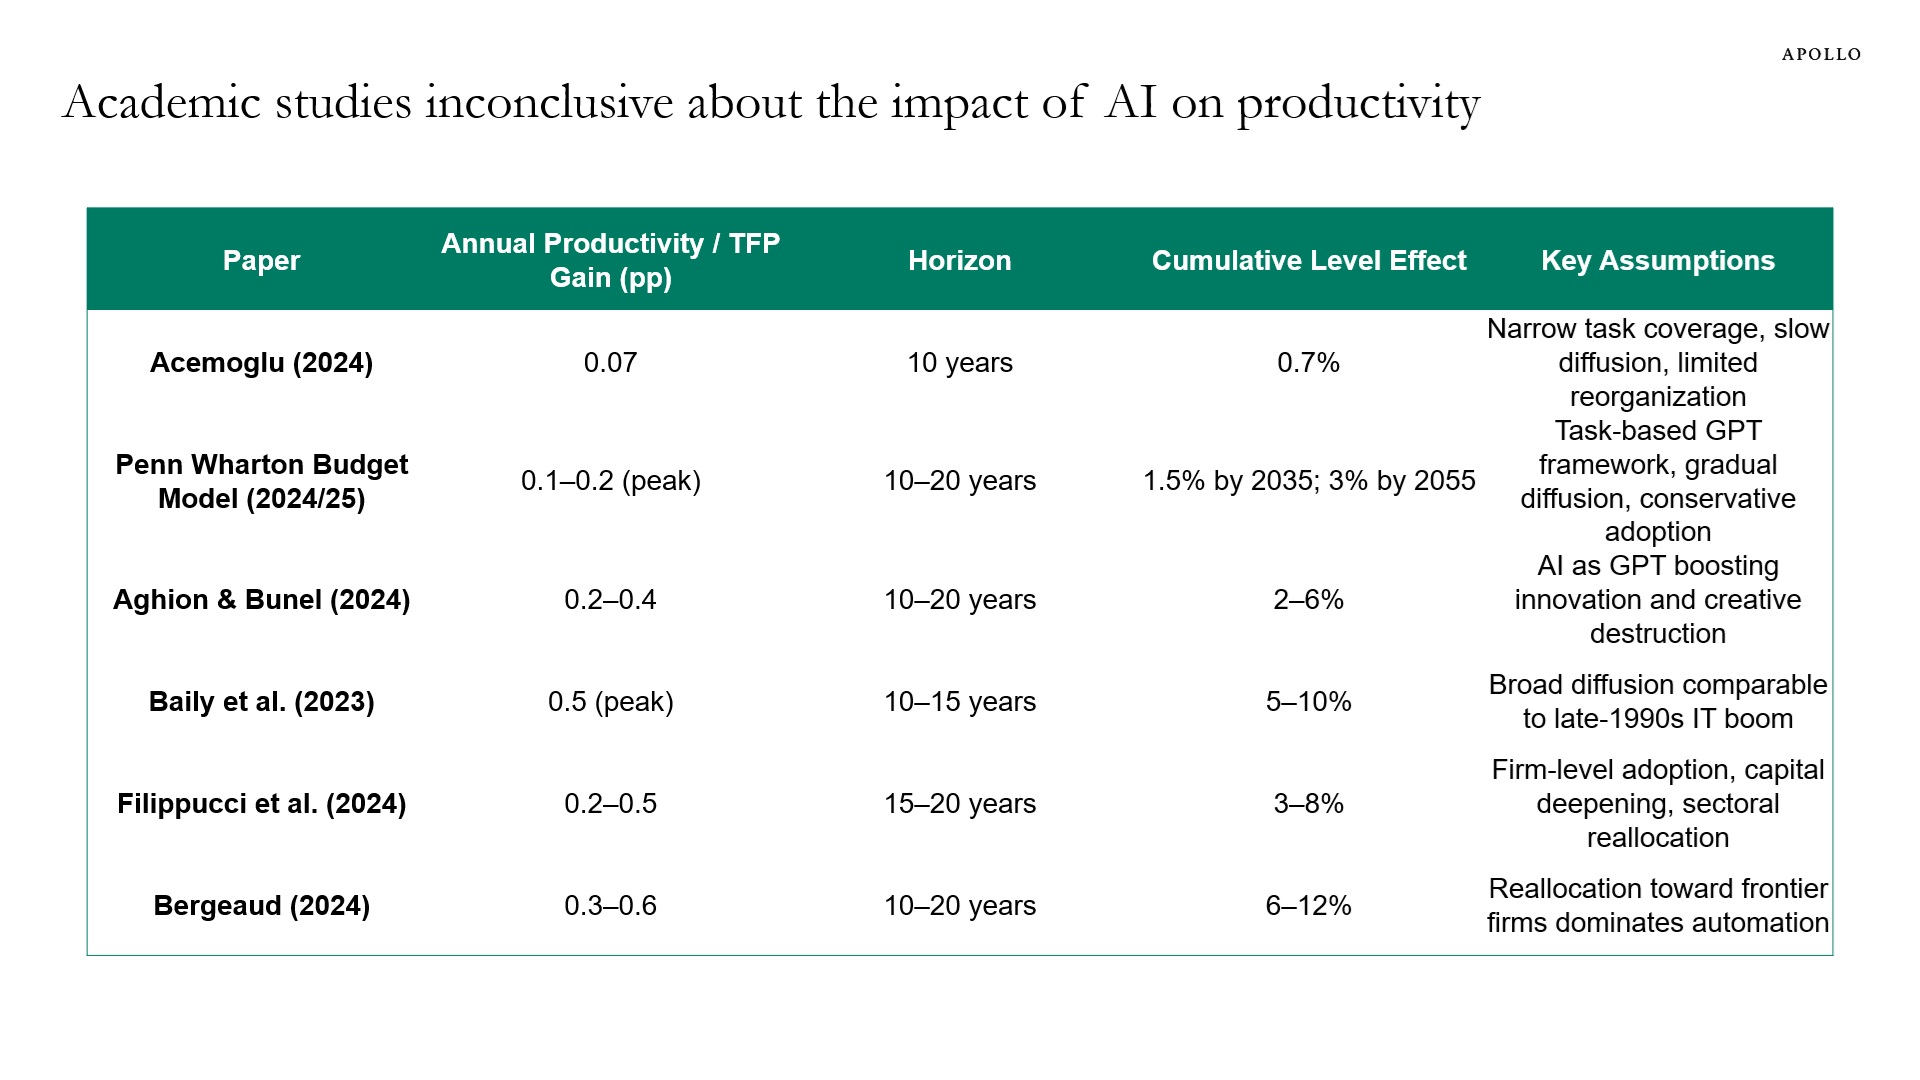
Academic papers are inconclusive about the impact of AI on productivity, but we believe we are in the early stages of a boom in labor productivity, see charts below and our chart book (available here). While there are questions about the magnitude of the impact at the macro level, it is clear that there are already significant sector impacts including in DevOps software, robotic process automation and content management systems.
This chart book looks at demand and supply in the Treasury market, including recent developments in Treasury auction metrics. There are 10 conclusions:
1. For every $5 the government collects in taxes, a dollar goes to paying interest on debt.
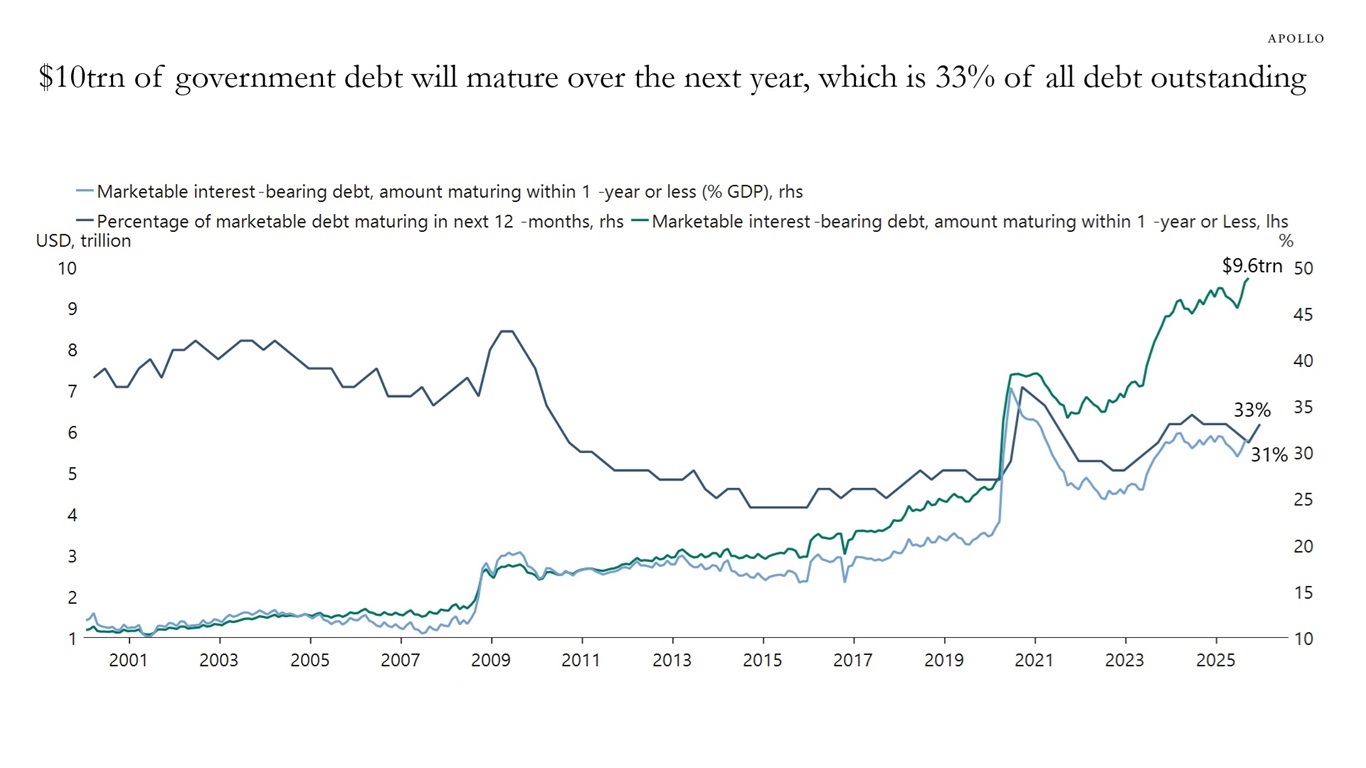
2. $10 trillion of government debt will mature over the next year, which is 33% of all debt outstanding.
3. The share of T-bills outstanding has increased to 22%, and 85% of Treasury gross issuance is T-bills.
4. The average federal net interest expense per day, including weekends, is now $3.5 billion.
5. Foreign ownership of Treasuries has declined to 25% of the total outstanding, down from 33% a decade ago.
6. Japan has been increasing its holdings of Treasuries while China has been lowering its holdings.
7. In Treasury auctions, tails and stop-through have been small and relatively balanced, implying that there is still solid demand across the curve.
8. Treasury auction metrics show that indirect bidding, often a proxy for foreign central bank demand, has been declining over the past year, particularly for notes.
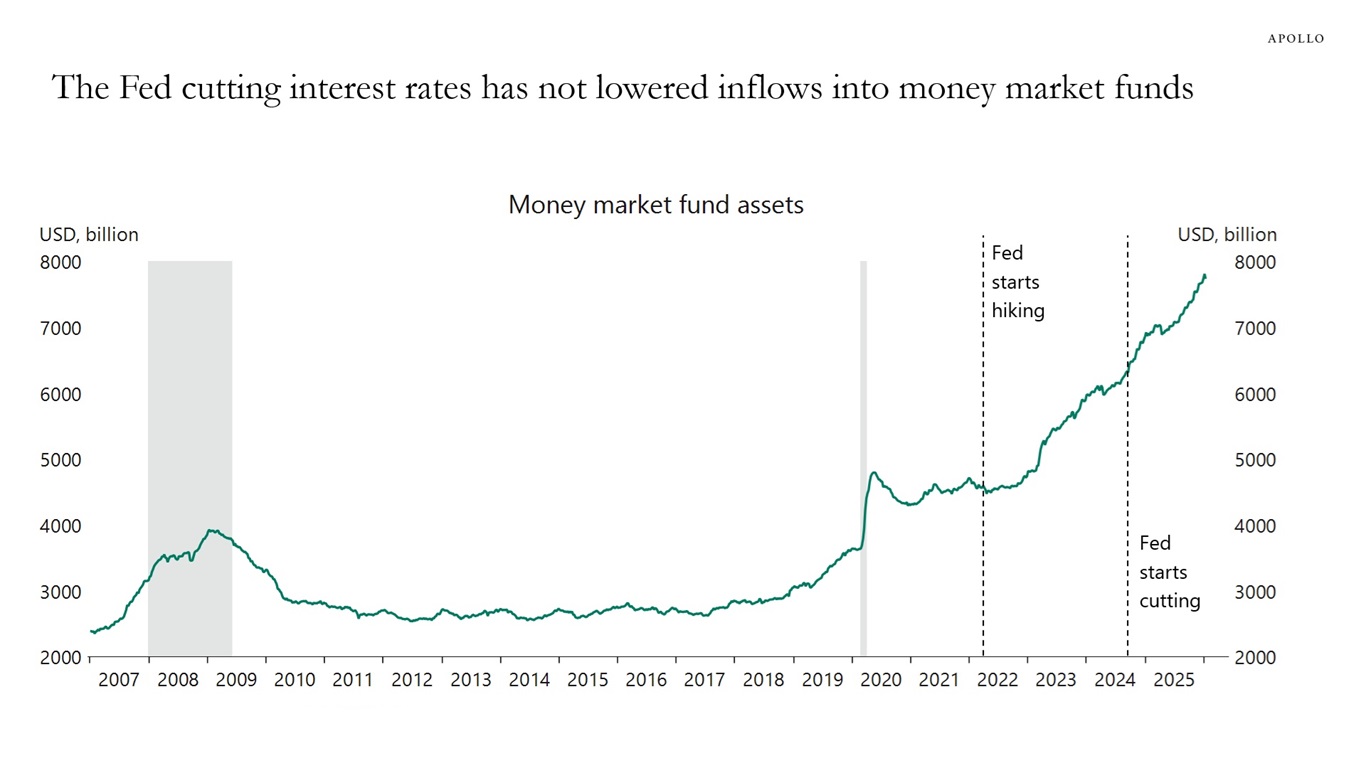
9. The Fed cutting interest rates has not lowered inflows into money market funds, implying that “money on the sidelines” is not as interest rate sensitive as many people think.
10. 89% of US government debt is fixed rate, and 22% of debt outstanding is in bills.

In this article, Apollo Partner Brian Weinstein kicks off Convergence, a new series exploring the convergence of public and private credit markets and its potential implications for the future of fixed income portfolio construction.
Key Takeaways:
The information herein is provided for educational purposes only and should not be construed as financial or investment advice, nor should any information in this document be relied on when making an investment decision. Opinions and views expressed reflect the current opinions and views of the authors and Apollo Analysts as of the date hereof and are subject to change. Please see the end of this document for important disclosure information.
Important Disclosure Information
This presentation is for educational purposes only and should not be treated as research. This presentation may not be distributed, transmitted or otherwise communicated to others, in whole or in part, without the express written consent of Apollo Global Management, Inc. (together with its subsidiaries, “Apollo”).
The views and opinions expressed in this presentation are the views and opinions of the author(s) of the White Paper. They do not necessarily reflect the views and opinions of Apollo and are subject to change at any time without notice. Further, Apollo and its affiliates may have positions (long or short) or engage in securities transactions that are not consistent with the information and views expressed in this presentation. There can be no assurance that an investment strategy will be successful. Historic market trends are not reliable indicators of actual future market behavior or future performance of any particular investment which may differ materially, and should not be relied upon as such. Target allocations contained herein are subject to change. There is no assurance that the target allocations will be achieved, and actual allocations may be significantly different than that shown here. This presentation does not constitute an offer of any service or product of Apollo. It is not an invitation by or on behalf of Apollo to any person to buy or sell any security or to adopt any investment strategy, and shall not form the basis of, nor may it accompany nor form part of, any right or contract to buy or sell any security or to adopt any investment strategy. Nothing herein should be taken as investment advice or a recommendation to enter into any transaction.
Hyperlinks to third-party websites in this presentation are provided for reader convenience only. There can be no assurance that any trends discussed herein will continue. Unless otherwise noted, information included herein is presented as of the dates indicated. This presentation is not complete and the information contained herein may change at any time without notice. Apollo does not have any responsibility to update the presentation to account for such changes. Apollo has not made any representation or warranty, expressed or implied, with respect to fairness, correctness, accuracy, reasonableness, or completeness of any of the information contained herein, and expressly disclaims any responsibility or liability therefore. The information contained herein is not intended to provide, and should not be relied upon for, accounting, legal or tax advice or investment recommendations. Investors should make an independent investigation of the information contained herein, including consulting their tax, legal, accounting or other advisors about such information. Apollo does not act for you and is not responsible for providing you with the protections afforded to its clients.
Certain information contained herein may be “forward-looking” in nature. Due to various risks and uncertainties, actual events or results may differ materially from those reflected or contemplated in such forward-looking information. As such, undue reliance should not be placed on such information. Forward-looking statements may be identified by the use of terminology including, but not limited to, “may”, “will”, “should”, “expect”, “anticipate”, “target”, “project”, “estimate”, “intend”, “continue” or “believe” or the negatives thereof or other variations thereon or comparable terminology.
The Standard & Poor’s 500 (“S&P 500”) Index is a market-capitalization-weighted index of the 500 largest U.S. publicly traded companies by market value.
Additional information may be available upon request.

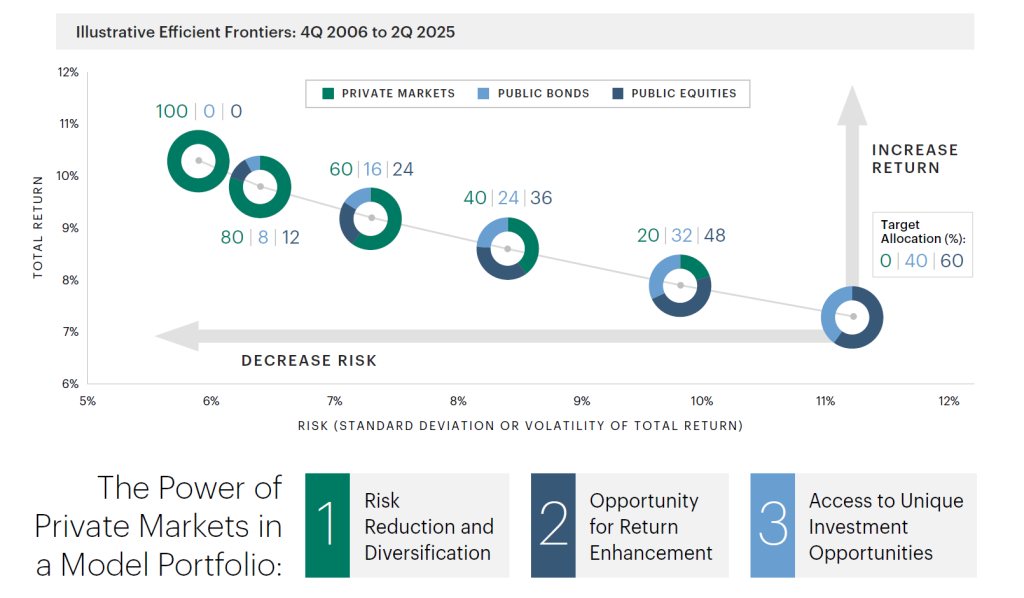
Public markets now represent a shrinking slice of the real economy. So why do most model portfolios still look the same? In this new Apollo series, we explore how private markets can help enhance portfolio outcomes, using historical data and insights to reveal their potential impact in shifting the efficient frontier.
For decades, the 60/40 portfolio allocation model has been top-of-mind for long-term investors. This mix of public equities and fixed income was designed to balance growth and stability and provide the diversification benefits of assets with low correlation to each other. However, as more lending and credit creation take place in private markets, the traditional 60/40 model is becoming outdated. Now, a handful of mega-cap stocks drive public equity returns, while the rising correlation between public stocks and bonds has practically eroded the diversification benefits of the traditional 60/40 portfolio, leaving investors more exposed to systemic risks.
We believe the strategic inclusion of private markets is the next evolution of model portfolios. Our analysis shows that by incorporating private market investments, model portfolios have the potential to demonstrate improved risk-adjusted outcomes and diversification benefits all the while meeting a range of investment goals. From 4Q06 to 2Q25, a traditional 60/40 portfolio of public stocks and bonds returned just 7.3% on an annualized basis. Adding private markets to this 60/40 portfolio incrementally increased returns and lowered risk over this same time period, with a portfolio of 100% private markets delivering a 10.3% annualized return.
The information herein is provided for educational purposes only and should not be construed as financial or investment advice, nor should any information in this document be relied on when making an investment decision. Opinions and views expressed reflect the current opinions and views of the authors and Apollo Analysts as of the date hereof and are subject to change. Please see the end of this document for important disclosure information.
Important Disclosure Information
This presentation is for educational purposes only and should not be treated as research. This presentation may not be distributed, transmitted or otherwise communicated to others, in whole or in part, without the express written consent of Apollo Global Management, Inc. (together with its subsidiaries, “Apollo”).
The views and opinions expressed in this presentation are the views and opinions of the author(s) of the White Paper. They do not necessarily reflect the views and opinions of Apollo and are subject to change at any time without notice. Further, Apollo and its affiliates may have positions (long or short) or engage in securities transactions that are not consistent with the information and views expressed in this presentation. There can be no assurance that an investment strategy will be successful. Historic market trends are not reliable indicators of actual future market behavior or future performance of any particular investment which may differ materially, and should not be relied upon as such. Target allocations contained herein are subject to change. There is no assurance that the target allocations will be achieved, and actual allocations may be significantly different than that shown here. This presentation does not constitute an offer of any service or product of Apollo. It is not an invitation by or on behalf of Apollo to any person to buy or sell any security or to adopt any investment strategy, and shall not form the basis of, nor may it accompany nor form part of, any right or contract to buy or sell any security or to adopt any investment strategy. Nothing herein should be taken as investment advice or a recommendation to enter into any transaction.
Hyperlinks to third-party websites in this presentation are provided for reader convenience only. There can be no assurance that any trends discussed herein will continue. Unless otherwise noted, information included herein is presented as of the dates indicated. This presentation is not complete and the information contained herein may change at any time without notice. Apollo does not have any responsibility to update the presentation to account for such changes. Apollo has not made any representation or warranty, expressed or implied, with respect to fairness, correctness, accuracy, reasonableness, or completeness of any of the information contained herein, and expressly disclaims any responsibility or liability therefore. The information contained herein is not intended to provide, and should not be relied upon for, accounting, legal or tax advice or investment recommendations. Investors should make an independent investigation of the information contained herein, including consulting their tax, legal, accounting or other advisors about such information. Apollo does not act for you and is not responsible for providing you with the protections afforded to its clients.
Certain information contained herein may be “forward-looking” in nature. Due to various risks and uncertainties, actual events or results may differ materially from those reflected or contemplated in such forward-looking information. As such, undue reliance should not be placed on such information. Forward-looking statements may be identified by the use of terminology including, but not limited to, “may”, “will”, “should”, “expect”, “anticipate”, “target”, “project”, “estimate”, “intend”, “continue” or “believe” or the negatives thereof or other variations thereon or comparable terminology.
The Standard & Poor’s 500 (“S&P 500”) Index is a market-capitalization-weighted index of the 500 largest U.S. publicly traded companies by market value.
Additional information may be available upon request.
We have updated our chart book with daily and weekly indicators, and the latest data shows that:
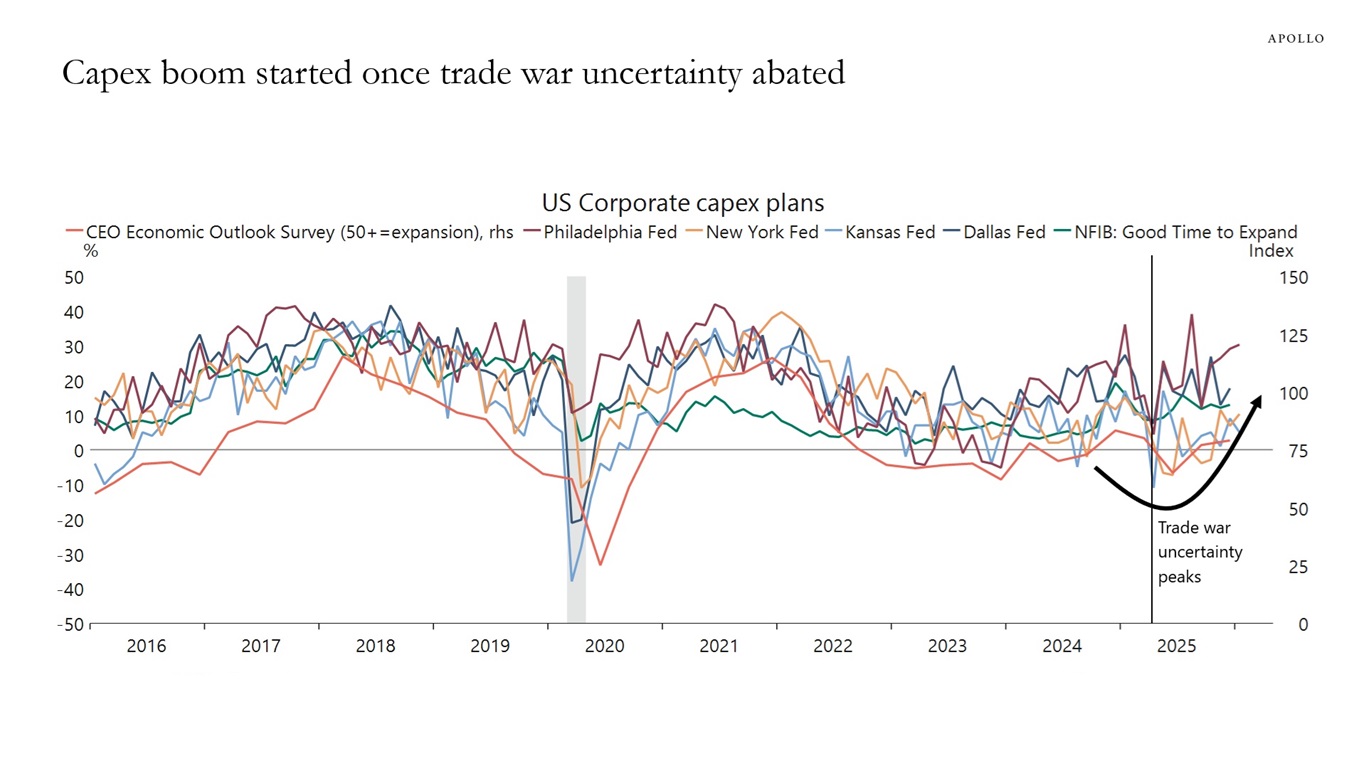
1. There is a capex boom underway, and corporate capex plans are moving higher driven by the One Big Beautiful Bill.
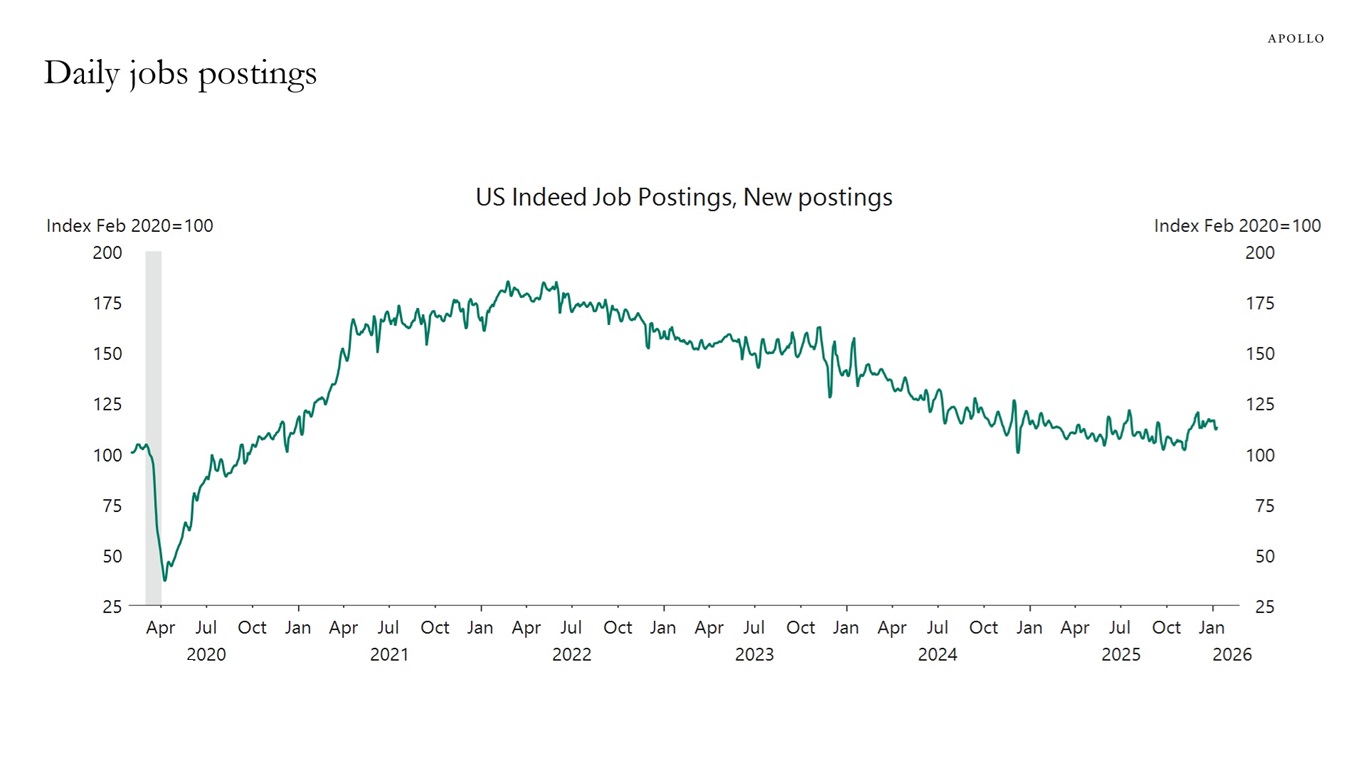
2. Daily data for job postings are rising.
3. Withheld income taxes are at higher levels than normal in January.
4. Weekly data for Broadway show attendance is also at higher levels than normally seen in January.
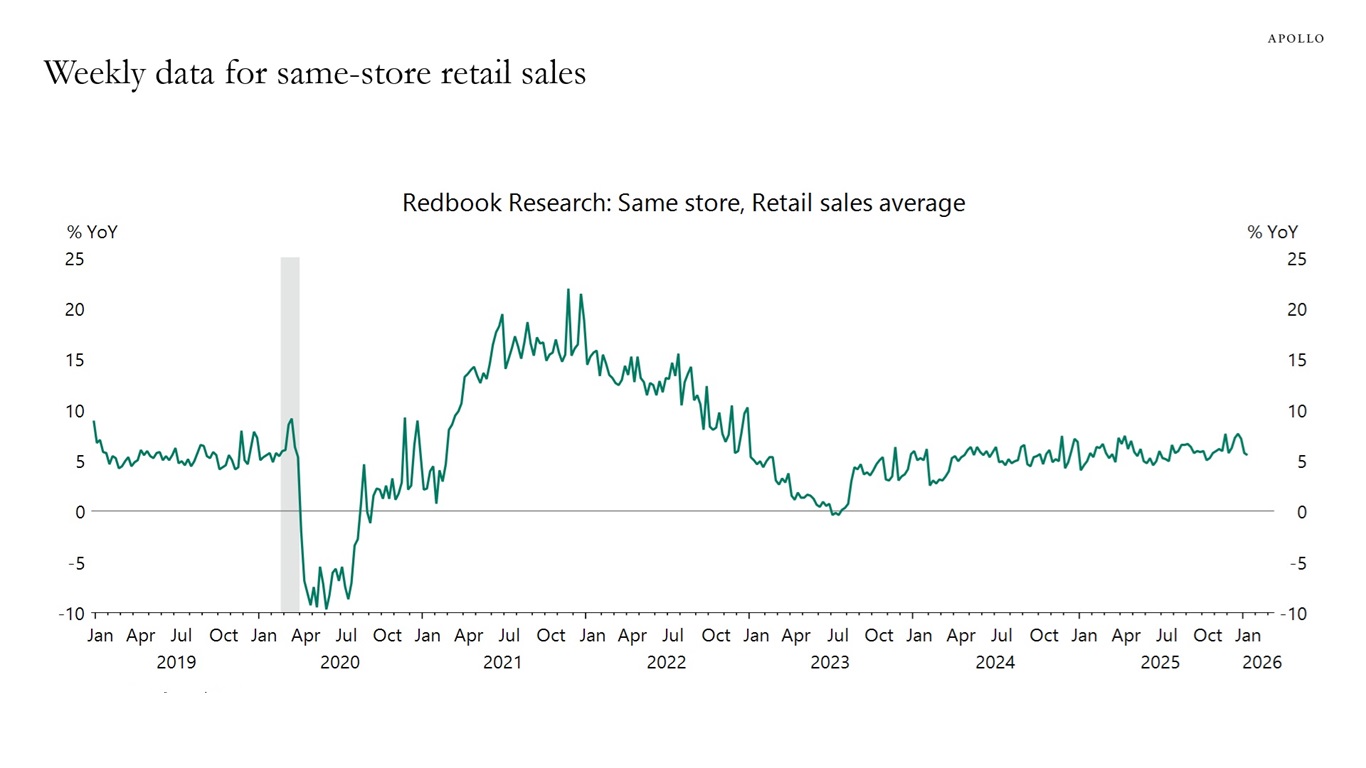
5. Weekly data for Redbook same-store retail sales continue to show solid growth in consumer spending.
The bottom line is that the US economy continues to perform well.
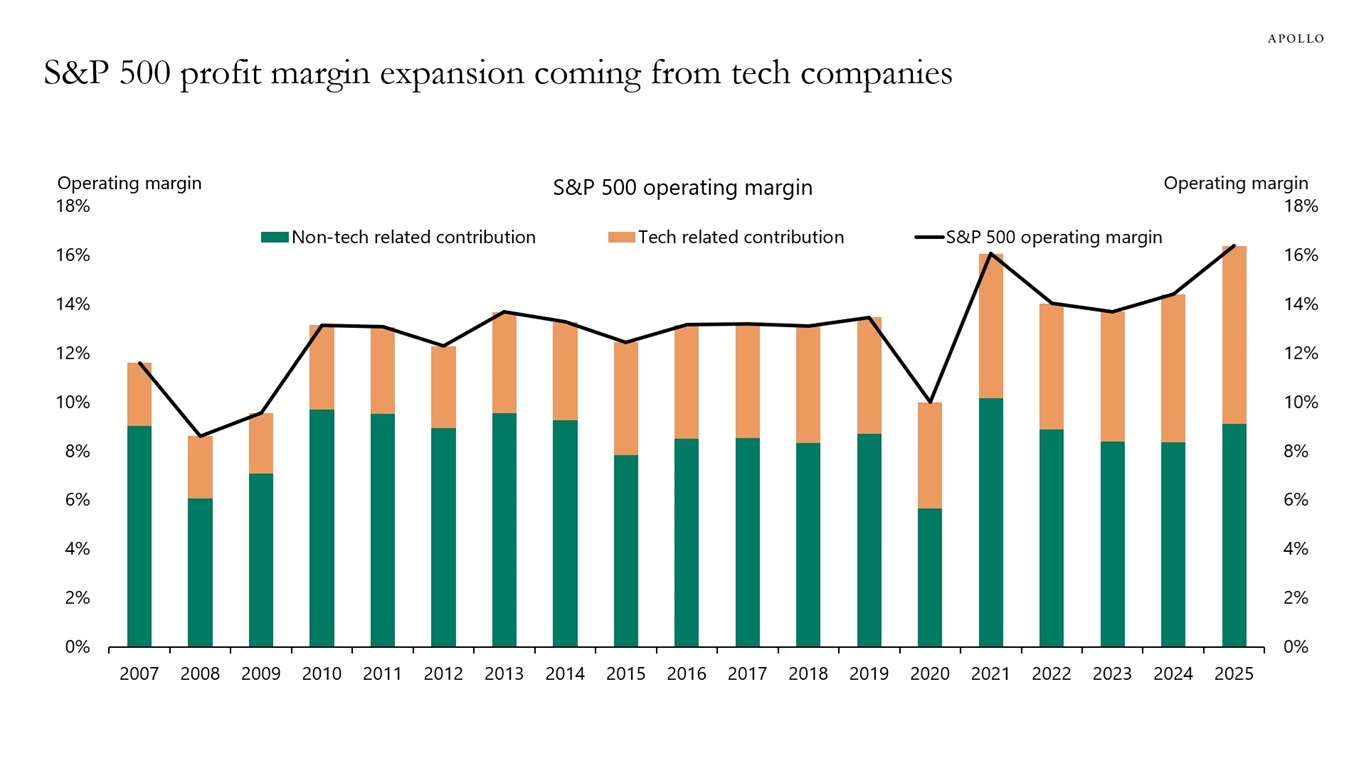
Operating margin measures the share of revenue left after covering operating expenses such as wages, materials and overhead. The chart below shows that over the past 20 years, all of the increase in the S&P 500’s operating margin has come from tech‑related sectors, while operating margins for non‑tech companies have stayed near 9%.