• Apollo.com
  • Login
  • Register Now
light site-logo
  • The Academy
  • Upcoming Events
        • Upcoming Events

  • Learning Center
        • New & UpdatedAlternative Investing Course 2.0

        • Alternative Investing Essentials Part OnePrivate Equity, Venture Capital, Private Credit
        • Alternative Investing Essentials Part TwoReal Estate, Infrastructure, Digital Assets, Hedge Funds
        • Practical ConsiderationsAsset Allocation, Risk Considerations, Fund Structures, Fees
        • Introductory Videos

          View All Videos

        •  Recent Classes & Videos

        • • 2026 Outlook
        • • Private Equity’s Edge: Delivering Alpha in a Changing Market
        • • Powering Innovation: Infrastructure Investing Across the AI Value Chain
        • • Mid-Year Outlook: At the Crossroads of Stagflation — What’s Next?
        • • Hybrid Investments: Flexible Structures for Volatile Times
        • • Private Credit Investing in Volatile Times
        • View All Classes

  • Alternative Perspectives
        • Investment Knowledge
        • The View from Apollo
          • Investment Knowledge White Papers

            After 60/40: In Private Markets, Manager Selection Matters

            February 27, 2026
          • The View From Apollo

            Allocation Insights: Asset-Backed Finance Is the Engine Behind Private Credit’s Next Chapter

            February 17, 2026
          • Investment Knowledge White Papers

            Private Equity Returns to Its Roots

            January 29, 2026
  • The Daily Spark
        • Read The Daily Spark Blog


        • Want it delivered daily to your inbox?
          • The Daily Spark

            Strong Net Foreign Buying of US Assets

            March 2, 2026
          • The Daily Spark

            Average Tenure of Companies in the S&P 500 Index: 15 Years

            March 1, 2026
          • The Daily Spark

            Fed Pricing Reveals Market Expectations About the AI Adoption Pace

            February 28, 2026
  • Register for Apollo Academy: Alternative Investing Course
  • Login
  • About Apollo Academy
  • Upcoming Events
  • Learning Center
  • Alternative Perspectives
  • The Daily Spark
  • Register for Apollo Academy: Alternative Investing Course
  • Login
  • Alternative Investing Course 2.0
  • 2026 Outlook
  • Private Equity’s Edge: Delivering Alpha in a Changing Market
  • Powering Innovation: Infrastructure Investing Across the AI Value Chain
  • Mid-Year Outlook: At the Crossroads of Stagflation — What’s Next?
  • Hybrid Investments: Flexible Structures for Volatile Times
  • Private Credit Investing in Volatile Times
  • View All Classes
  • Introductory Videos
  • Alternative Investing Essentials Part One • Now Available On Demand
  • Alternative Investing Essentials Part Two • Now Available On Demand
  • Practical Considerations • Now Available On Demand
  • Investment Knowledge
  • The View from Apollo
Home February 2026

Fed Pricing Reveals Market Expectations About the AI Adoption Pace

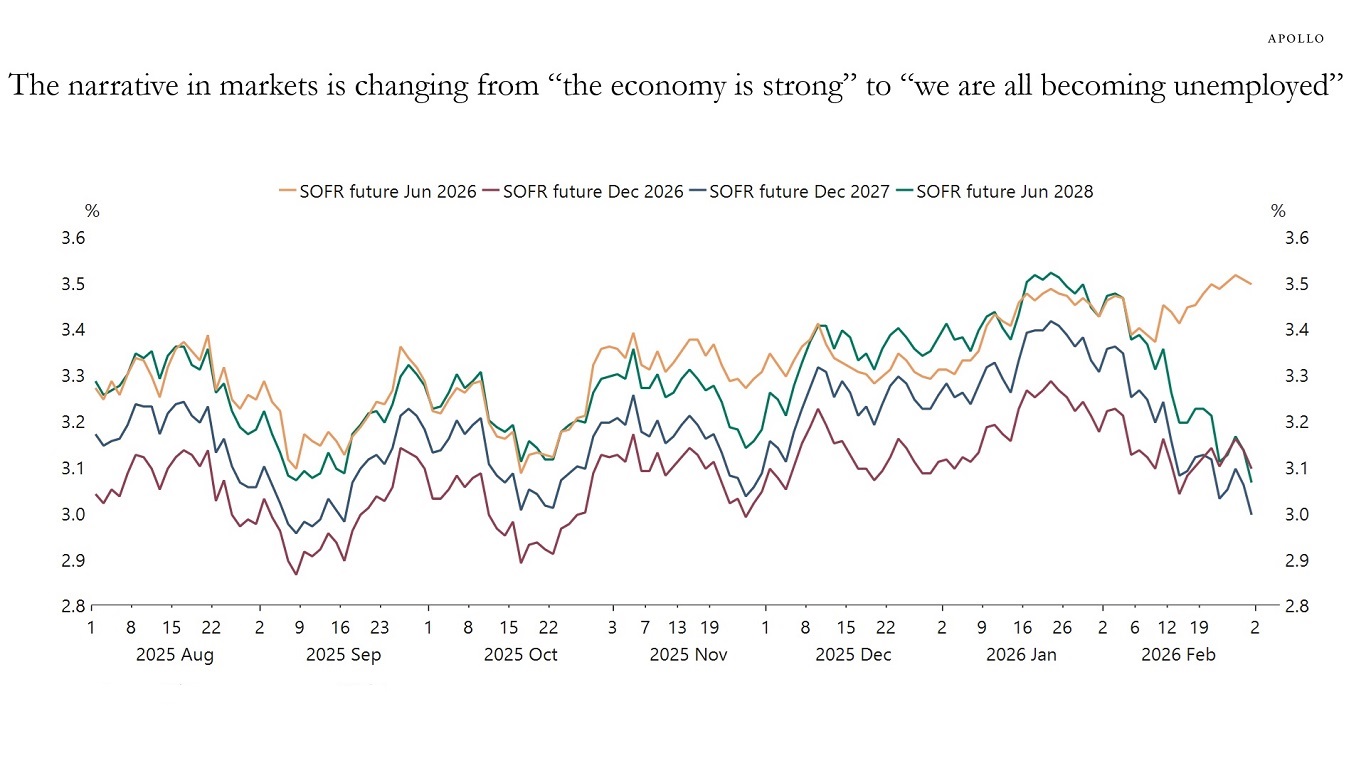
The dramatic change in recent weeks in the narrative in markets from “the economy is strong” to “we are all becoming unemployed” is truly remarkable.

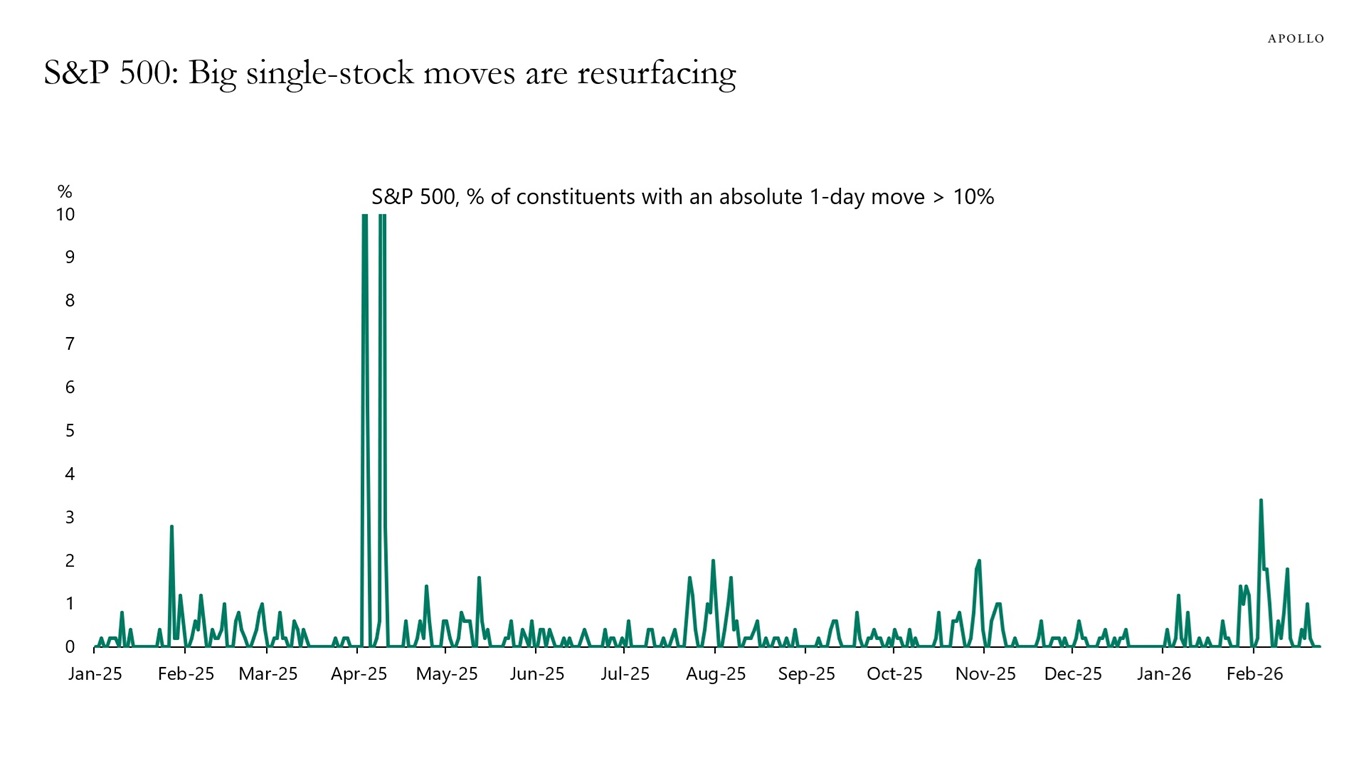
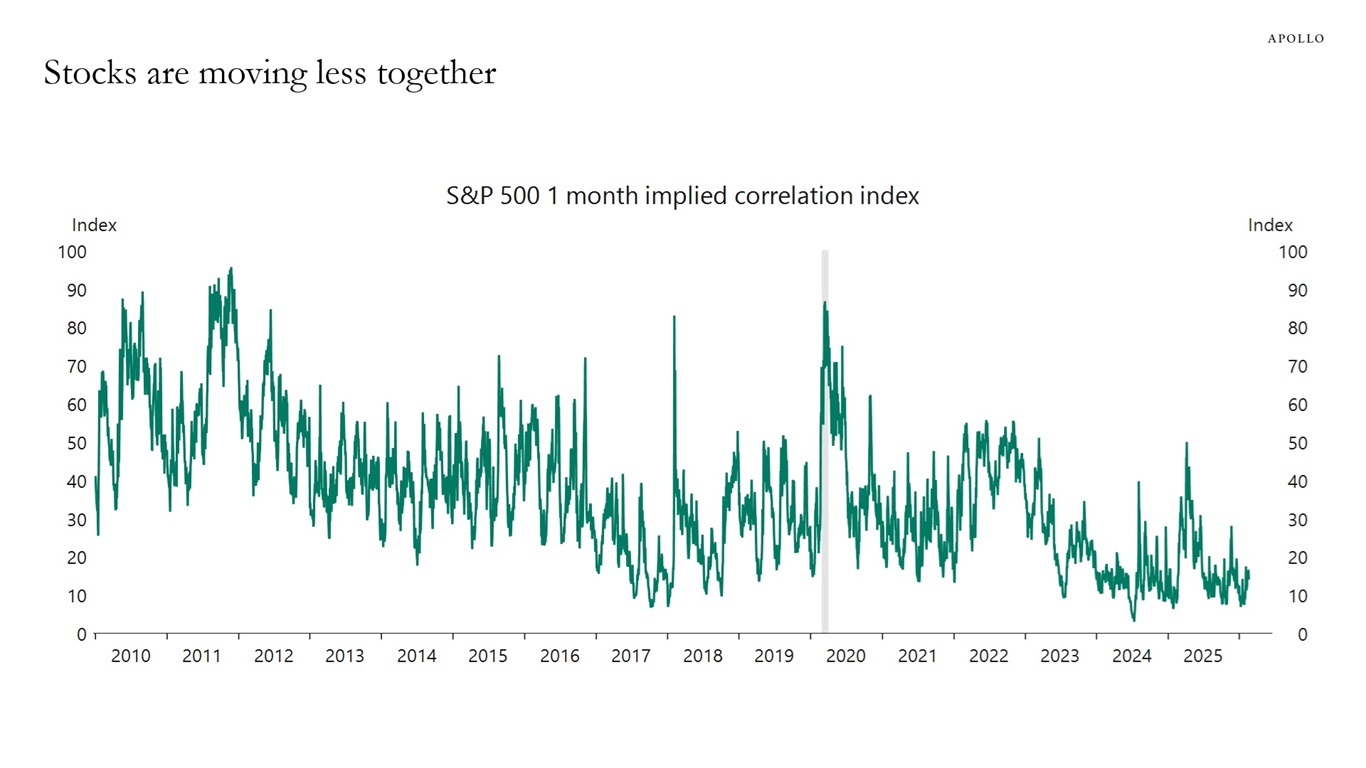
AI expectations are no longer just disrupting the equity market, with sectors such as software under pressure.

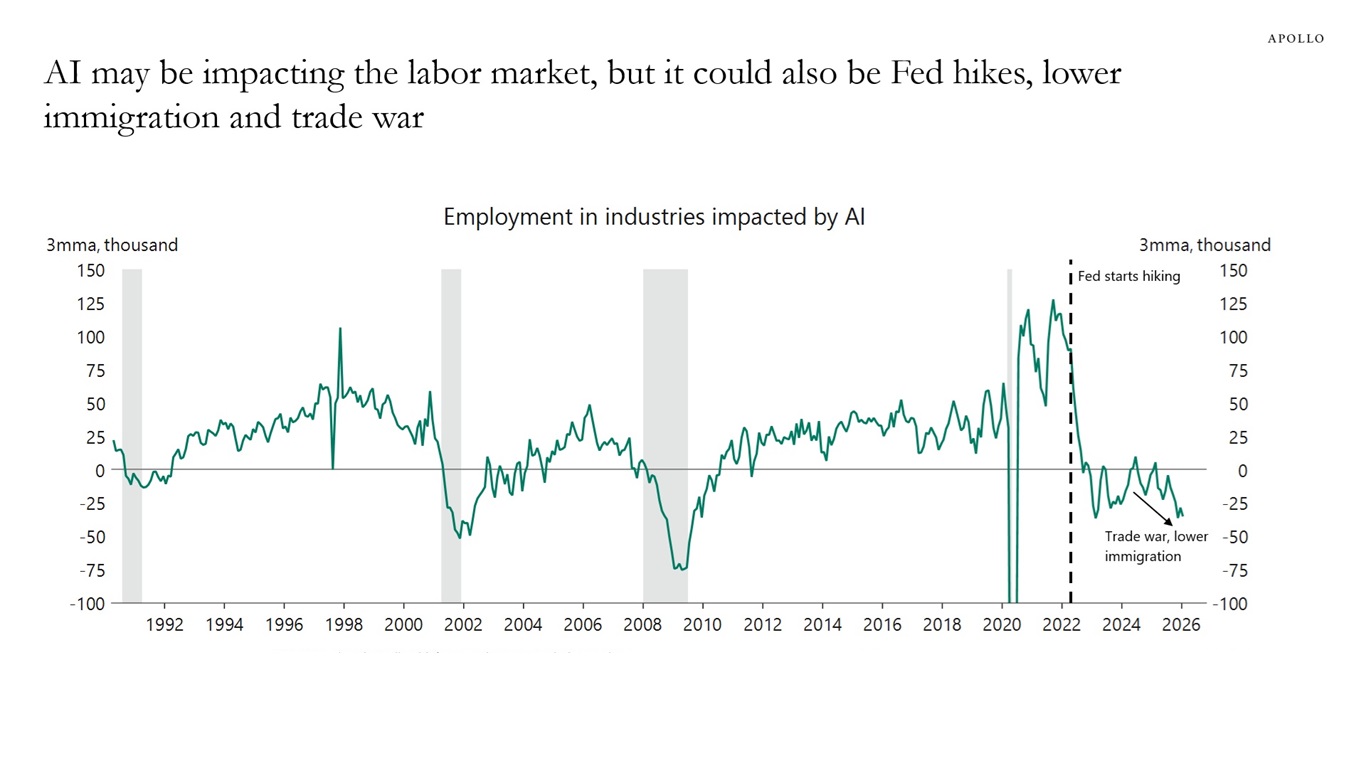
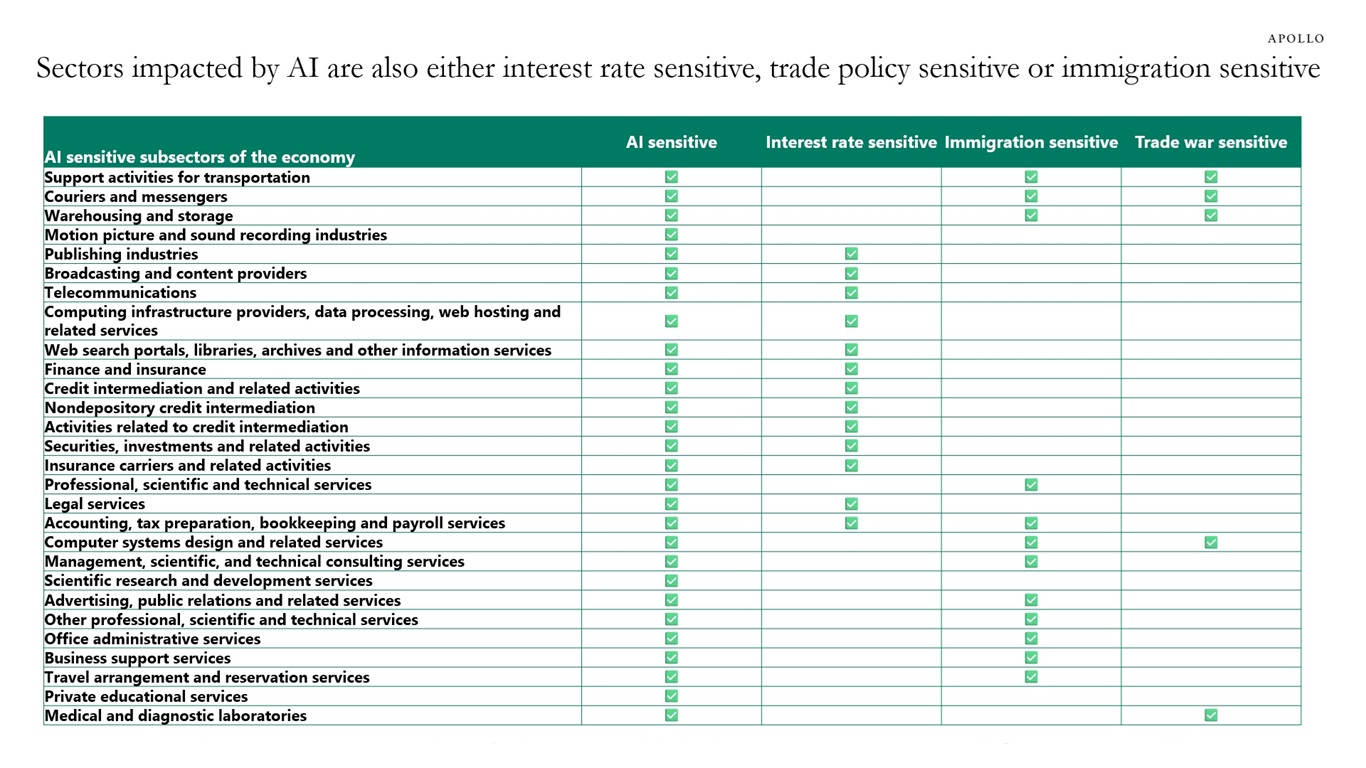
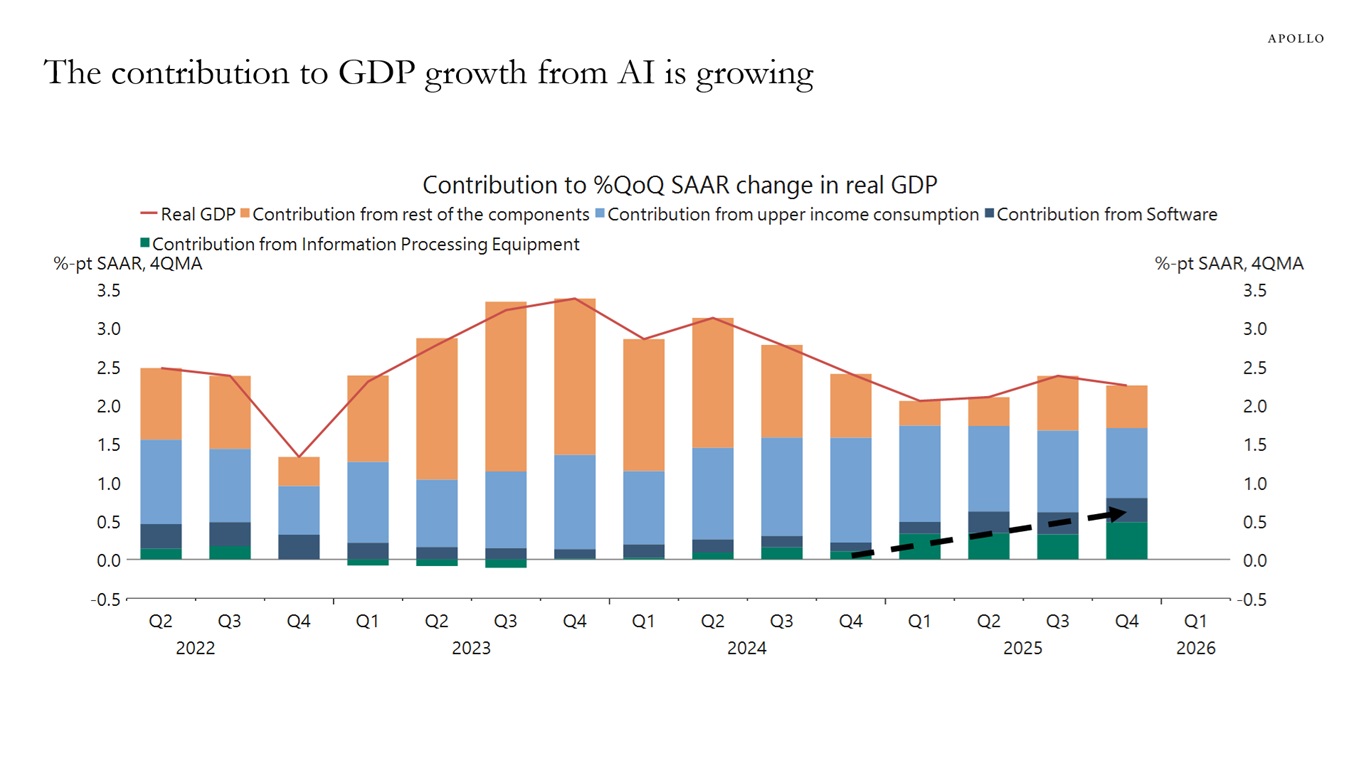
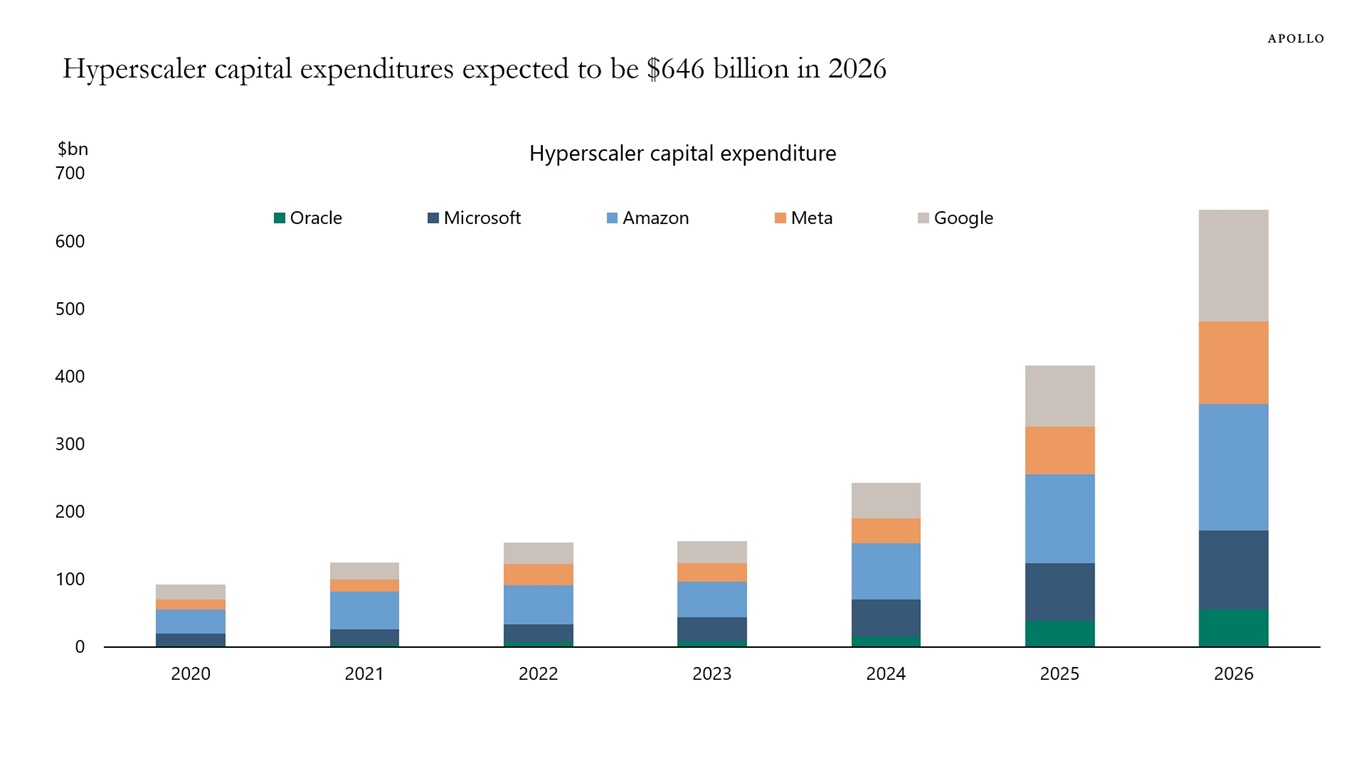
AI expectations have also sparked a macro conversation about a coming rise in the unemployment rate, despite no change in the underlying incoming economic story of a strong US economy driven by AI spending, the industrial renaissance and the One Big Beautiful Bill.

The bottom line is that rates investors are now pricing in rapid AI adoption that will push the unemployment rate higher and warrant many more Fed cuts by December 2026, see chart below.

In other words, markets are starting to believe the techno-optimists’ view of the world, rather than the more measured Fed and economist view.

I think the techno-optimists are wrong about the macro impact, and AI adoption is going to take much longer than the 12-18 months they talk about, and the overall impact on productivity will be much more muted.

Put differently, looking ahead to December 2026, the risk of an overheating economy remains larger than the risk of the unemployment rate going to 10%.

The narrative in markets is changing from “the economy is strong” to “we are all becoming unemployed”
Sources: Bloomberg, Macrobond, Apollo Chief Economist

Download high-res chart

Recent Posts

  • Strong Net Foreign Buying of US Assets
  • Average Tenure of Companies in the S&P 500 Index: 15 Years
  • Fed Pricing Reveals Market Expectations About the AI Adoption Pace
  • After 60/40: In Private Markets, Manager Selection Matters
  • Equity Market Trading Volumes Rising

Recent Comments

No comments to show.

Archives

  • March 2026
  • February 2026
  • January 2026
  • December 2025
  • November 2025
  • October 2025
  • September 2025
  • August 2025
  • July 2025
  • June 2025
  • May 2025
  • April 2025
  • March 2025
  • February 2025
  • January 2025
  • December 2024
  • November 2024
  • October 2024
  • September 2024
  • August 2024
  • July 2024
  • June 2024
  • May 2024
  • April 2024
  • March 2024
  • February 2024
  • January 2024
  • December 2023
  • November 2023
  • October 2023
  • September 2023
  • August 2023
  • July 2023
  • June 2023
  • May 2023
  • April 2023
  • March 2023
  • February 2023
  • January 2023
  • December 2022
  • November 2022
  • October 2022
  • September 2022
  • August 2022
  • July 2022
  • June 2022
  • May 2022
  • April 2022
  • March 2022
  • February 2022
  • January 2022
  • December 2021
  • November 2021

Categories

  • Apollo Answers
  • Course Introductions
  • Economic Intelligence
  • Hide from Wordpress Search
  • Investment Knowledge
  • Perspectives
  • Redirecting
  • The Daily Spark
  • The View from Apollo
  • The Weekly Brief
  • Uncategorized
  • White Papers

After 60/40: In Private Markets, Manager Selection Matters

While public markets have largely become a source of beta, dispersion among managers in the private markets remains wide.

Public Markets Are a Source of Beta

Public markets have increasingly come to function as sources of beta rather than arenas where managers can consistently add value through active management. Over long horizons, most active equity managers have failed to outperform broad market benchmarks, with 91% of public equity managers underperforming the S&P 500 over the past 20 years.

At the same time, the share of assets managed passively has surged as investors embrace low-cost, index-tracking strategies. Passive funds now represent almost 40% of all managed funds, reflecting a dramatic shift of capital toward strategies that deliver market beta rather than trying (and often failing) to beat it.

Sources: Left: S&P Global as of June 30, 2025 (latest available). Right: Bloomberg, S&P LCD and Apollo Chief Economist as of September 30, 2025. Includes both equity and fixed income index funds.

Private Market Alpha Exists (But Is Not Evenly Captured)

As we recently discussed, incorporating private markets into a traditional 60/40 portfolio of public stocks and bonds has historically enhanced returns while reducing overall risk. That said, performance dispersion in private markets is meaningfully wider than in public markets. As the chart below illustrates, private markets have delivered higher median returns than their public counterparts, but with significantly greater variability across managers. In private equity, the return gap between top- and bottom-decile managers is almost 30%, compared with just 2% in public equities. A similar pattern holds in credit, where private debt shows a 13% spread versus roughly 1% in public fixed income. This dispersion has implications beyond headline returns. Distributions — an increasingly important focus for private market investors in today’s environment — also vary materially by manager. PitchBook data shows that portfolio companies acquired at higher entry multiples have taken substantially longer to exit than those purchased at lower valuations, a dynamic that has become even more pronounced in recent vintages.

Historically Higher Returns, Wider Outcomes

For illustrative purposes only. Subject to change at any time without notice. Past performance is not indicative of nor a guarantee of future results. Public equity data is from Morningstar US large blend and public fixed income data is from Morningstar US fund intermediate core bond 20-year return dispersion data through December 2025. All other asset classes are sourced from the PitchBook database of funds across vintage years 2005–2019 as of March 2025 (20-year IRR). The primary metric is IRR; private debt includes CLOs, direct lending, special situations, distressed, mezzanine, bridge financing, RE debt, infrastructure debt, venture debt; private equity includes buyout, growth/expansion, diversified private equity, turnaround; real assets include real estate and infrastructure, real estate includes core, core plus, value added, opportunistic and distressed; venture capital includes angel fund, early stage, later stage; secondaries include all asset classes; private capital includes private equity, VC, real estate, infrastructure, private debt, secondaries.
DOWNLOAD THE ARTICLE

The information herein is provided for educational purposes only and should not be construed as financial or investment advice, nor should any information in this document be relied on when making an investment decision. Opinions and views expressed reflect the current opinions and views of the authors and Apollo Analysts as of the date hereof and are subject to change. Please see the end of this document for important disclosure information.


Important Disclosure Information

This presentation is for educational purposes only and should not be treated as research. This presentation may not be distributed, transmitted or otherwise communicated to others, in whole or in part, without the express written consent of Apollo Global Management, Inc. (together with its subsidiaries, “Apollo”).

The views and opinions expressed in this presentation are the views and opinions of the author(s) of the White Paper. They do not necessarily reflect the views and opinions of Apollo and are subject to change at any time without notice. Further, Apollo and its affiliates may have positions (long or short) or engage in securities transactions that are not consistent with the information and views expressed in this presentation. There can be no assurance that an investment strategy will be successful. Historic market trends are not reliable indicators of actual future market behavior or future performance of any particular investment which may differ materially, and should not be relied upon as such. Target allocations contained herein are subject to change. There is no assurance that the target allocations will be achieved, and actual allocations may be significantly different than that shown here. This presentation does not constitute an offer of any service or product of Apollo. It is not an invitation by or on behalf of Apollo to any person to buy or sell any security or to adopt any investment strategy, and shall not form the basis of, nor may it accompany nor form part of, any right or contract to buy or sell any security or to adopt any investment strategy. Nothing herein should be taken as investment advice or a recommendation to enter into any transaction.

Hyperlinks to third-party websites in this presentation are provided for reader convenience only. There can be no assurance that any trends discussed herein will continue. Unless otherwise noted, information included herein is presented as of the dates indicated. This presentation is not complete and the information contained herein may change at any time without notice. Apollo does not have any responsibility to update the presentation to account for such changes. Apollo has not made any representation or warranty, expressed or implied, with respect to fairness, correctness, accuracy, reasonableness, or completeness of any of the information contained herein, and expressly disclaims any responsibility or liability therefore. The information contained herein is not intended to provide, and should not be relied upon for, accounting, legal or tax advice or investment recommendations. Investors should make an independent investigation of the information contained herein, including consulting their tax, legal, accounting or other advisors about such information. Apollo does not act for you and is not responsible for providing you with the protections afforded to its clients.

Certain information contained herein may be “forward-looking” in nature. Due to various risks and uncertainties, actual events or results may differ materially from those reflected or contemplated in such forward-looking information. As such, undue reliance should not be placed on such information. Forward-looking statements may be identified by the use of terminology including, but not limited to, “may”, “will”, “should”, “expect”, “anticipate”, “target”, “project”, “estimate”, “intend”, “continue” or “believe” or the negatives thereof or other variations thereon or comparable terminology.

The Standard & Poor’s 500 (“S&P 500”) Index is a market-capitalization-weighted index of the 500 largest U.S. publicly traded companies by market value.

Additional information may be available upon request.

Recent Posts

  • Strong Net Foreign Buying of US Assets
  • Average Tenure of Companies in the S&P 500 Index: 15 Years
  • Fed Pricing Reveals Market Expectations About the AI Adoption Pace
  • After 60/40: In Private Markets, Manager Selection Matters
  • Equity Market Trading Volumes Rising

Recent Comments

No comments to show.

Archives

  • March 2026
  • February 2026
  • January 2026
  • December 2025
  • November 2025
  • October 2025
  • September 2025
  • August 2025
  • July 2025
  • June 2025
  • May 2025
  • April 2025
  • March 2025
  • February 2025
  • January 2025
  • December 2024
  • November 2024
  • October 2024
  • September 2024
  • August 2024
  • July 2024
  • June 2024
  • May 2024
  • April 2024
  • March 2024
  • February 2024
  • January 2024
  • December 2023
  • November 2023
  • October 2023
  • September 2023
  • August 2023
  • July 2023
  • June 2023
  • May 2023
  • April 2023
  • March 2023
  • February 2023
  • January 2023
  • December 2022
  • November 2022
  • October 2022
  • September 2022
  • August 2022
  • July 2022
  • June 2022
  • May 2022
  • April 2022
  • March 2022
  • February 2022
  • January 2022
  • December 2021
  • November 2021

Categories

  • Apollo Answers
  • Course Introductions
  • Economic Intelligence
  • Hide from Wordpress Search
  • Investment Knowledge
  • Perspectives
  • Redirecting
  • The Daily Spark
  • The View from Apollo
  • The Weekly Brief
  • Uncategorized
  • White Papers

Equity Market Trading Volumes Rising

The average daily US equity market turnover now exceeds $1 trillion, driven by higher retail participation, more high-frequency trading and recent tech-sector volatility, see chart below.

Equity market trading volumes have doubled since 2023
Sources: Bloomberg, Apollo Chief Economist

Download high-res chart

Recent Posts

  • Strong Net Foreign Buying of US Assets
  • Average Tenure of Companies in the S&P 500 Index: 15 Years
  • Fed Pricing Reveals Market Expectations About the AI Adoption Pace
  • After 60/40: In Private Markets, Manager Selection Matters
  • Equity Market Trading Volumes Rising

Recent Comments

No comments to show.

Archives

  • March 2026
  • February 2026
  • January 2026
  • December 2025
  • November 2025
  • October 2025
  • September 2025
  • August 2025
  • July 2025
  • June 2025
  • May 2025
  • April 2025
  • March 2025
  • February 2025
  • January 2025
  • December 2024
  • November 2024
  • October 2024
  • September 2024
  • August 2024
  • July 2024
  • June 2024
  • May 2024
  • April 2024
  • March 2024
  • February 2024
  • January 2024
  • December 2023
  • November 2023
  • October 2023
  • September 2023
  • August 2023
  • July 2023
  • June 2023
  • May 2023
  • April 2023
  • March 2023
  • February 2023
  • January 2023
  • December 2022
  • November 2022
  • October 2022
  • September 2022
  • August 2022
  • July 2022
  • June 2022
  • May 2022
  • April 2022
  • March 2022
  • February 2022
  • January 2022
  • December 2021
  • November 2021

Categories

  • Apollo Answers
  • Course Introductions
  • Economic Intelligence
  • Hide from Wordpress Search
  • Investment Knowledge
  • Perspectives
  • Redirecting
  • The Daily Spark
  • The View from Apollo
  • The Weekly Brief
  • Uncategorized
  • White Papers

Confusing AI with Fed Hikes

Economic research institutions have identified sectors and occupations that are likely to be vulnerable to AI, see for example here, here and here.

But employment declines in AI-exposed industries since 2022 are being overattributed to ChatGPT, see the first chart below.

Since late 2022, those same industries have also been hit by three major overlapping shocks: Fed tightening, trade-war uncertainty and a meaningful slowdown in immigration-driven labor supply.

The bottom line is that a large share of the AI-sensitive sectors of the economy is also rate, trade or immigration-sensitive, see the second chart.

Hence, the slowdown in employment in AI-exposed sectors is likely driven by some combination of all these factors rather than only AI.

AI may be impacting the labor market, but it could also be Fed hikes, lower immigration and trade war
Note: Includes employment in professional & business services, office & administrative services, accounting & book keeping, legal services, computer systems design, public relations, publishing, broadcasting, data processing & hosting, credit intermediation, insurance, warehousing & storage, couriers & messengers, transportation support services, telecommunications, medical & diagnostic laboratories and motion picture & sound recording industries. Sources: US Bureau of Labor Statistics (BLS), Macrobond, Apollo Chief Economist
Sectors impacted by AI are also either interest rate sensitive, trade policy sensitive or immigration sensitive
Source: Apollo Chief Economist, Fed: Educational Exposure to Generative Artificial Intelligence, https://www.federalreserve.gov/econres/notes/feds-notes/educational-exposure-to-generative-artificial-intelligence-20250226.html, February 2025

Download high-res charts

Recent Posts

  • Strong Net Foreign Buying of US Assets
  • Average Tenure of Companies in the S&P 500 Index: 15 Years
  • Fed Pricing Reveals Market Expectations About the AI Adoption Pace
  • After 60/40: In Private Markets, Manager Selection Matters
  • Equity Market Trading Volumes Rising

Recent Comments

No comments to show.

Archives

  • March 2026
  • February 2026
  • January 2026
  • December 2025
  • November 2025
  • October 2025
  • September 2025
  • August 2025
  • July 2025
  • June 2025
  • May 2025
  • April 2025
  • March 2025
  • February 2025
  • January 2025
  • December 2024
  • November 2024
  • October 2024
  • September 2024
  • August 2024
  • July 2024
  • June 2024
  • May 2024
  • April 2024
  • March 2024
  • February 2024
  • January 2024
  • December 2023
  • November 2023
  • October 2023
  • September 2023
  • August 2023
  • July 2023
  • June 2023
  • May 2023
  • April 2023
  • March 2023
  • February 2023
  • January 2023
  • December 2022
  • November 2022
  • October 2022
  • September 2022
  • August 2022
  • July 2022
  • June 2022
  • May 2022
  • April 2022
  • March 2022
  • February 2022
  • January 2022
  • December 2021
  • November 2021

Categories

  • Apollo Answers
  • Course Introductions
  • Economic Intelligence
  • Hide from Wordpress Search
  • Investment Knowledge
  • Perspectives
  • Redirecting
  • The Daily Spark
  • The View from Apollo
  • The Weekly Brief
  • Uncategorized
  • White Papers

Entire Market Structure Exposed to a Big Move

The share of S&P 500 names moving more than 10% in a single day has increased, and high dispersion and low implied correlation suggest stocks are increasingly trading on their own fundamentals, see charts below. At the same time, options activity remains extremely elevated, consistent with heavy retail speculation and leverage-like exposure. Larger idiosyncratic moves and outsized options participation leave the market structure more fragile and more vulnerable to an abrupt, outsized move.

S&P 500: Big single-stock moves are resurfacing
Sources: Bloomberg, Apollo Chief Economist
Stocks are moving less together
Note: It is the option-implied estimate of average pairwise correlation among S&P 500 constituents over one month. Sources: Bloomberg, Macrobond, Apollo Chief Economist
Dispersion remains elevated, wider gap between winners and losers
Sources: Bloomberg, Macrobond, Apollo Chief Economist
Speculative activity remains unusually heavy in options market
Sources: Bloomberg, Apollo Chief Economist

Download high-res charts

Recent Posts

  • Strong Net Foreign Buying of US Assets
  • Average Tenure of Companies in the S&P 500 Index: 15 Years
  • Fed Pricing Reveals Market Expectations About the AI Adoption Pace
  • After 60/40: In Private Markets, Manager Selection Matters
  • Equity Market Trading Volumes Rising

Recent Comments

No comments to show.

Archives

  • March 2026
  • February 2026
  • January 2026
  • December 2025
  • November 2025
  • October 2025
  • September 2025
  • August 2025
  • July 2025
  • June 2025
  • May 2025
  • April 2025
  • March 2025
  • February 2025
  • January 2025
  • December 2024
  • November 2024
  • October 2024
  • September 2024
  • August 2024
  • July 2024
  • June 2024
  • May 2024
  • April 2024
  • March 2024
  • February 2024
  • January 2024
  • December 2023
  • November 2023
  • October 2023
  • September 2023
  • August 2023
  • July 2023
  • June 2023
  • May 2023
  • April 2023
  • March 2023
  • February 2023
  • January 2023
  • December 2022
  • November 2022
  • October 2022
  • September 2022
  • August 2022
  • July 2022
  • June 2022
  • May 2022
  • April 2022
  • March 2022
  • February 2022
  • January 2022
  • December 2021
  • November 2021

Categories

  • Apollo Answers
  • Course Introductions
  • Economic Intelligence
  • Hide from Wordpress Search
  • Investment Knowledge
  • Perspectives
  • Redirecting
  • The Daily Spark
  • The View from Apollo
  • The Weekly Brief
  • Uncategorized
  • White Papers

Tail Risks Rising: From 10% to 30%

The US economy continues to perform well. But the tail risks have increased from 10% to 30%.

What could suddenly change the current situation?

It could be geopolitics, government debt levels or a rapid rise or fall in interest rates.

Predicting the future path of AI adoption and productivity is particularly challenging.

The contribution to GDP growth from AI spending continues to increase, and as a result, if AI fails to meet expectations, the recession probability will rise, see chart below.

Similarly, if AI were to trigger a sharp rise in unemployment, it could also have a disruptive impact on the economy and financial markets.

We remain constructive on the US economic outlook, but investors should pay closer attention to tail risks than usual, because the risk of a sudden shift in investor sentiment is rising.

The contribution to GDP growth from AI is growing
Note: Assuming upper income constitutes 60% consumption. Sources: US Bureau of Economic Analysis (BEA), Macrobond, Apollo Chief Economist

Download high-res chart

Recent Posts

  • Strong Net Foreign Buying of US Assets
  • Average Tenure of Companies in the S&P 500 Index: 15 Years
  • Fed Pricing Reveals Market Expectations About the AI Adoption Pace
  • After 60/40: In Private Markets, Manager Selection Matters
  • Equity Market Trading Volumes Rising

Recent Comments

No comments to show.

Archives

  • March 2026
  • February 2026
  • January 2026
  • December 2025
  • November 2025
  • October 2025
  • September 2025
  • August 2025
  • July 2025
  • June 2025
  • May 2025
  • April 2025
  • March 2025
  • February 2025
  • January 2025
  • December 2024
  • November 2024
  • October 2024
  • September 2024
  • August 2024
  • July 2024
  • June 2024
  • May 2024
  • April 2024
  • March 2024
  • February 2024
  • January 2024
  • December 2023
  • November 2023
  • October 2023
  • September 2023
  • August 2023
  • July 2023
  • June 2023
  • May 2023
  • April 2023
  • March 2023
  • February 2023
  • January 2023
  • December 2022
  • November 2022
  • October 2022
  • September 2022
  • August 2022
  • July 2022
  • June 2022
  • May 2022
  • April 2022
  • March 2022
  • February 2022
  • January 2022
  • December 2021
  • November 2021

Categories

  • Apollo Answers
  • Course Introductions
  • Economic Intelligence
  • Hide from Wordpress Search
  • Investment Knowledge
  • Perspectives
  • Redirecting
  • The Daily Spark
  • The View from Apollo
  • The Weekly Brief
  • Uncategorized
  • White Papers

ETF Inflows in India: Gold = Equity

The appetite for buying gold has increased significantly in recent months in India, see chart below.

India: Inflows into gold ETFs are similar to inflows into equity ETFs
Note: Gold prices are INR per troy ounce. Sources: Association of Mutual Funds in India, Macrobond, Apollo Chief Economist

Download high-res chart

Recent Posts

  • Strong Net Foreign Buying of US Assets
  • Average Tenure of Companies in the S&P 500 Index: 15 Years
  • Fed Pricing Reveals Market Expectations About the AI Adoption Pace
  • After 60/40: In Private Markets, Manager Selection Matters
  • Equity Market Trading Volumes Rising

Recent Comments

No comments to show.

Archives

  • March 2026
  • February 2026
  • January 2026
  • December 2025
  • November 2025
  • October 2025
  • September 2025
  • August 2025
  • July 2025
  • June 2025
  • May 2025
  • April 2025
  • March 2025
  • February 2025
  • January 2025
  • December 2024
  • November 2024
  • October 2024
  • September 2024
  • August 2024
  • July 2024
  • June 2024
  • May 2024
  • April 2024
  • March 2024
  • February 2024
  • January 2024
  • December 2023
  • November 2023
  • October 2023
  • September 2023
  • August 2023
  • July 2023
  • June 2023
  • May 2023
  • April 2023
  • March 2023
  • February 2023
  • January 2023
  • December 2022
  • November 2022
  • October 2022
  • September 2022
  • August 2022
  • July 2022
  • June 2022
  • May 2022
  • April 2022
  • March 2022
  • February 2022
  • January 2022
  • December 2021
  • November 2021

Categories

  • Apollo Answers
  • Course Introductions
  • Economic Intelligence
  • Hide from Wordpress Search
  • Investment Knowledge
  • Perspectives
  • Redirecting
  • The Daily Spark
  • The View from Apollo
  • The Weekly Brief
  • Uncategorized
  • White Papers

How Much Is $646 Billion?

The amount of money being spent on capex by hyperscalers is enormous at around $646 billion in 2026.

The charts in this chart book put that number into perspective.

Specifically:

  1. Hyperscaler capex is expected in 2026 to be at approximately $646 billion, or about 2% of US GDP.
  2. For comparison, annual growth in consumer spending is currently around $1 trillion.
  3. US hyperscaler capex at $646 billion is roughly equivalent to the size of GDP for Singapore, Sweden and Argentina.
  4. For comparison, total US bank loan growth in 2025 was around $700 billion.
  5. For comparison, defense spending in 2025 was at $917 billion.
  6. Hyperscaler capex is more than the combined military spending of Germany, France, UK, Japan, Italy and Canada.
  7. Hyperscaler capex is roughly the same size as the market cap of the stock markets in Belgium, Denmark and Indonesia.
Hyperscaler capital expenditures expected to be $646 billion in 2026
Sources: FactSet, Apollo Chief Economist

Download high-res chart book

Recent Posts

  • Strong Net Foreign Buying of US Assets
  • Average Tenure of Companies in the S&P 500 Index: 15 Years
  • Fed Pricing Reveals Market Expectations About the AI Adoption Pace
  • After 60/40: In Private Markets, Manager Selection Matters
  • Equity Market Trading Volumes Rising

Recent Comments

No comments to show.

Archives

  • March 2026
  • February 2026
  • January 2026
  • December 2025
  • November 2025
  • October 2025
  • September 2025
  • August 2025
  • July 2025
  • June 2025
  • May 2025
  • April 2025
  • March 2025
  • February 2025
  • January 2025
  • December 2024
  • November 2024
  • October 2024
  • September 2024
  • August 2024
  • July 2024
  • June 2024
  • May 2024
  • April 2024
  • March 2024
  • February 2024
  • January 2024
  • December 2023
  • November 2023
  • October 2023
  • September 2023
  • August 2023
  • July 2023
  • June 2023
  • May 2023
  • April 2023
  • March 2023
  • February 2023
  • January 2023
  • December 2022
  • November 2022
  • October 2022
  • September 2022
  • August 2022
  • July 2022
  • June 2022
  • May 2022
  • April 2022
  • March 2022
  • February 2022
  • January 2022
  • December 2021
  • November 2021

Categories

  • Apollo Answers
  • Course Introductions
  • Economic Intelligence
  • Hide from Wordpress Search
  • Investment Knowledge
  • Perspectives
  • Redirecting
  • The Daily Spark
  • The View from Apollo
  • The Weekly Brief
  • Uncategorized
  • White Papers

Disruption Creates Opportunities for Investors

If the economy enters a recession, it is a problem for all credit markets. But there are also situations where only one sector is hit by some shock, while the rest of the economy is fine.

This is the situation we are in today with software.

For software, the problem is not only the threat from AI but also the rise in the cost of capital following the Fed’s 2022 interest rate hikes.

History is full of episodes where changes in the cost of capital and sector-specific factors have created opportunities in credit markets, see chart below. For example, the energy credit cycle from 2014 to 2016, the brick-and-mortar retail cycle from 2016 to 2019 and the commercial real estate cycle from 2022 to 2024.

The bottom line is that individual sectors of the economy can be in distress while the rest remain fine. In fact, that is what creative destruction and disruption are all about.

In short: In a capitalist economy where new products are invented every day, the only constant is change, and that is where opportunities arise for credit investors.

Factors driving credit markets
Source: Apollo Chief Economist

Download high-res chart

Recent Posts

  • Strong Net Foreign Buying of US Assets
  • Average Tenure of Companies in the S&P 500 Index: 15 Years
  • Fed Pricing Reveals Market Expectations About the AI Adoption Pace
  • After 60/40: In Private Markets, Manager Selection Matters
  • Equity Market Trading Volumes Rising

Recent Comments

No comments to show.

Archives

  • March 2026
  • February 2026
  • January 2026
  • December 2025
  • November 2025
  • October 2025
  • September 2025
  • August 2025
  • July 2025
  • June 2025
  • May 2025
  • April 2025
  • March 2025
  • February 2025
  • January 2025
  • December 2024
  • November 2024
  • October 2024
  • September 2024
  • August 2024
  • July 2024
  • June 2024
  • May 2024
  • April 2024
  • March 2024
  • February 2024
  • January 2024
  • December 2023
  • November 2023
  • October 2023
  • September 2023
  • August 2023
  • July 2023
  • June 2023
  • May 2023
  • April 2023
  • March 2023
  • February 2023
  • January 2023
  • December 2022
  • November 2022
  • October 2022
  • September 2022
  • August 2022
  • July 2022
  • June 2022
  • May 2022
  • April 2022
  • March 2022
  • February 2022
  • January 2022
  • December 2021
  • November 2021

Categories

  • Apollo Answers
  • Course Introductions
  • Economic Intelligence
  • Hide from Wordpress Search
  • Investment Knowledge
  • Perspectives
  • Redirecting
  • The Daily Spark
  • The View from Apollo
  • The Weekly Brief
  • Uncategorized
  • White Papers

Strong 30-Year Treasury Auction

The latest 30-year Treasury auction shows continued strong buying of US duration with public tendered demand at the highest level on record, see chart below. Indirect bidders, who are normally a proxy for foreign demand, took 69.8%, well above the historical average at 64%. Primary dealers, who have to buy what others don’t, were left with only 5.9%. The bottom line is that Treasury auction metrics show that there continues to be very solid demand for the long end in US Treasuries.

Demand for 30-year Treasuries at record-high level
Sources: Bloomberg, Macrobond, Apollo Chief Economist

Download high-res chart

Recent Posts

  • Strong Net Foreign Buying of US Assets
  • Average Tenure of Companies in the S&P 500 Index: 15 Years
  • Fed Pricing Reveals Market Expectations About the AI Adoption Pace
  • After 60/40: In Private Markets, Manager Selection Matters
  • Equity Market Trading Volumes Rising

Recent Comments

No comments to show.

Archives

  • March 2026
  • February 2026
  • January 2026
  • December 2025
  • November 2025
  • October 2025
  • September 2025
  • August 2025
  • July 2025
  • June 2025
  • May 2025
  • April 2025
  • March 2025
  • February 2025
  • January 2025
  • December 2024
  • November 2024
  • October 2024
  • September 2024
  • August 2024
  • July 2024
  • June 2024
  • May 2024
  • April 2024
  • March 2024
  • February 2024
  • January 2024
  • December 2023
  • November 2023
  • October 2023
  • September 2023
  • August 2023
  • July 2023
  • June 2023
  • May 2023
  • April 2023
  • March 2023
  • February 2023
  • January 2023
  • December 2022
  • November 2022
  • October 2022
  • September 2022
  • August 2022
  • July 2022
  • June 2022
  • May 2022
  • April 2022
  • March 2022
  • February 2022
  • January 2022
  • December 2021
  • November 2021

Categories

  • Apollo Answers
  • Course Introductions
  • Economic Intelligence
  • Hide from Wordpress Search
  • Investment Knowledge
  • Perspectives
  • Redirecting
  • The Daily Spark
  • The View from Apollo
  • The Weekly Brief
  • Uncategorized
  • White Papers

Posts navigation

Page 1 Page 2 Page 3 Next page→
  • Privacy Notice
  • Terms of Use
  • Forward-Looking Statements
Apollo
© Apollo Global Management, Inc. All Rights Reserved.

The Apollo Academy is for informational and educational purposes only and nothing contained herein should be taken as investment advice or a recommendation to enter into any transaction. They are not an invitation by or on behalf of Apollo to any person to buy or sell any security or to adopt any investment strategy, and shall not form the basis of, nor may it accompany nor form part of, any right or contract to buy or sell any security or to adopt any investment strategy. There is no guarantee that the views and opinions expressed in this website will come to pass. For additional information, please see the disclaimers included in each piece of content or the legal page of our website here.