• Apollo.com
  • Login
  • Register Now
light site-logo
  • The Academy
  • Upcoming Events
        • Upcoming Events

        • 2026 OutlookTuesday, December 16, 2025 • 11:00am ET
  • Learning Center
        • New & UpdatedAlternative Investing Course 2.0

        • Alternative Investing Essentials Part OnePrivate Equity, Venture Capital, Private Credit
        • Alternative Investing Essentials Part TwoReal Estate, Infrastructure, Digital Assets, Hedge Funds
        • Practical ConsiderationsAsset Allocation, Risk Considerations, Fund Structures, Fees
        • Introductory Videos

          View All Videos

        •  Recent Classes & Videos

        • • Private Equity’s Edge: Delivering Alpha in a Changing Market
        • • Powering Innovation: Infrastructure Investing Across the AI Value Chain
        • • Mid-Year Outlook: At the Crossroads of Stagflation — What’s Next?
        • • Hybrid Investments: Flexible Structures for Volatile Times
        • • Private Credit Investing in Volatile Times
        • • Potential Implications of the Latest US Administration Policy Proposals
        • View All Classes

  • Alternative Perspectives
        • Investment Knowledge
        • The View from Apollo
          • Investment Knowledge

            Hybrid in Action: Delivering Bespoke Capital Solutions in a New Market Paradigm

            December 4, 2025
          • The View From Apollo

            Private Equity: Alpha in an Evolving Market

            November 24, 2025
          • Apollo Answers Investment Knowledge

            Apollo Answers: What’s Missing in Private Credit? Integrating Asset-Backed Finance

            October 27, 2025
  • The Daily Spark
        • Read The Daily Spark Blog


        • Want it delivered daily to your inbox?
          • The Daily Spark

            The US Retirement Crisis

            December 12, 2025
          • The Daily Spark

            Expected Returns in Public Equities Over the Coming Years

            December 11, 2025
          • The Daily Spark

            A Mystery in Fixed Income

            December 10, 2025
  • Register for Apollo Academy: Alternative Investing Course
  • Login
  • About Apollo Academy
  • Upcoming Events
  • Learning Center
  • Alternative Perspectives
  • The Daily Spark
  • Register for Apollo Academy: Alternative Investing Course
  • Login
  • 2026 Outlook
  • Alternative Investing Course 2.0
  • Private Equity’s Edge: Delivering Alpha in a Changing Market
  • Powering Innovation: Infrastructure Investing Across the AI Value Chain
  • Mid-Year Outlook: At the Crossroads of Stagflation — What’s Next?
  • Hybrid Investments: Flexible Structures for Volatile Times
  • Private Credit Investing in Volatile Times
  • Potential Implications of the Latest US Administration Policy Proposals
  • View All Classes
  • Introductory Videos
  • Alternative Investing Essentials Part One • Now Available On Demand
  • Alternative Investing Essentials Part Two • Now Available On Demand
  • Practical Considerations • Now Available On Demand
  • Investment Knowledge
  • The View from Apollo
Home August 2023

Higher Cost of Capital Continues

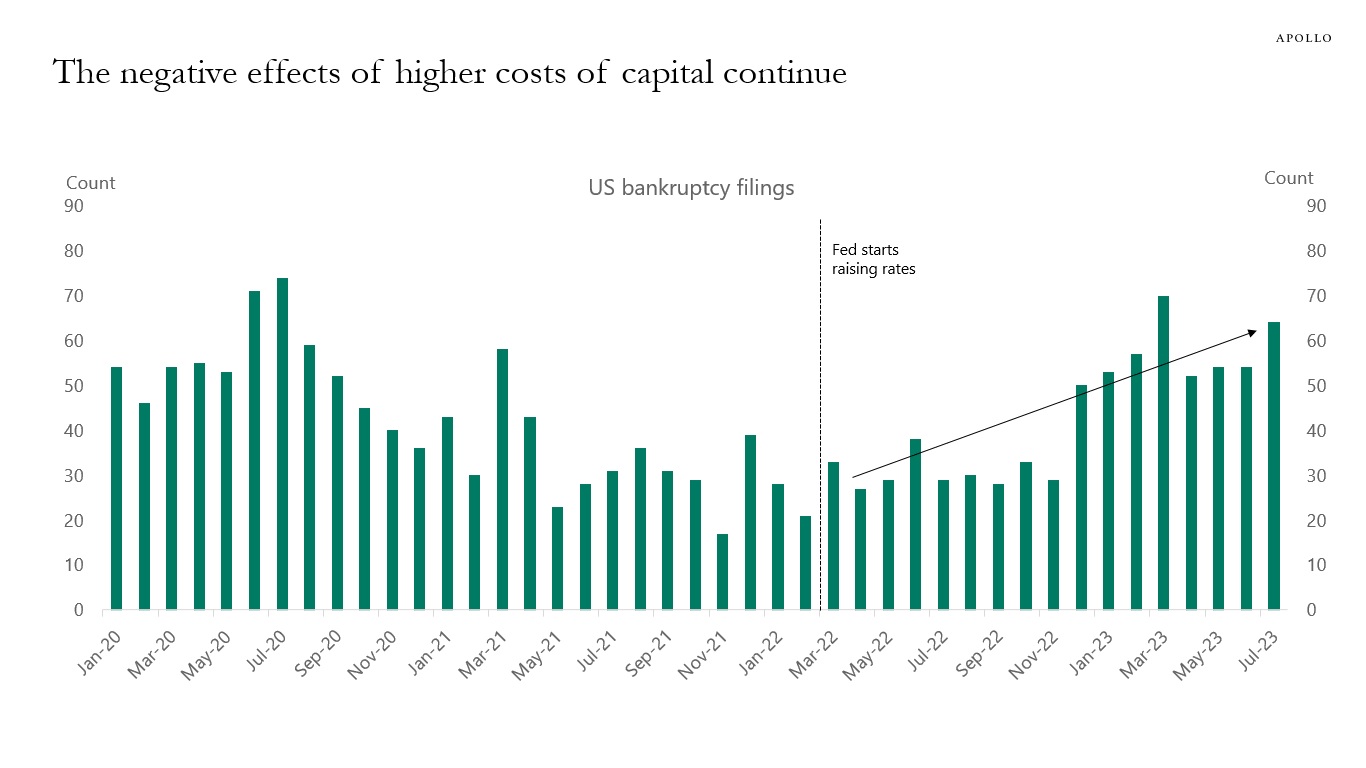
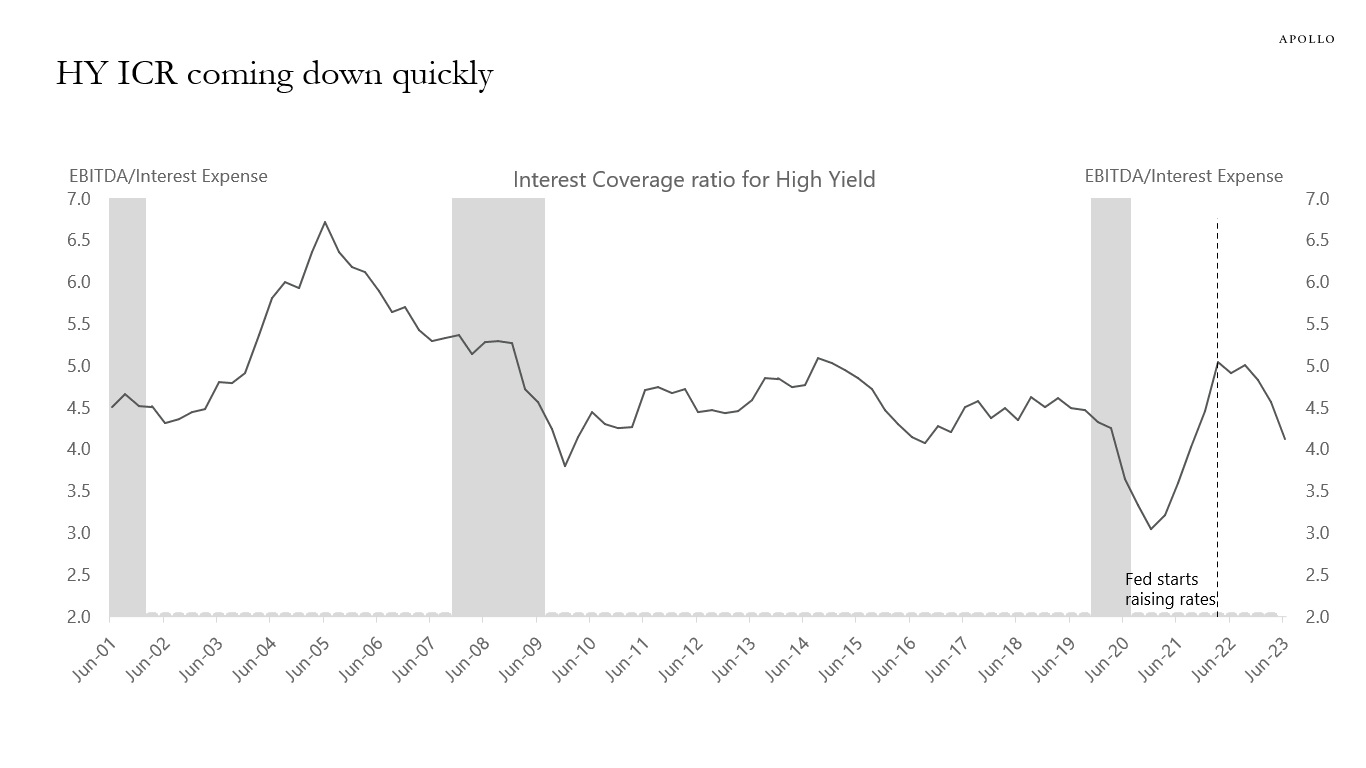
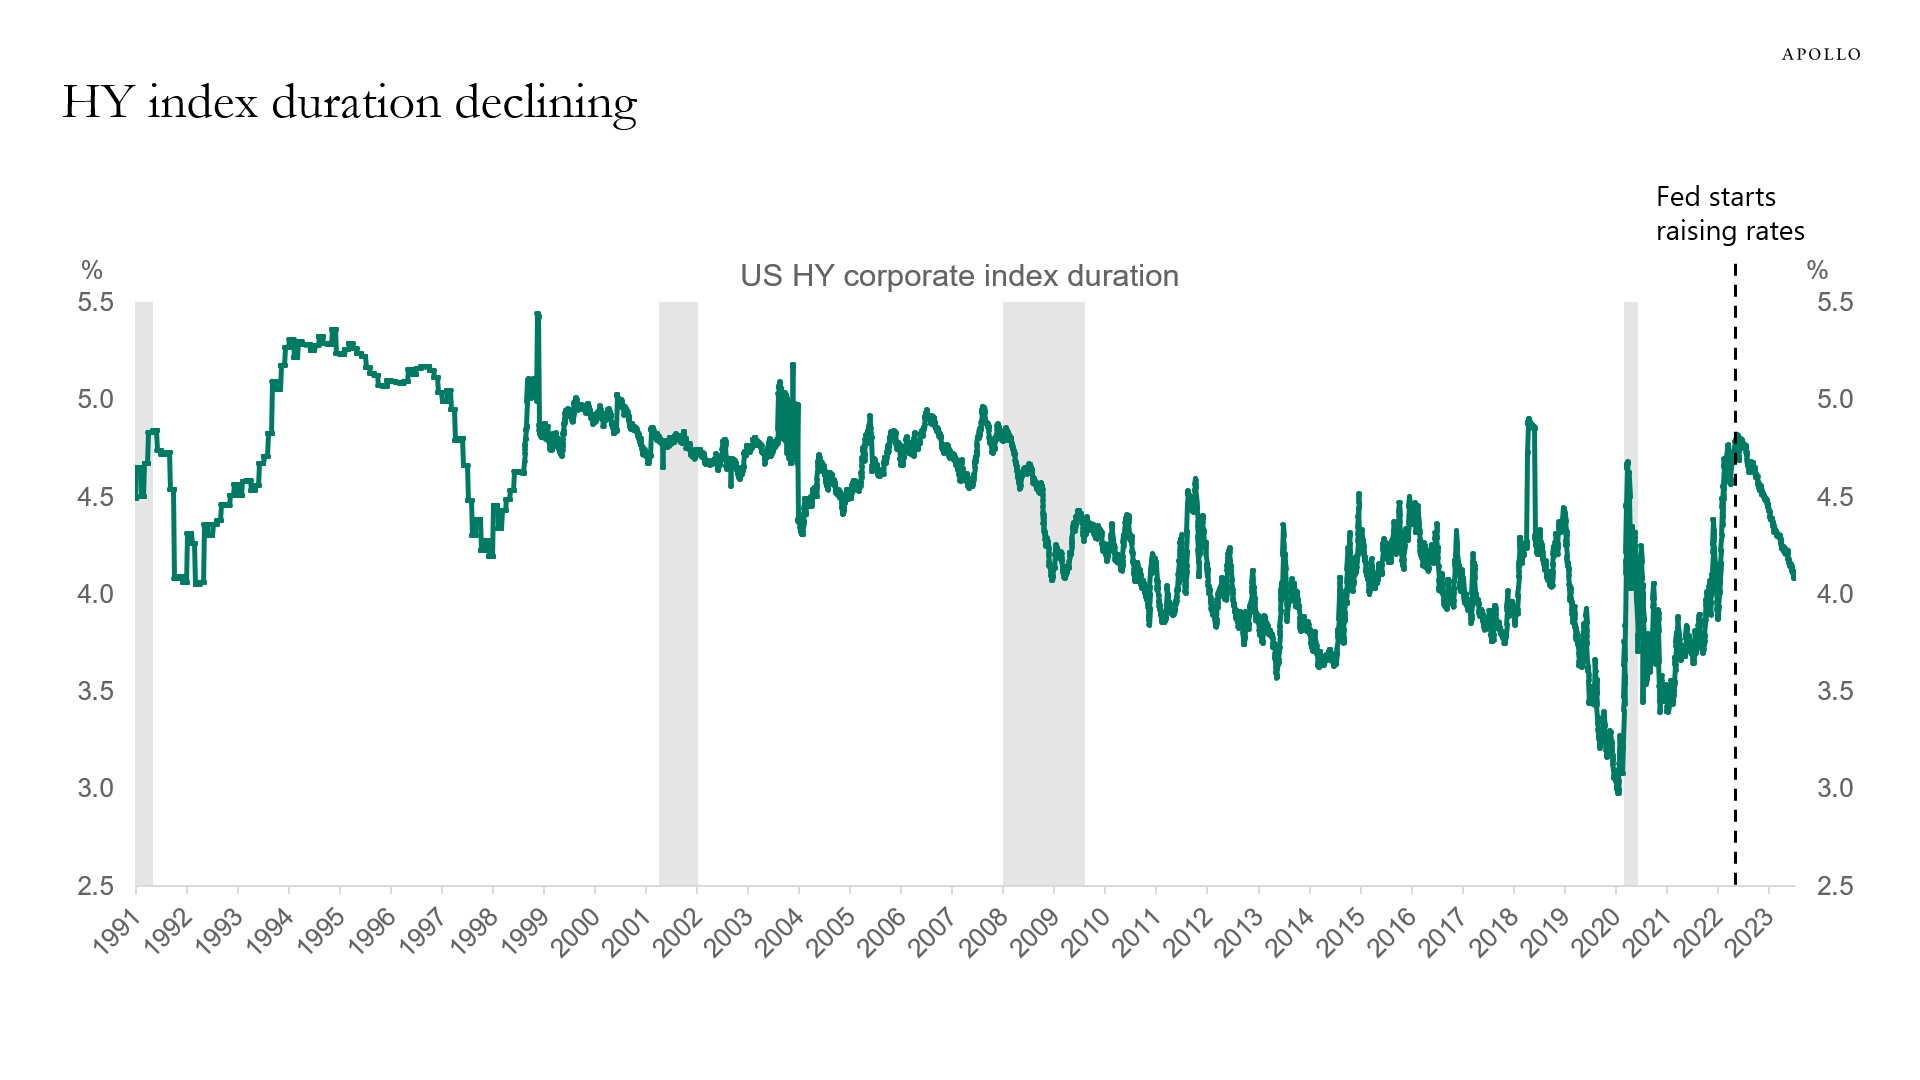
The Fed started raising rates in March 2022, and the effects are clear. Higher costs of capital have pushed more and more companies into bankruptcy. This is the idea behind raising rates: to slow the economy down with the ultimate goal of getting inflation back to 2%. Every day there are companies that cannot get new loans or refinance, and this trend higher in bankruptcies will continue as long as interest rates stay high.

The negative effects of higher costs of capital continue
Source: S&P Capital IQ, Bloomberg, Apollo Chief Economist. Note: Bankruptcy figures include public companies or private companies with public debt with a minimum of $2 million in assets or liabilities at the time of filing, in addition to private companies with at least $10 million in assets or liabilities.

Recent Posts

  • The US Retirement Crisis
  • Expected Returns in Public Equities Over the Coming Years
  • A Mystery in Fixed Income
  • More $1 Billion+ Deals in Private Markets
  • 40% of Small-Cap Companies Have No Earnings

Recent Comments

No comments to show.

Archives

  • December 2025
  • November 2025
  • October 2025
  • September 2025
  • August 2025
  • July 2025
  • June 2025
  • May 2025
  • April 2025
  • March 2025
  • February 2025
  • January 2025
  • December 2024
  • November 2024
  • October 2024
  • September 2024
  • August 2024
  • July 2024
  • June 2024
  • May 2024
  • April 2024
  • March 2024
  • February 2024
  • January 2024
  • December 2023
  • November 2023
  • October 2023
  • September 2023
  • August 2023
  • July 2023
  • June 2023
  • May 2023
  • April 2023
  • March 2023
  • February 2023
  • January 2023
  • December 2022
  • November 2022
  • October 2022
  • September 2022
  • August 2022
  • July 2022
  • June 2022
  • May 2022
  • April 2022
  • March 2022
  • February 2022
  • January 2022
  • December 2021
  • November 2021

Categories

  • Apollo Answers
  • Course Introductions
  • Economic Intelligence
  • Hide from Wordpress Search
  • Investment Knowledge
  • Perspectives
  • Redirecting
  • The Daily Spark
  • The View from Apollo
  • The Weekly Brief
  • Uncategorized
  • White Papers
Weekly Brief Summer Break

Weekly Brief Returns After Labor Day 

Weekly Brief Summer Break

The Weekly Brief with our Chief Economist Torsten Slok is taking a summer break during the month of August. We will be back with our original programming after Labor Day on September 11, 2023. For daily economic commentary in the meantime, read the Daily Spark blog.

Recent Posts

  • The US Retirement Crisis
  • Expected Returns in Public Equities Over the Coming Years
  • A Mystery in Fixed Income
  • More $1 Billion+ Deals in Private Markets
  • 40% of Small-Cap Companies Have No Earnings

Recent Comments

No comments to show.

Archives

  • December 2025
  • November 2025
  • October 2025
  • September 2025
  • August 2025
  • July 2025
  • June 2025
  • May 2025
  • April 2025
  • March 2025
  • February 2025
  • January 2025
  • December 2024
  • November 2024
  • October 2024
  • September 2024
  • August 2024
  • July 2024
  • June 2024
  • May 2024
  • April 2024
  • March 2024
  • February 2024
  • January 2024
  • December 2023
  • November 2023
  • October 2023
  • September 2023
  • August 2023
  • July 2023
  • June 2023
  • May 2023
  • April 2023
  • March 2023
  • February 2023
  • January 2023
  • December 2022
  • November 2022
  • October 2022
  • September 2022
  • August 2022
  • July 2022
  • June 2022
  • May 2022
  • April 2022
  • March 2022
  • February 2022
  • January 2022
  • December 2021
  • November 2021

Categories

  • Apollo Answers
  • Course Introductions
  • Economic Intelligence
  • Hide from Wordpress Search
  • Investment Knowledge
  • Perspectives
  • Redirecting
  • The Daily Spark
  • The View from Apollo
  • The Weekly Brief
  • Uncategorized
  • White Papers

Outlook for 10s

Arguments for US long rates moving higher are QT, the large government budget deficit, BoJ YCC exit, and the significant amount of T-bills outstanding, which need to be rolled into longer-dated Treasury bonds and notes, see chart below.

Arguments for US long rates moving lower are peaking inflation, slowing growth, and the Fed being done with raising rates.

Rising amount of T-bills outstanding
Source: US Treasury, Haver, Apollo Chief Economist

Recent Posts

  • The US Retirement Crisis
  • Expected Returns in Public Equities Over the Coming Years
  • A Mystery in Fixed Income
  • More $1 Billion+ Deals in Private Markets
  • 40% of Small-Cap Companies Have No Earnings

Recent Comments

No comments to show.

Archives

  • December 2025
  • November 2025
  • October 2025
  • September 2025
  • August 2025
  • July 2025
  • June 2025
  • May 2025
  • April 2025
  • March 2025
  • February 2025
  • January 2025
  • December 2024
  • November 2024
  • October 2024
  • September 2024
  • August 2024
  • July 2024
  • June 2024
  • May 2024
  • April 2024
  • March 2024
  • February 2024
  • January 2024
  • December 2023
  • November 2023
  • October 2023
  • September 2023
  • August 2023
  • July 2023
  • June 2023
  • May 2023
  • April 2023
  • March 2023
  • February 2023
  • January 2023
  • December 2022
  • November 2022
  • October 2022
  • September 2022
  • August 2022
  • July 2022
  • June 2022
  • May 2022
  • April 2022
  • March 2022
  • February 2022
  • January 2022
  • December 2021
  • November 2021

Categories

  • Apollo Answers
  • Course Introductions
  • Economic Intelligence
  • Hide from Wordpress Search
  • Investment Knowledge
  • Perspectives
  • Redirecting
  • The Daily Spark
  • The View from Apollo
  • The Weekly Brief
  • Uncategorized
  • White Papers

HY Spread Disconnected From Fundamentals

Fed hikes had an immediate negative effect on the manufacturing sector because the goods sector is more sensitive to interest rates.

With interest rates remaining high and consumers running out of excess savings, the next shoe to drop in 2023H2 is the service sector.

The divergence between manufacturing and services is likely why high yield spreads have not yet widened the way they usually do, see chart below.

The high yield spread seems disconnected from economic fundamentals
Source: ISM, ICE BofA, Haver Analytics, Apollo Chief Economist

Recent Posts

  • The US Retirement Crisis
  • Expected Returns in Public Equities Over the Coming Years
  • A Mystery in Fixed Income
  • More $1 Billion+ Deals in Private Markets
  • 40% of Small-Cap Companies Have No Earnings

Recent Comments

No comments to show.

Archives

  • December 2025
  • November 2025
  • October 2025
  • September 2025
  • August 2025
  • July 2025
  • June 2025
  • May 2025
  • April 2025
  • March 2025
  • February 2025
  • January 2025
  • December 2024
  • November 2024
  • October 2024
  • September 2024
  • August 2024
  • July 2024
  • June 2024
  • May 2024
  • April 2024
  • March 2024
  • February 2024
  • January 2024
  • December 2023
  • November 2023
  • October 2023
  • September 2023
  • August 2023
  • July 2023
  • June 2023
  • May 2023
  • April 2023
  • March 2023
  • February 2023
  • January 2023
  • December 2022
  • November 2022
  • October 2022
  • September 2022
  • August 2022
  • July 2022
  • June 2022
  • May 2022
  • April 2022
  • March 2022
  • February 2022
  • January 2022
  • December 2021
  • November 2021

Categories

  • Apollo Answers
  • Course Introductions
  • Economic Intelligence
  • Hide from Wordpress Search
  • Investment Knowledge
  • Perspectives
  • Redirecting
  • The Daily Spark
  • The View from Apollo
  • The Weekly Brief
  • Uncategorized
  • White Papers

Outlook for Credit

Since the Fed started raising rates, credit fundamentals have continued to deteriorate. The higher cost of capital is putting significant downward pressure on interest coverage ratios across IG, HY, and loans. Cash flow coverage is declining, and leverage is rising, see charts below.

The pressure on corporate balance sheets is the direct result of the Fed keeping the costs of capital at high levels, and with rates staying high for a couple of years, the ongoing deterioration in credit fundamentals will continue to have a negative impact on employment growth and capex spending, and ultimately GDP.

Our credit market outlook is available here.

IG ICR coming down quickly
Source: Bloomberg, Apollo Chief Economist
HY ICR coming down quickly
Source: Bloomberg, Apollo Chief Economist
Credit metrics for leveraged loan deals: ICR and cash flow down. Leverage up.
Source: Pitchbook LCD, Apollo Chief Economist

Recent Posts

  • The US Retirement Crisis
  • Expected Returns in Public Equities Over the Coming Years
  • A Mystery in Fixed Income
  • More $1 Billion+ Deals in Private Markets
  • 40% of Small-Cap Companies Have No Earnings

Recent Comments

No comments to show.

Archives

  • December 2025
  • November 2025
  • October 2025
  • September 2025
  • August 2025
  • July 2025
  • June 2025
  • May 2025
  • April 2025
  • March 2025
  • February 2025
  • January 2025
  • December 2024
  • November 2024
  • October 2024
  • September 2024
  • August 2024
  • July 2024
  • June 2024
  • May 2024
  • April 2024
  • March 2024
  • February 2024
  • January 2024
  • December 2023
  • November 2023
  • October 2023
  • September 2023
  • August 2023
  • July 2023
  • June 2023
  • May 2023
  • April 2023
  • March 2023
  • February 2023
  • January 2023
  • December 2022
  • November 2022
  • October 2022
  • September 2022
  • August 2022
  • July 2022
  • June 2022
  • May 2022
  • April 2022
  • March 2022
  • February 2022
  • January 2022
  • December 2021
  • November 2021

Categories

  • Apollo Answers
  • Course Introductions
  • Economic Intelligence
  • Hide from Wordpress Search
  • Investment Knowledge
  • Perspectives
  • Redirecting
  • The Daily Spark
  • The View from Apollo
  • The Weekly Brief
  • Uncategorized
  • White Papers

$9 Trillion in Corporate Bonds Outstanding

The total market cap of US corporate bond markets is now at $9 trillion. BBB market cap is currently at $3.7 trillion, and single-A is at $3.4 trillion, see chart below.

Total market cap of US corporate bond markets: $9 trillion
Source: ICE BofA, Bloomberg, Apollo Chief Economist

Recent Posts

  • The US Retirement Crisis
  • Expected Returns in Public Equities Over the Coming Years
  • A Mystery in Fixed Income
  • More $1 Billion+ Deals in Private Markets
  • 40% of Small-Cap Companies Have No Earnings

Recent Comments

No comments to show.

Archives

  • December 2025
  • November 2025
  • October 2025
  • September 2025
  • August 2025
  • July 2025
  • June 2025
  • May 2025
  • April 2025
  • March 2025
  • February 2025
  • January 2025
  • December 2024
  • November 2024
  • October 2024
  • September 2024
  • August 2024
  • July 2024
  • June 2024
  • May 2024
  • April 2024
  • March 2024
  • February 2024
  • January 2024
  • December 2023
  • November 2023
  • October 2023
  • September 2023
  • August 2023
  • July 2023
  • June 2023
  • May 2023
  • April 2023
  • March 2023
  • February 2023
  • January 2023
  • December 2022
  • November 2022
  • October 2022
  • September 2022
  • August 2022
  • July 2022
  • June 2022
  • May 2022
  • April 2022
  • March 2022
  • February 2022
  • January 2022
  • December 2021
  • November 2021

Categories

  • Apollo Answers
  • Course Introductions
  • Economic Intelligence
  • Hide from Wordpress Search
  • Investment Knowledge
  • Perspectives
  • Redirecting
  • The Daily Spark
  • The View from Apollo
  • The Weekly Brief
  • Uncategorized
  • White Papers

IG and HY Weights in US and EU

Financials have a weight of almost 50% in the European IG index and 33% in the US IG index, see chart below. For the high yield index, financials also have a higher weight in Europe than in the US. For the US, the sectors with the biggest weight in the HY index are consumer discretionary, communications, and energy.

Comparing the US IG index with the EU IG index
Source: Bloomberg Barclays, Bloomberg, Apollo Chief Economist
Comparing the US HY index with the EU HY index
Source: Bloomberg Barclays, Bloomberg, Apollo Chief Economist

Recent Posts

  • The US Retirement Crisis
  • Expected Returns in Public Equities Over the Coming Years
  • A Mystery in Fixed Income
  • More $1 Billion+ Deals in Private Markets
  • 40% of Small-Cap Companies Have No Earnings

Recent Comments

No comments to show.

Archives

  • December 2025
  • November 2025
  • October 2025
  • September 2025
  • August 2025
  • July 2025
  • June 2025
  • May 2025
  • April 2025
  • March 2025
  • February 2025
  • January 2025
  • December 2024
  • November 2024
  • October 2024
  • September 2024
  • August 2024
  • July 2024
  • June 2024
  • May 2024
  • April 2024
  • March 2024
  • February 2024
  • January 2024
  • December 2023
  • November 2023
  • October 2023
  • September 2023
  • August 2023
  • July 2023
  • June 2023
  • May 2023
  • April 2023
  • March 2023
  • February 2023
  • January 2023
  • December 2022
  • November 2022
  • October 2022
  • September 2022
  • August 2022
  • July 2022
  • June 2022
  • May 2022
  • April 2022
  • March 2022
  • February 2022
  • January 2022
  • December 2021
  • November 2021

Categories

  • Apollo Answers
  • Course Introductions
  • Economic Intelligence
  • Hide from Wordpress Search
  • Investment Knowledge
  • Perspectives
  • Redirecting
  • The Daily Spark
  • The View from Apollo
  • The Weekly Brief
  • Uncategorized
  • White Papers

IG Trading Below Par

Ninety-one percent of US investment grade bonds are trading below par, see chart below.

Source: Bloomberg, Apollo Chief Economist. Note: Data used for members in the LBUSTRUU Index.

Recent Posts

  • The US Retirement Crisis
  • Expected Returns in Public Equities Over the Coming Years
  • A Mystery in Fixed Income
  • More $1 Billion+ Deals in Private Markets
  • 40% of Small-Cap Companies Have No Earnings

Recent Comments

No comments to show.

Archives

  • December 2025
  • November 2025
  • October 2025
  • September 2025
  • August 2025
  • July 2025
  • June 2025
  • May 2025
  • April 2025
  • March 2025
  • February 2025
  • January 2025
  • December 2024
  • November 2024
  • October 2024
  • September 2024
  • August 2024
  • July 2024
  • June 2024
  • May 2024
  • April 2024
  • March 2024
  • February 2024
  • January 2024
  • December 2023
  • November 2023
  • October 2023
  • September 2023
  • August 2023
  • July 2023
  • June 2023
  • May 2023
  • April 2023
  • March 2023
  • February 2023
  • January 2023
  • December 2022
  • November 2022
  • October 2022
  • September 2022
  • August 2022
  • July 2022
  • June 2022
  • May 2022
  • April 2022
  • March 2022
  • February 2022
  • January 2022
  • December 2021
  • November 2021

Categories

  • Apollo Answers
  • Course Introductions
  • Economic Intelligence
  • Hide from Wordpress Search
  • Investment Knowledge
  • Perspectives
  • Redirecting
  • The Daily Spark
  • The View from Apollo
  • The Weekly Brief
  • Uncategorized
  • White Papers

Duration Declining for Credit

Modified duration measures the expected change in a bond’s price to a 1% change in interest rates. The charts below show that since the Fed started raising rates, index duration has declined both for high yield and investment grade, with high yield duration currently standing at 4% and investment grade duration at 7.5%.

Source: Bloomberg, Apollo Chief Economist. Note: The measure used is modified duration, which measures the expected change in a bond’s price to a 1% change in interest rates.

Recent Posts

  • The US Retirement Crisis
  • Expected Returns in Public Equities Over the Coming Years
  • A Mystery in Fixed Income
  • More $1 Billion+ Deals in Private Markets
  • 40% of Small-Cap Companies Have No Earnings

Recent Comments

No comments to show.

Archives

  • December 2025
  • November 2025
  • October 2025
  • September 2025
  • August 2025
  • July 2025
  • June 2025
  • May 2025
  • April 2025
  • March 2025
  • February 2025
  • January 2025
  • December 2024
  • November 2024
  • October 2024
  • September 2024
  • August 2024
  • July 2024
  • June 2024
  • May 2024
  • April 2024
  • March 2024
  • February 2024
  • January 2024
  • December 2023
  • November 2023
  • October 2023
  • September 2023
  • August 2023
  • July 2023
  • June 2023
  • May 2023
  • April 2023
  • March 2023
  • February 2023
  • January 2023
  • December 2022
  • November 2022
  • October 2022
  • September 2022
  • August 2022
  • July 2022
  • June 2022
  • May 2022
  • April 2022
  • March 2022
  • February 2022
  • January 2022
  • December 2021
  • November 2021

Categories

  • Apollo Answers
  • Course Introductions
  • Economic Intelligence
  • Hide from Wordpress Search
  • Investment Knowledge
  • Perspectives
  • Redirecting
  • The Daily Spark
  • The View from Apollo
  • The Weekly Brief
  • Uncategorized
  • White Papers

The Share of High Yield Trading Above 10%

Twenty percent of the high yield index trades with yields higher than 10%, see chart below.

20% of the bonds in the high yield index have yields above 10%
Source: Bloomberg, Apollo Chief Economist. Note: HY bond universe is H0A0 Index.

Recent Posts

  • The US Retirement Crisis
  • Expected Returns in Public Equities Over the Coming Years
  • A Mystery in Fixed Income
  • More $1 Billion+ Deals in Private Markets
  • 40% of Small-Cap Companies Have No Earnings

Recent Comments

No comments to show.

Archives

  • December 2025
  • November 2025
  • October 2025
  • September 2025
  • August 2025
  • July 2025
  • June 2025
  • May 2025
  • April 2025
  • March 2025
  • February 2025
  • January 2025
  • December 2024
  • November 2024
  • October 2024
  • September 2024
  • August 2024
  • July 2024
  • June 2024
  • May 2024
  • April 2024
  • March 2024
  • February 2024
  • January 2024
  • December 2023
  • November 2023
  • October 2023
  • September 2023
  • August 2023
  • July 2023
  • June 2023
  • May 2023
  • April 2023
  • March 2023
  • February 2023
  • January 2023
  • December 2022
  • November 2022
  • October 2022
  • September 2022
  • August 2022
  • July 2022
  • June 2022
  • May 2022
  • April 2022
  • March 2022
  • February 2022
  • January 2022
  • December 2021
  • November 2021

Categories

  • Apollo Answers
  • Course Introductions
  • Economic Intelligence
  • Hide from Wordpress Search
  • Investment Knowledge
  • Perspectives
  • Redirecting
  • The Daily Spark
  • The View from Apollo
  • The Weekly Brief
  • Uncategorized
  • White Papers

Posts navigation

←Previous page Page 1 Page 2 Page 3 Page 4 Next page→
  • Privacy Notice
  • Terms of Use
  • Forward-Looking Statements
Apollo
© Apollo Global Management, Inc. All Rights Reserved.

The Apollo Academy is for informational and educational purposes only and nothing contained herein should be taken as investment advice or a recommendation to enter into any transaction. They are not an invitation by or on behalf of Apollo to any person to buy or sell any security or to adopt any investment strategy, and shall not form the basis of, nor may it accompany nor form part of, any right or contract to buy or sell any security or to adopt any investment strategy. There is no guarantee that the views and opinions expressed in this website will come to pass. For additional information, please see the disclaimers included in each piece of content or the legal page of our website here.