• Apollo.com
  • Login
  • Register Now
light site-logo
  • The Academy
  • Upcoming Events
        • Upcoming Events

  • Learning Center
        • New & UpdatedAlternative Investing Course 2.0

        • Alternative Investing Essentials Part OnePrivate Equity, Venture Capital, Private Credit
        • Alternative Investing Essentials Part TwoReal Estate, Infrastructure, Digital Assets, Hedge Funds
        • Practical ConsiderationsAsset Allocation, Risk Considerations, Fund Structures, Fees
        • Introductory Videos

          View All Videos

        •  Recent Classes & Videos

        • • 2026 Outlook
        • • Private Equity’s Edge: Delivering Alpha in a Changing Market
        • • Powering Innovation: Infrastructure Investing Across the AI Value Chain
        • • Mid-Year Outlook: At the Crossroads of Stagflation — What’s Next?
        • • Hybrid Investments: Flexible Structures for Volatile Times
        • • Private Credit Investing in Volatile Times
        • View All Classes

  • Alternative Perspectives
        • Investment Knowledge
        • The View from Apollo
          • Investment Knowledge White Papers

            After 60/40: In Private Markets, Manager Selection Matters

            February 27, 2026
          • The View From Apollo

            Allocation Insights: Asset-Backed Finance Is the Engine Behind Private Credit’s Next Chapter

            February 17, 2026
          • Investment Knowledge White Papers

            Private Equity Returns to Its Roots

            January 29, 2026
  • The Daily Spark
        • Read The Daily Spark Blog


        • Want it delivered daily to your inbox?
          • The Daily Spark

            Strong Net Foreign Buying of US Assets

            March 2, 2026
          • The Daily Spark

            Average Tenure of Companies in the S&P 500 Index: 15 Years

            March 1, 2026
          • The Daily Spark

            Fed Pricing Reveals Market Expectations About the AI Adoption Pace

            February 28, 2026
  • Register for Apollo Academy: Alternative Investing Course
  • Login
  • About Apollo Academy
  • Upcoming Events
  • Learning Center
  • Alternative Perspectives
  • The Daily Spark
  • Register for Apollo Academy: Alternative Investing Course
  • Login
  • Alternative Investing Course 2.0
  • 2026 Outlook
  • Private Equity’s Edge: Delivering Alpha in a Changing Market
  • Powering Innovation: Infrastructure Investing Across the AI Value Chain
  • Mid-Year Outlook: At the Crossroads of Stagflation — What’s Next?
  • Hybrid Investments: Flexible Structures for Volatile Times
  • Private Credit Investing in Volatile Times
  • View All Classes
  • Introductory Videos
  • Alternative Investing Essentials Part One • Now Available On Demand
  • Alternative Investing Essentials Part Two • Now Available On Demand
  • Practical Considerations • Now Available On Demand
  • Investment Knowledge
  • The View from Apollo
Home April 2025

Why Are US Long-Term Interest Rates Moving Higher?

The textbook would be saying that when the stock market is going down, long-term interest rates should also be going down.

But this is not what is happening at the moment, see chart below.

What could be the reasons why long-term interest rates are moving higher when the stock market is moving lower?

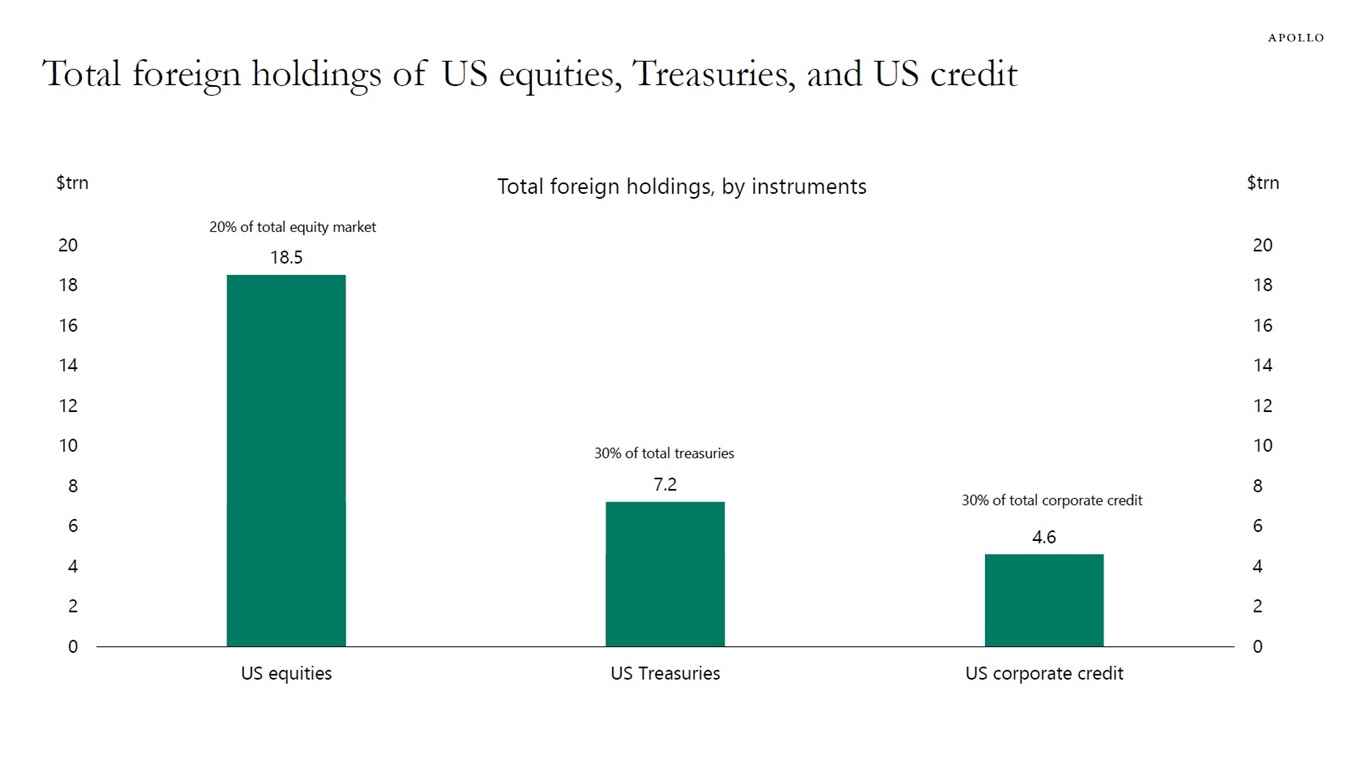
1) With the yen, euro, and Canadian dollar strengthening at the same time, this could be foreigners selling US Treasuries.

2) With the VIX at elevated levels around 50, there is a lot of hedging activity going on, and it could, therefore, be risk reduction among large asset managers managing rates, credit, and equities.

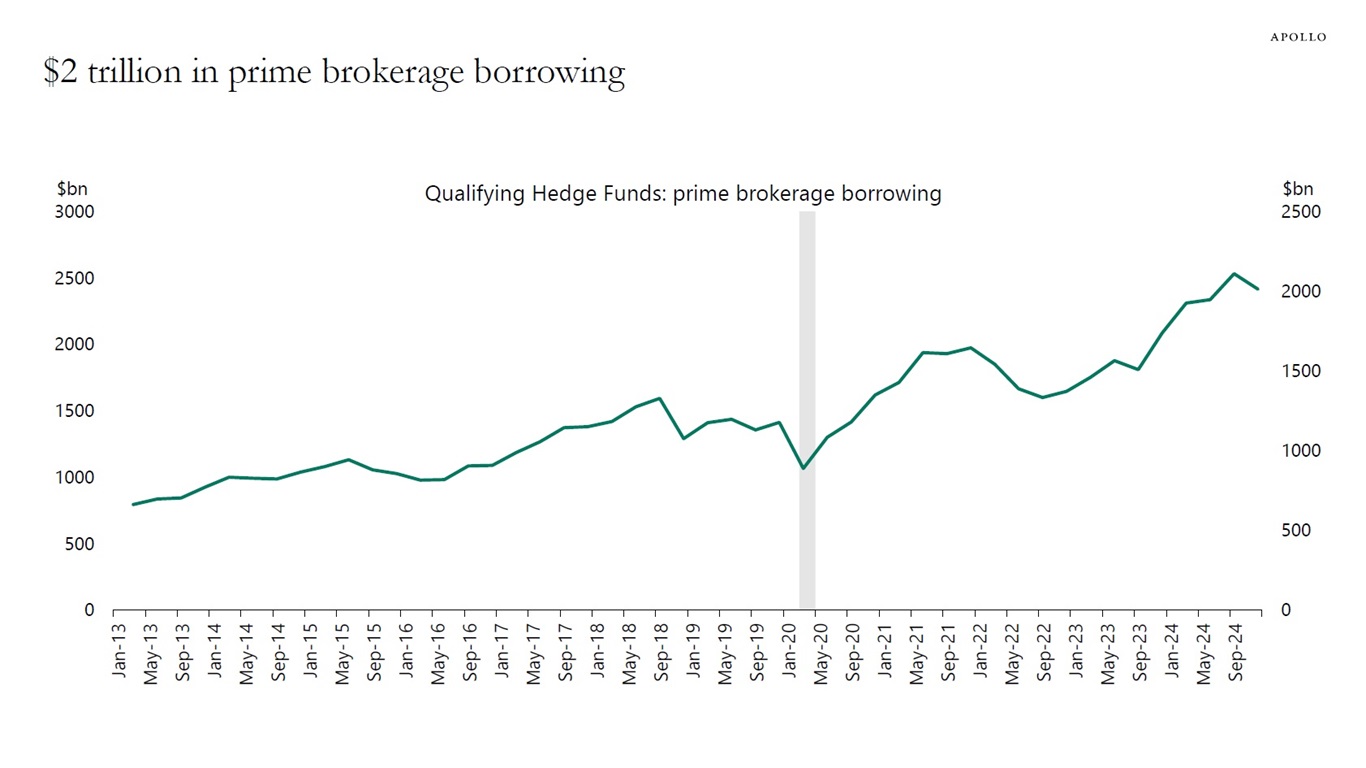
3) With almost $1 trillion in the basis trade, it could be an unwinding of the basis trade among levered hedge funds.

The answer is likely some combination of these three forces.

Very unusual moves in long rates at the moment
Note: Data starts from January 2020. Sources: Bloomberg, Apollo Chief Economist

Download high-res chart

Recent Posts

  • Strong Net Foreign Buying of US Assets
  • Average Tenure of Companies in the S&P 500 Index: 15 Years
  • Fed Pricing Reveals Market Expectations About the AI Adoption Pace
  • After 60/40: In Private Markets, Manager Selection Matters
  • Equity Market Trading Volumes Rising

Recent Comments

No comments to show.

Archives

  • March 2026
  • February 2026
  • January 2026
  • December 2025
  • November 2025
  • October 2025
  • September 2025
  • August 2025
  • July 2025
  • June 2025
  • May 2025
  • April 2025
  • March 2025
  • February 2025
  • January 2025
  • December 2024
  • November 2024
  • October 2024
  • September 2024
  • August 2024
  • July 2024
  • June 2024
  • May 2024
  • April 2024
  • March 2024
  • February 2024
  • January 2024
  • December 2023
  • November 2023
  • October 2023
  • September 2023
  • August 2023
  • July 2023
  • June 2023
  • May 2023
  • April 2023
  • March 2023
  • February 2023
  • January 2023
  • December 2022
  • November 2022
  • October 2022
  • September 2022
  • August 2022
  • July 2022
  • June 2022
  • May 2022
  • April 2022
  • March 2022
  • February 2022
  • January 2022
  • December 2021
  • November 2021

Categories

  • Apollo Answers
  • Course Introductions
  • Economic Intelligence
  • Hide from Wordpress Search
  • Investment Knowledge
  • Perspectives
  • Redirecting
  • The Daily Spark
  • The View from Apollo
  • The Weekly Brief
  • Uncategorized
  • White Papers

Foreign Ownership of US Equities, Treasuries, and US Credit

Foreigners own $19 trillion in US equities, $7 trillion in Treasuries, and $5 trillion in US credit, see chart below.

That corresponds to 20% of US equities, 30% of Treasuries, and 30% of credit outstanding.

Total foreign holdings of US equities, Treasuries, and US credit
Sources: Federal Reserve, MacroBond, Apollo Chief Economist

Download high-res chart

Recent Posts

  • Strong Net Foreign Buying of US Assets
  • Average Tenure of Companies in the S&P 500 Index: 15 Years
  • Fed Pricing Reveals Market Expectations About the AI Adoption Pace
  • After 60/40: In Private Markets, Manager Selection Matters
  • Equity Market Trading Volumes Rising

Recent Comments

No comments to show.

Archives

  • March 2026
  • February 2026
  • January 2026
  • December 2025
  • November 2025
  • October 2025
  • September 2025
  • August 2025
  • July 2025
  • June 2025
  • May 2025
  • April 2025
  • March 2025
  • February 2025
  • January 2025
  • December 2024
  • November 2024
  • October 2024
  • September 2024
  • August 2024
  • July 2024
  • June 2024
  • May 2024
  • April 2024
  • March 2024
  • February 2024
  • January 2024
  • December 2023
  • November 2023
  • October 2023
  • September 2023
  • August 2023
  • July 2023
  • June 2023
  • May 2023
  • April 2023
  • March 2023
  • February 2023
  • January 2023
  • December 2022
  • November 2022
  • October 2022
  • September 2022
  • August 2022
  • July 2022
  • June 2022
  • May 2022
  • April 2022
  • March 2022
  • February 2022
  • January 2022
  • December 2021
  • November 2021

Categories

  • Apollo Answers
  • Course Introductions
  • Economic Intelligence
  • Hide from Wordpress Search
  • Investment Knowledge
  • Perspectives
  • Redirecting
  • The Daily Spark
  • The View from Apollo
  • The Weekly Brief
  • Uncategorized
  • White Papers

Now Comes the Negative Impact of Tariffs on Corporate Earnings

As tariffs are implemented, they will have negative consequences for corporate earnings over the coming months. Combined with uncertainty about retaliation, lower consumer sentiment, lower corporate sentiment, and the negative wealth effect of the $10 trillion decline in the stock market, we continue to worry about downside risks to markets and the economy.

We will be discussing these headwinds to growth and recent developments in Washington, DC and financial markets on a conference call today at 9:00 am EDT. You can register here, and the chart book we will be using is available here.

Conclusions
Source: Apollo Chief Economist

Download high-res chart book

Recent Posts

  • Strong Net Foreign Buying of US Assets
  • Average Tenure of Companies in the S&P 500 Index: 15 Years
  • Fed Pricing Reveals Market Expectations About the AI Adoption Pace
  • After 60/40: In Private Markets, Manager Selection Matters
  • Equity Market Trading Volumes Rising

Recent Comments

No comments to show.

Archives

  • March 2026
  • February 2026
  • January 2026
  • December 2025
  • November 2025
  • October 2025
  • September 2025
  • August 2025
  • July 2025
  • June 2025
  • May 2025
  • April 2025
  • March 2025
  • February 2025
  • January 2025
  • December 2024
  • November 2024
  • October 2024
  • September 2024
  • August 2024
  • July 2024
  • June 2024
  • May 2024
  • April 2024
  • March 2024
  • February 2024
  • January 2024
  • December 2023
  • November 2023
  • October 2023
  • September 2023
  • August 2023
  • July 2023
  • June 2023
  • May 2023
  • April 2023
  • March 2023
  • February 2023
  • January 2023
  • December 2022
  • November 2022
  • October 2022
  • September 2022
  • August 2022
  • July 2022
  • June 2022
  • May 2022
  • April 2022
  • March 2022
  • February 2022
  • January 2022
  • December 2021
  • November 2021

Categories

  • Apollo Answers
  • Course Introductions
  • Economic Intelligence
  • Hide from Wordpress Search
  • Investment Knowledge
  • Perspectives
  • Redirecting
  • The Daily Spark
  • The View from Apollo
  • The Weekly Brief
  • Uncategorized
  • White Papers

What Is the Basis Trade?

Something very unusual happened in financial markets yesterday. Long-term interest rates went up 20 basis points despite stocks going down. One potential reason for the move higher in rates is an unwind of the basis trade.

The basis is the difference in price between a Treasury security and a Treasury futures contract with similar characteristics.

The source of this price difference is demand and supply imbalances in Treasury markets, or arbitrage limitations for regulatory reasons.

In the basis trade, hedge funds put on leveraged bets, sometimes up to 100 times, with the goal of profiting from the convergence between the futures price and the bond price, as the futures contract approaches expiry.

How big is the basis trade? It is currently around $800 billion and an important part of the $2 trillion outstanding in prime brokerage balances. It will continue to expand as US government debt levels continue to grow, see charts below.

Why is this a problem? Because the cash-futures basis trade is a potential source of instability. In case of an exogenous shock, the highly leveraged long positions in cash Treasury securities by hedge funds are at risk of being rapidly unwound. Such an unwind would have to be absorbed, in the short run, by a broker-dealer that itself is capital-constrained. This could lead to a significant disruption in market functions of broker-dealer firms, such as providing liquidity to the secondary market for Treasuries and intermediating the market for repo borrowing and lending. For example, during Covid, the Fed was at the peak buying $100 billion in Treasuries every day.

In addition, if the supply of Treasuries grows further, for example, because of a growing budget deficit or the Fed doing quantitative tightening, it will potentially depress Treasury prices, hurting the long leg of the trade, and stress repo funding, as dealers have limited balance sheet capacity.

The bottom line is that the large and growing cash-futures basis trade, driven by leveraged hedge fund positions in Treasuries, poses a risk due to potential market disruptions and liquidity issues, especially in the event of an exogenous shock or increasing Treasury supply.

Net Treasury futures by investor type
Sources: Commodity Futures Trading Comm, Bloomberg, Apollo Chief Economist
$2 trillion in prime brokerage borrowing
Note: The data are aggregated responses to SEC Form PF question 43. Only responses from Qualifying Hedge Funds are included. Sources: Data for the US Office of Financial Research, Apollo Chief Economist

Download high-res charts

Recent Posts

  • Strong Net Foreign Buying of US Assets
  • Average Tenure of Companies in the S&P 500 Index: 15 Years
  • Fed Pricing Reveals Market Expectations About the AI Adoption Pace
  • After 60/40: In Private Markets, Manager Selection Matters
  • Equity Market Trading Volumes Rising

Recent Comments

No comments to show.

Archives

  • March 2026
  • February 2026
  • January 2026
  • December 2025
  • November 2025
  • October 2025
  • September 2025
  • August 2025
  • July 2025
  • June 2025
  • May 2025
  • April 2025
  • March 2025
  • February 2025
  • January 2025
  • December 2024
  • November 2024
  • October 2024
  • September 2024
  • August 2024
  • July 2024
  • June 2024
  • May 2024
  • April 2024
  • March 2024
  • February 2024
  • January 2024
  • December 2023
  • November 2023
  • October 2023
  • September 2023
  • August 2023
  • July 2023
  • June 2023
  • May 2023
  • April 2023
  • March 2023
  • February 2023
  • January 2023
  • December 2022
  • November 2022
  • October 2022
  • September 2022
  • August 2022
  • July 2022
  • June 2022
  • May 2022
  • April 2022
  • March 2022
  • February 2022
  • January 2022
  • December 2021
  • November 2021

Categories

  • Apollo Answers
  • Course Introductions
  • Economic Intelligence
  • Hide from Wordpress Search
  • Investment Knowledge
  • Perspectives
  • Redirecting
  • The Daily Spark
  • The View from Apollo
  • The Weekly Brief
  • Uncategorized
  • White Papers

Magnificent 7 Hit Harder by Global Slowdown and Potential Retaliation

Roughly 50% of earnings in the Magnificent 7 come from abroad, see chart below. That is higher than for the S&P 500, where the share is 41%.

With trade making up a bigger share of GDP in the rest of the world than in the US, the trade war will have a disproportionately more negative impact on the rest of the world.

As a result, the Magnificent 7 will be hit harder on their global earnings than other S&P 500 companies. Their earnings could be even more negatively impacted if Europe retaliates in the form of a digital services tax.

Magnificent 7: Revenues from abroad
Sources: Bloomberg, Apollo Chief Economist

Download high-res chart

Recent Posts

  • Strong Net Foreign Buying of US Assets
  • Average Tenure of Companies in the S&P 500 Index: 15 Years
  • Fed Pricing Reveals Market Expectations About the AI Adoption Pace
  • After 60/40: In Private Markets, Manager Selection Matters
  • Equity Market Trading Volumes Rising

Recent Comments

No comments to show.

Archives

  • March 2026
  • February 2026
  • January 2026
  • December 2025
  • November 2025
  • October 2025
  • September 2025
  • August 2025
  • July 2025
  • June 2025
  • May 2025
  • April 2025
  • March 2025
  • February 2025
  • January 2025
  • December 2024
  • November 2024
  • October 2024
  • September 2024
  • August 2024
  • July 2024
  • June 2024
  • May 2024
  • April 2024
  • March 2024
  • February 2024
  • January 2024
  • December 2023
  • November 2023
  • October 2023
  • September 2023
  • August 2023
  • July 2023
  • June 2023
  • May 2023
  • April 2023
  • March 2023
  • February 2023
  • January 2023
  • December 2022
  • November 2022
  • October 2022
  • September 2022
  • August 2022
  • July 2022
  • June 2022
  • May 2022
  • April 2022
  • March 2022
  • February 2022
  • January 2022
  • December 2021
  • November 2021

Categories

  • Apollo Answers
  • Course Introductions
  • Economic Intelligence
  • Hide from Wordpress Search
  • Investment Knowledge
  • Perspectives
  • Redirecting
  • The Daily Spark
  • The View from Apollo
  • The Weekly Brief
  • Uncategorized
  • White Papers

A Careful Look at the Incoming Hard Data

Our daily and weekly indicators for the US economy are available here, and the conclusion is that the hard data is still doing okay, but there are signs of weakness emerging.

Specifically:

– Las Vegas visitor volumes and total room nights occupied have started to decline, see the first two charts.

– Weekly bankruptcy filings are moving higher, see the third chart.

– Weekly data for movie theatre visits is weak, see the fourth chart.

– Daily data for job postings has been weaker in recent weeks, see the fifth chart.

– Daily TSA travel data is slightly weaker than at this time last year, see the sixth chart.

– Continuing claims are moving higher, see the seventh chart.

Las Vegas tourism declining
Sources: Bloomberg, Macrobond, Apollo Chief Economist
Las Vegas room nights occupied
Sources: Bloomberg, Macrobond, Apollo Chief Economist
Weekly bankruptcy filings
Note: Filings are for companies with more than $50mn in liabilities. For week ending on April 4, 2025. Sources: Bloomberg, Apollo Chief Economist
Weekly movie theatre visits
Sources: Boxofficemojo.com, Apollo Chief Economist
Daily jobs postings
Sources: Indeed, Bloomberg, Macrobond, Apollo Chief Economist
Daily data for US air travel
Sources: US Department of Homeland Security, Macrobond, Apollo Chief Economist
Weekly continuing jobless claims
Sources: US Department of Labor, Macrobond, Apollo Chief Economist

Download high-res chart book

Recent Posts

  • Strong Net Foreign Buying of US Assets
  • Average Tenure of Companies in the S&P 500 Index: 15 Years
  • Fed Pricing Reveals Market Expectations About the AI Adoption Pace
  • After 60/40: In Private Markets, Manager Selection Matters
  • Equity Market Trading Volumes Rising

Recent Comments

No comments to show.

Archives

  • March 2026
  • February 2026
  • January 2026
  • December 2025
  • November 2025
  • October 2025
  • September 2025
  • August 2025
  • July 2025
  • June 2025
  • May 2025
  • April 2025
  • March 2025
  • February 2025
  • January 2025
  • December 2024
  • November 2024
  • October 2024
  • September 2024
  • August 2024
  • July 2024
  • June 2024
  • May 2024
  • April 2024
  • March 2024
  • February 2024
  • January 2024
  • December 2023
  • November 2023
  • October 2023
  • September 2023
  • August 2023
  • July 2023
  • June 2023
  • May 2023
  • April 2023
  • March 2023
  • February 2023
  • January 2023
  • December 2022
  • November 2022
  • October 2022
  • September 2022
  • August 2022
  • July 2022
  • June 2022
  • May 2022
  • April 2022
  • March 2022
  • February 2022
  • January 2022
  • December 2021
  • November 2021

Categories

  • Apollo Answers
  • Course Introductions
  • Economic Intelligence
  • Hide from Wordpress Search
  • Investment Knowledge
  • Perspectives
  • Redirecting
  • The Daily Spark
  • The View from Apollo
  • The Weekly Brief
  • Uncategorized
  • White Papers

What Might Trump’s Liberation Day Mean to the US Economy and Financial Markets?

The chart book we used during our conference call yesterday is available here.

Downside risks to the economy intensifying
Source: Apollo Chief Economist

Download high-res chart book

Recent Posts

  • Strong Net Foreign Buying of US Assets
  • Average Tenure of Companies in the S&P 500 Index: 15 Years
  • Fed Pricing Reveals Market Expectations About the AI Adoption Pace
  • After 60/40: In Private Markets, Manager Selection Matters
  • Equity Market Trading Volumes Rising

Recent Comments

No comments to show.

Archives

  • March 2026
  • February 2026
  • January 2026
  • December 2025
  • November 2025
  • October 2025
  • September 2025
  • August 2025
  • July 2025
  • June 2025
  • May 2025
  • April 2025
  • March 2025
  • February 2025
  • January 2025
  • December 2024
  • November 2024
  • October 2024
  • September 2024
  • August 2024
  • July 2024
  • June 2024
  • May 2024
  • April 2024
  • March 2024
  • February 2024
  • January 2024
  • December 2023
  • November 2023
  • October 2023
  • September 2023
  • August 2023
  • July 2023
  • June 2023
  • May 2023
  • April 2023
  • March 2023
  • February 2023
  • January 2023
  • December 2022
  • November 2022
  • October 2022
  • September 2022
  • August 2022
  • July 2022
  • June 2022
  • May 2022
  • April 2022
  • March 2022
  • February 2022
  • January 2022
  • December 2021
  • November 2021

Categories

  • Apollo Answers
  • Course Introductions
  • Economic Intelligence
  • Hide from Wordpress Search
  • Investment Knowledge
  • Perspectives
  • Redirecting
  • The Daily Spark
  • The View from Apollo
  • The Weekly Brief
  • Uncategorized
  • White Papers

The Impact of Tariffs on the US Economy

The table below shows our estimates of the impact on US GDP and inflation of tariffs and the decline in consumer sentiment and corporate sentiment.

Whether we will have a recession or not depends on the duration of this shock. If these levels of tariffs stay in place for several months and other countries retaliate, it will cause a recession in the US and the rest of the world.

We will be discussing the outlook for the economy and markets on a conference call today at 9 am EDT, you can register here.

Estimated impact of tariffs and negative sentiment on US GDP and inflation
Note: Includes Chinese tariffs from February and March, Canada and Mexico non-USMCA compliant goods tariffs from March, Steel, Aluminum and Auto imports and reciprocal tariffs on all countries announced in April. Source: Apollo Chief Economist

Download high-res chart

Recent Posts

  • Strong Net Foreign Buying of US Assets
  • Average Tenure of Companies in the S&P 500 Index: 15 Years
  • Fed Pricing Reveals Market Expectations About the AI Adoption Pace
  • After 60/40: In Private Markets, Manager Selection Matters
  • Equity Market Trading Volumes Rising

Recent Comments

No comments to show.

Archives

  • March 2026
  • February 2026
  • January 2026
  • December 2025
  • November 2025
  • October 2025
  • September 2025
  • August 2025
  • July 2025
  • June 2025
  • May 2025
  • April 2025
  • March 2025
  • February 2025
  • January 2025
  • December 2024
  • November 2024
  • October 2024
  • September 2024
  • August 2024
  • July 2024
  • June 2024
  • May 2024
  • April 2024
  • March 2024
  • February 2024
  • January 2024
  • December 2023
  • November 2023
  • October 2023
  • September 2023
  • August 2023
  • July 2023
  • June 2023
  • May 2023
  • April 2023
  • March 2023
  • February 2023
  • January 2023
  • December 2022
  • November 2022
  • October 2022
  • September 2022
  • August 2022
  • July 2022
  • June 2022
  • May 2022
  • April 2022
  • March 2022
  • February 2022
  • January 2022
  • December 2021
  • November 2021

Categories

  • Apollo Answers
  • Course Introductions
  • Economic Intelligence
  • Hide from Wordpress Search
  • Investment Knowledge
  • Perspectives
  • Redirecting
  • The Daily Spark
  • The View from Apollo
  • The Weekly Brief
  • Uncategorized
  • White Papers

Higher Policy Uncertainty Having a Negative Impact on Capital Markets

When policy uncertainty went up, capital markets activity started slowing down, with a decline in loan issuance, IPO activity, and M&A activity, see charts below.

When policy uncertainty went up, loan issuance went down
Note: Reflects repricings and extensions done via an amendment process only. Sources: PitchBook LCD, Apollo Chief Economist
When policy uncertainty went up, IPO activity went down
Note: Data shows completed IPO transactions. Sources: S&P Capital IQ, Apollo Chief Economist
When policy uncertainty went up, M&A activity went down
Note: Data shows completed M&A transactions. Sources: S&P Capital IQ, Apollo Chief Economist
IG spreads are disconnected from the economic policy uncertainty index
Sources: Bloomberg, Apollo Chief Economist

Download high-res charts

Recent Posts

  • Strong Net Foreign Buying of US Assets
  • Average Tenure of Companies in the S&P 500 Index: 15 Years
  • Fed Pricing Reveals Market Expectations About the AI Adoption Pace
  • After 60/40: In Private Markets, Manager Selection Matters
  • Equity Market Trading Volumes Rising

Recent Comments

No comments to show.

Archives

  • March 2026
  • February 2026
  • January 2026
  • December 2025
  • November 2025
  • October 2025
  • September 2025
  • August 2025
  • July 2025
  • June 2025
  • May 2025
  • April 2025
  • March 2025
  • February 2025
  • January 2025
  • December 2024
  • November 2024
  • October 2024
  • September 2024
  • August 2024
  • July 2024
  • June 2024
  • May 2024
  • April 2024
  • March 2024
  • February 2024
  • January 2024
  • December 2023
  • November 2023
  • October 2023
  • September 2023
  • August 2023
  • July 2023
  • June 2023
  • May 2023
  • April 2023
  • March 2023
  • February 2023
  • January 2023
  • December 2022
  • November 2022
  • October 2022
  • September 2022
  • August 2022
  • July 2022
  • June 2022
  • May 2022
  • April 2022
  • March 2022
  • February 2022
  • January 2022
  • December 2021
  • November 2021

Categories

  • Apollo Answers
  • Course Introductions
  • Economic Intelligence
  • Hide from Wordpress Search
  • Investment Knowledge
  • Perspectives
  • Redirecting
  • The Daily Spark
  • The View from Apollo
  • The Weekly Brief
  • Uncategorized
  • White Papers

Corporate Confidence Declining

Surveys of CEOs and CFOs show that corporate confidence has declined in recent months, see charts below.

CEO confidence declining
Sources: Chief Executive Magazine, Bloomberg, Macrobond, Apollo Chief Economist
CFO confidence declining
Sources: Duke University & FRB Richmond & FRB Atlanta, Macrobond, Apollo Chief Economist

Download high-res charts

Recent Posts

  • Strong Net Foreign Buying of US Assets
  • Average Tenure of Companies in the S&P 500 Index: 15 Years
  • Fed Pricing Reveals Market Expectations About the AI Adoption Pace
  • After 60/40: In Private Markets, Manager Selection Matters
  • Equity Market Trading Volumes Rising

Recent Comments

No comments to show.

Archives

  • March 2026
  • February 2026
  • January 2026
  • December 2025
  • November 2025
  • October 2025
  • September 2025
  • August 2025
  • July 2025
  • June 2025
  • May 2025
  • April 2025
  • March 2025
  • February 2025
  • January 2025
  • December 2024
  • November 2024
  • October 2024
  • September 2024
  • August 2024
  • July 2024
  • June 2024
  • May 2024
  • April 2024
  • March 2024
  • February 2024
  • January 2024
  • December 2023
  • November 2023
  • October 2023
  • September 2023
  • August 2023
  • July 2023
  • June 2023
  • May 2023
  • April 2023
  • March 2023
  • February 2023
  • January 2023
  • December 2022
  • November 2022
  • October 2022
  • September 2022
  • August 2022
  • July 2022
  • June 2022
  • May 2022
  • April 2022
  • March 2022
  • February 2022
  • January 2022
  • December 2021
  • November 2021

Categories

  • Apollo Answers
  • Course Introductions
  • Economic Intelligence
  • Hide from Wordpress Search
  • Investment Knowledge
  • Perspectives
  • Redirecting
  • The Daily Spark
  • The View from Apollo
  • The Weekly Brief
  • Uncategorized
  • White Papers

Posts navigation

←Previous page Page 1 Page 2 Page 3 Page 4 Next page→
  • Privacy Notice
  • Terms of Use
  • Forward-Looking Statements
Apollo
© Apollo Global Management, Inc. All Rights Reserved.

The Apollo Academy is for informational and educational purposes only and nothing contained herein should be taken as investment advice or a recommendation to enter into any transaction. They are not an invitation by or on behalf of Apollo to any person to buy or sell any security or to adopt any investment strategy, and shall not form the basis of, nor may it accompany nor form part of, any right or contract to buy or sell any security or to adopt any investment strategy. There is no guarantee that the views and opinions expressed in this website will come to pass. For additional information, please see the disclaimers included in each piece of content or the legal page of our website here.