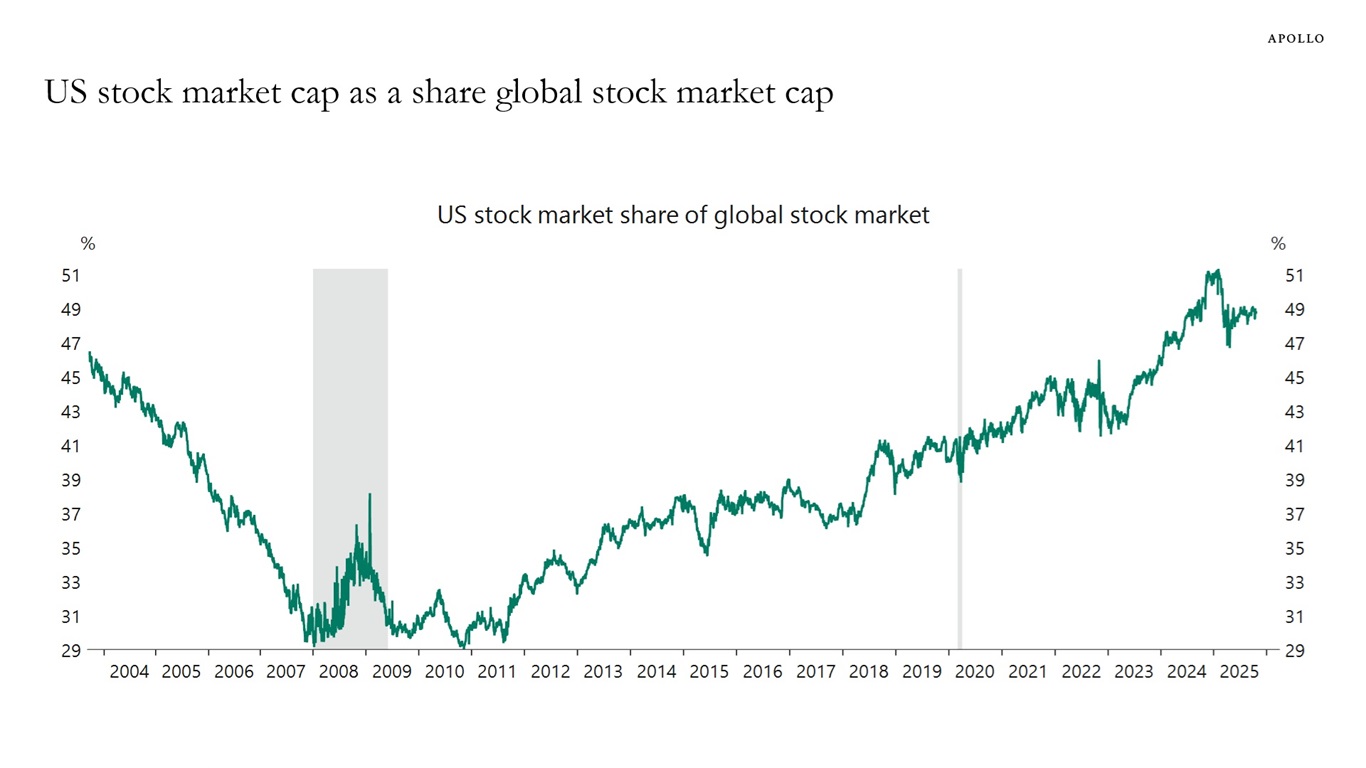
In 2011, the US stock market made up 30% of the global stock market capitalization. Today, the US makes up almost 50%, see chart below. The United States continues to offer exceptional opportunities for investors.


In 2011, the US stock market made up 30% of the global stock market capitalization. Today, the US makes up almost 50%, see chart below. The United States continues to offer exceptional opportunities for investors.
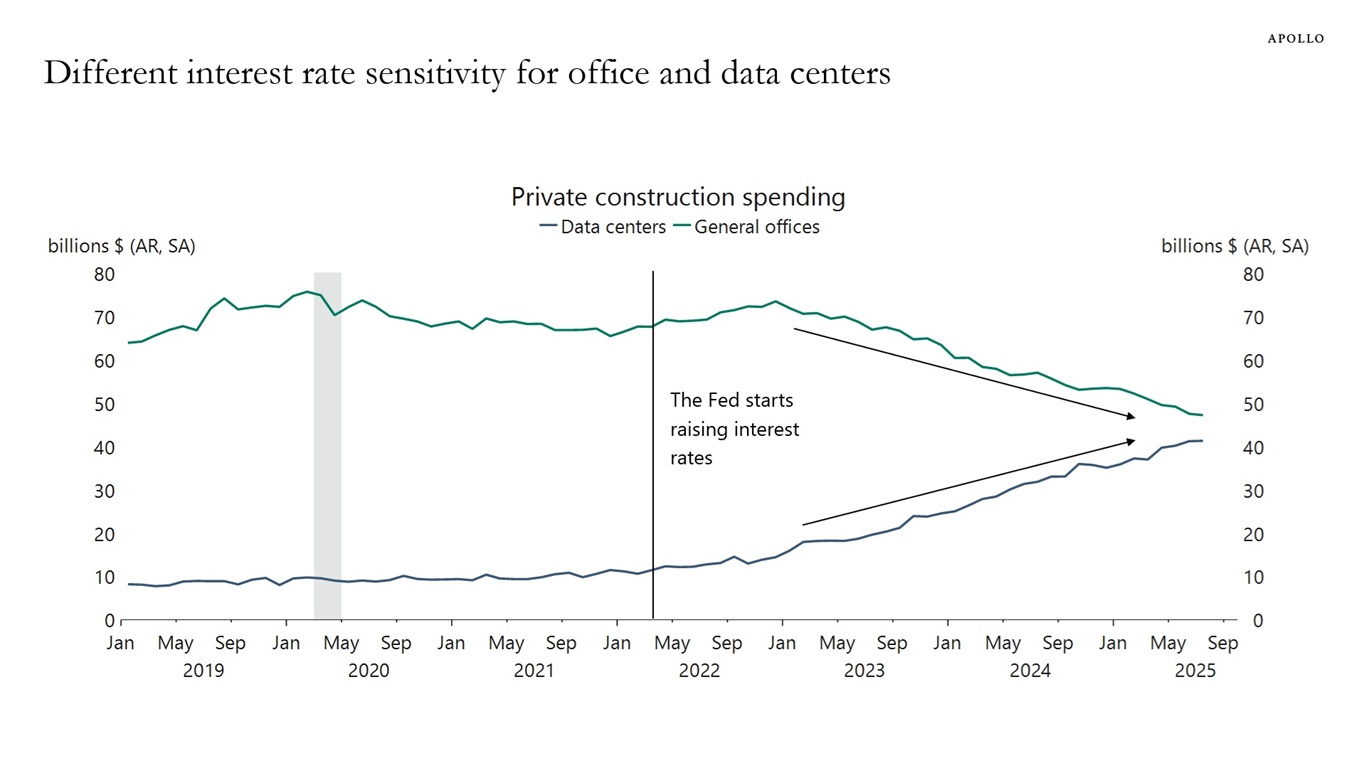
Normally, when the Fed raises interest rates, capex spending goes down.
Since the Fed raised rates in 2022, this has happened for office but not for data centers because data center financings and the AI boom are ultimately financed by the rise in equity prices of the Magnificent Seven, see the first chart below.
As a result, the transmission mechanism for monetary policy has been broken for data centers, and Fed hikes have not slowed down the AI boom.
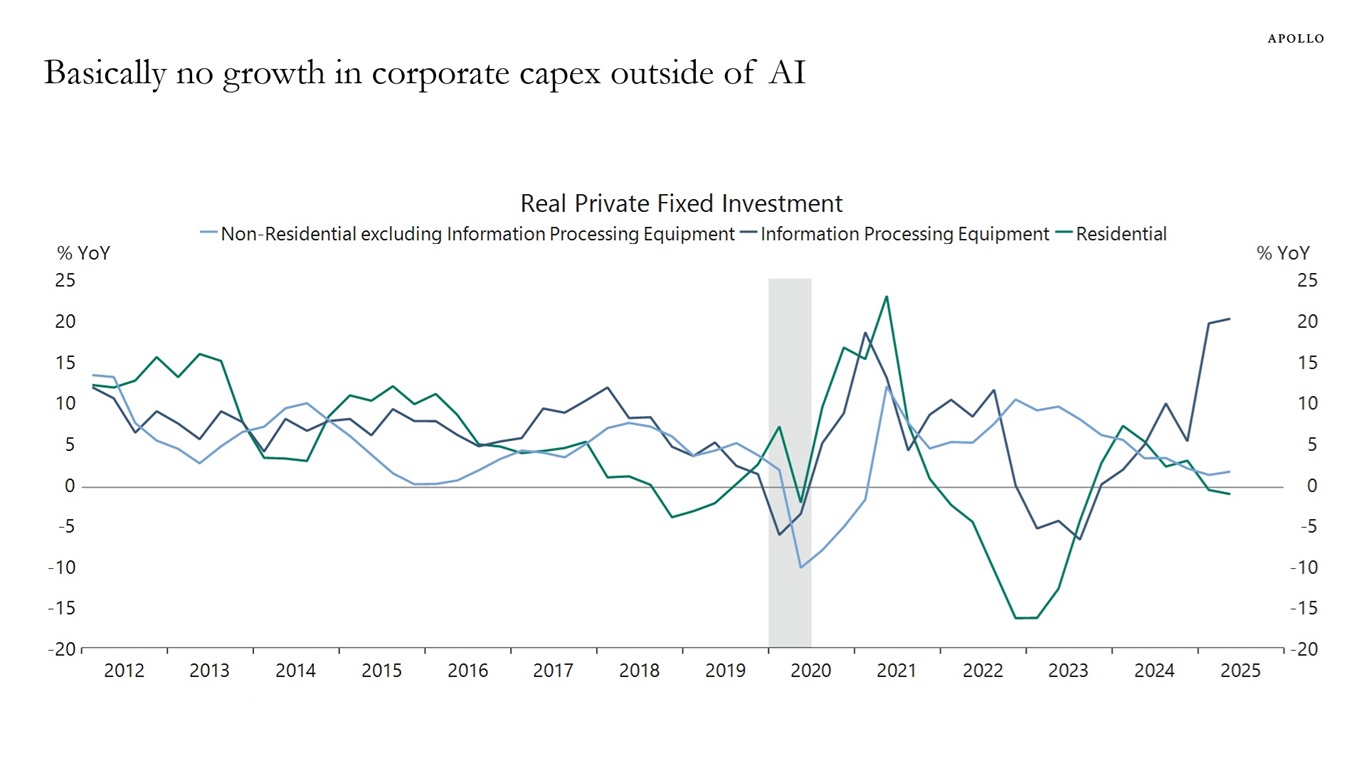
In other words, what matters for capex decisions are broader financial conditions and not just the Fed funds rate, see also here. That is the reason why there is basically no growth in corporate capex outside of AI at the moment, see the second chart below.
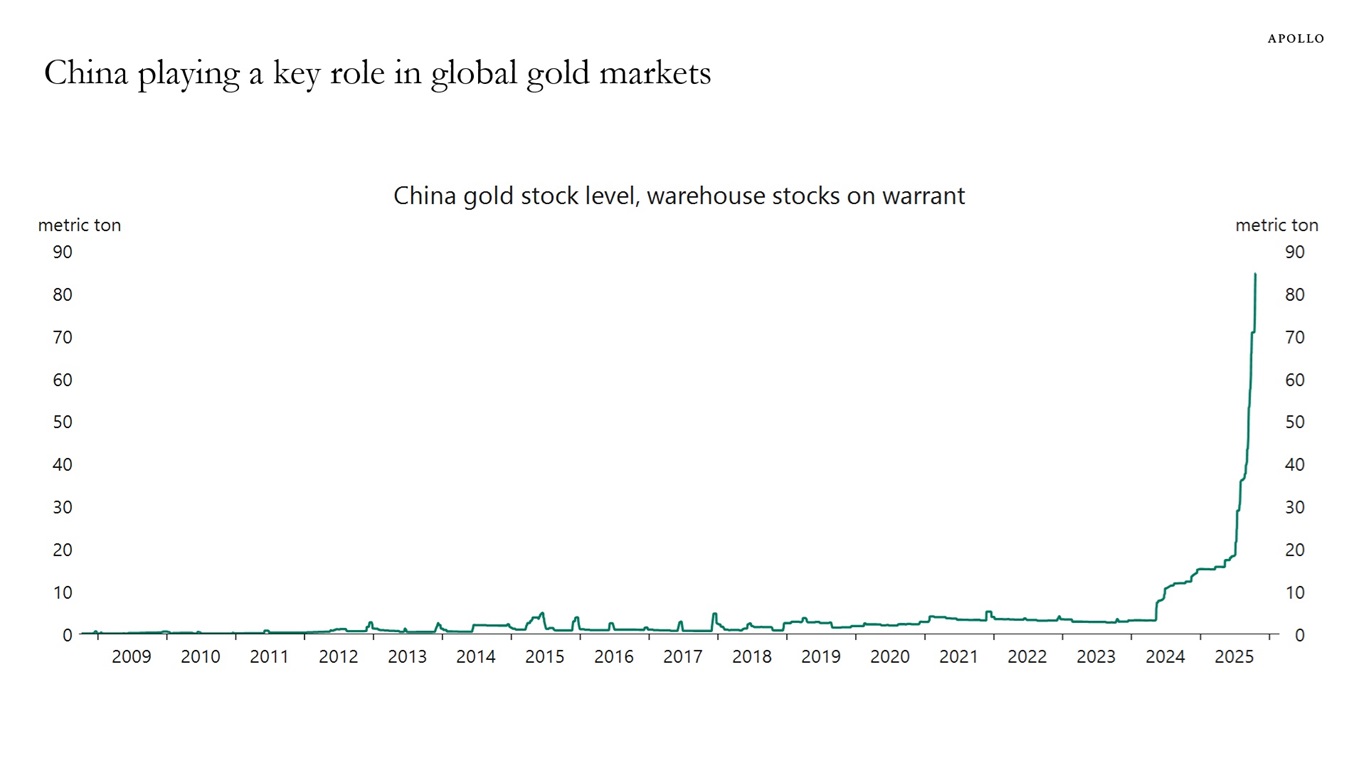
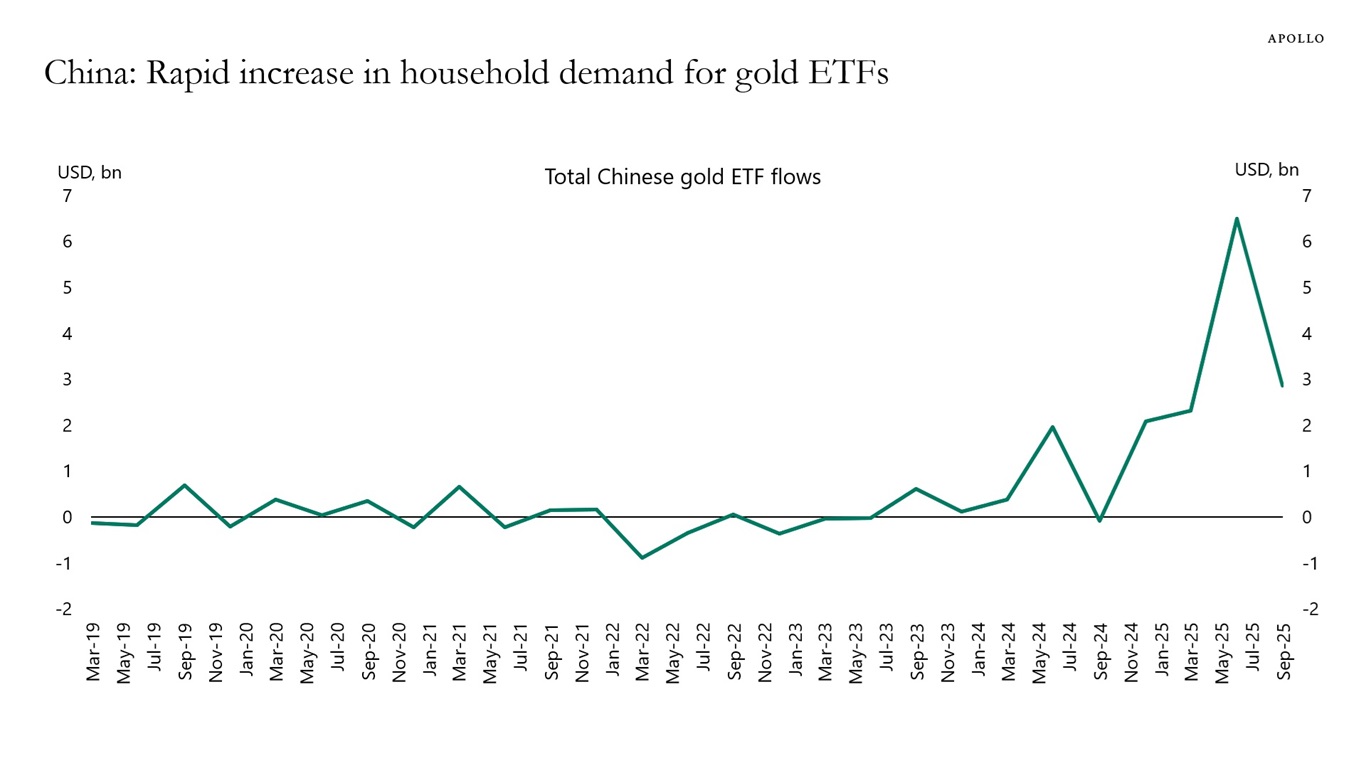
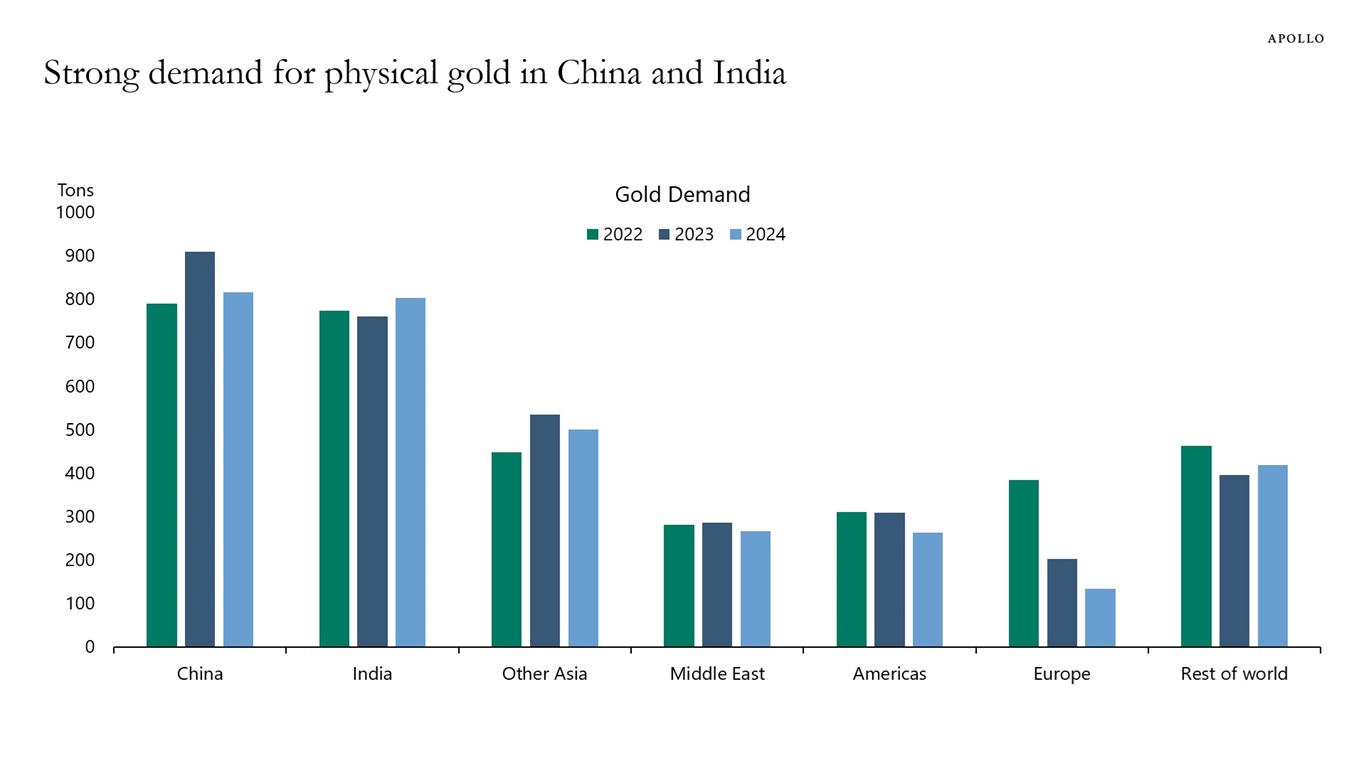
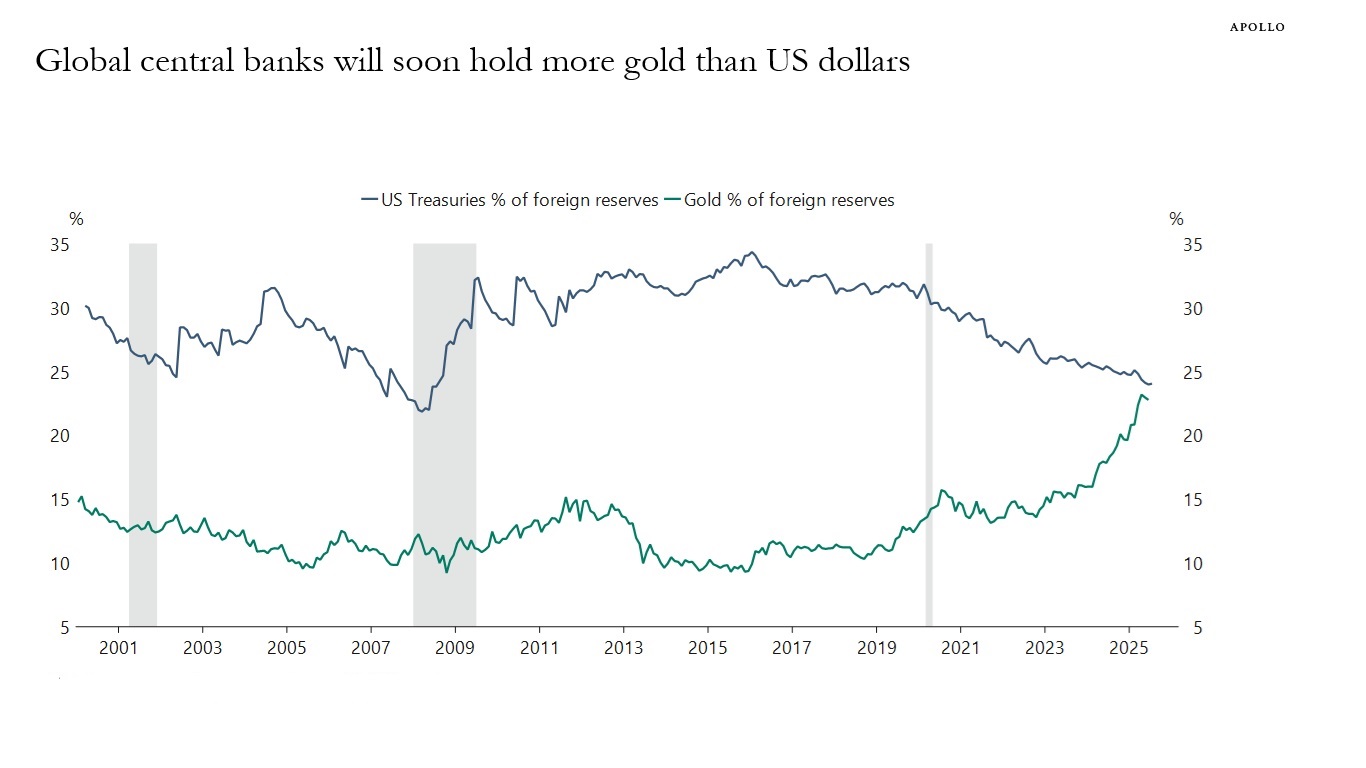
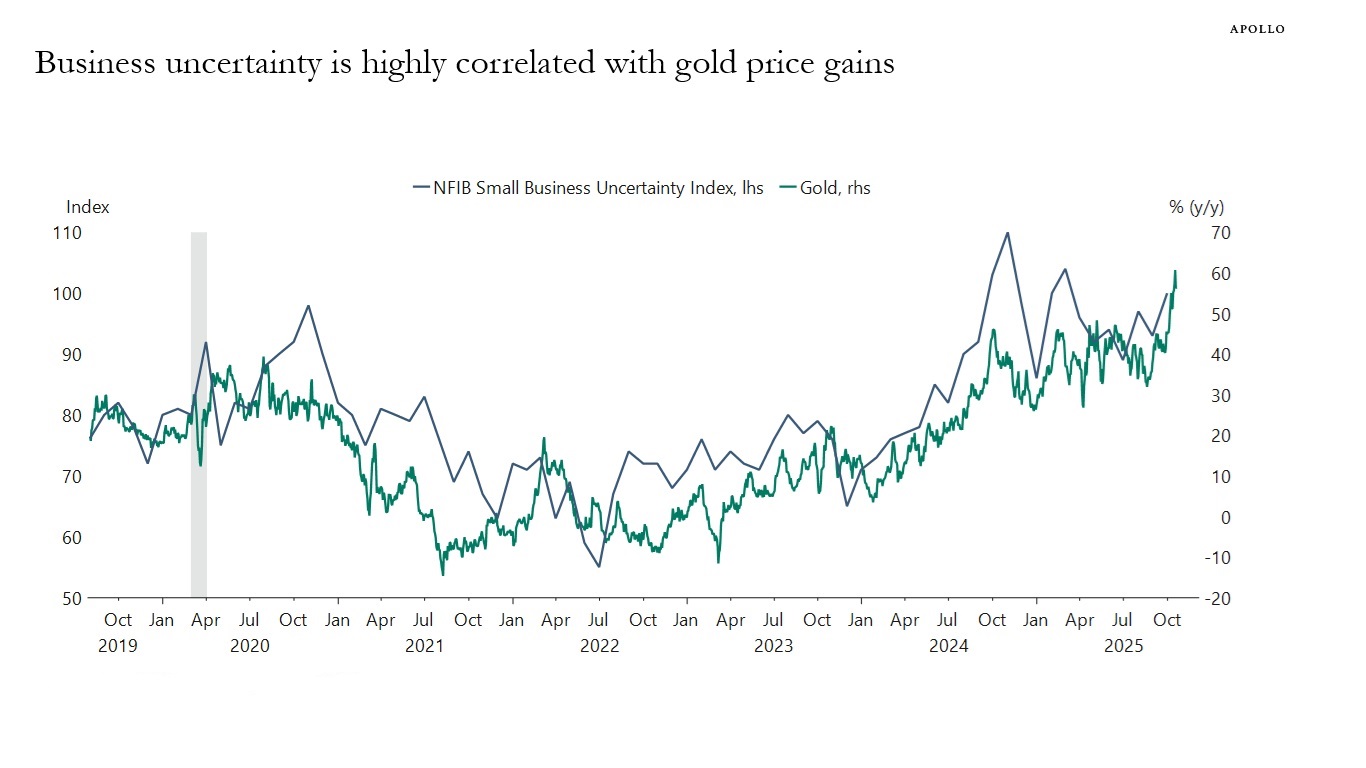
China is playing a key role in the ongoing rise in gold prices because of central bank buying, arbitrage trading, and increased speculative and safe-haven demand among Chinese households, see the first four charts below. The fifth chart shows that higher business uncertainty in the US is also pushing gold prices up.
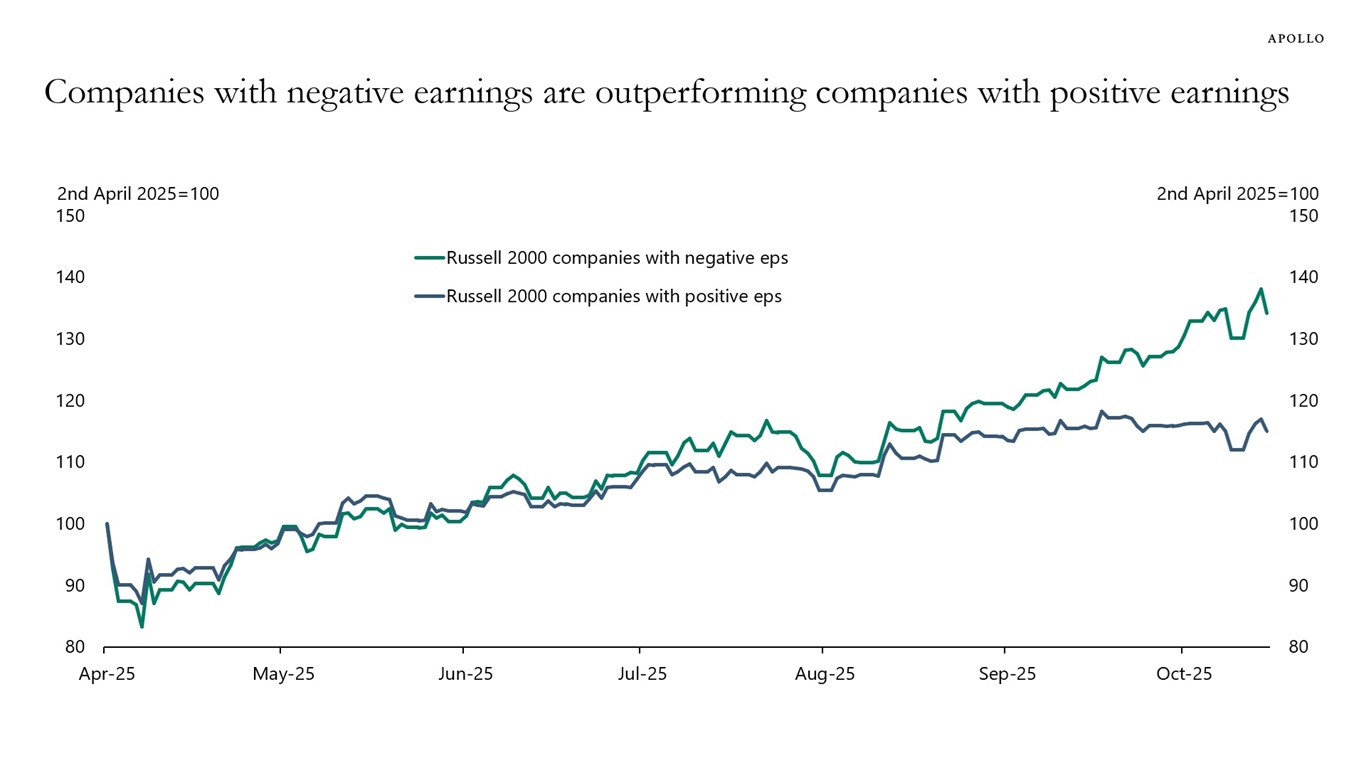
Something remarkable is going on in the equity market. Stock prices of companies with negative earnings have in recent months outperformed stock prices of companies with positive earnings, see chart below.
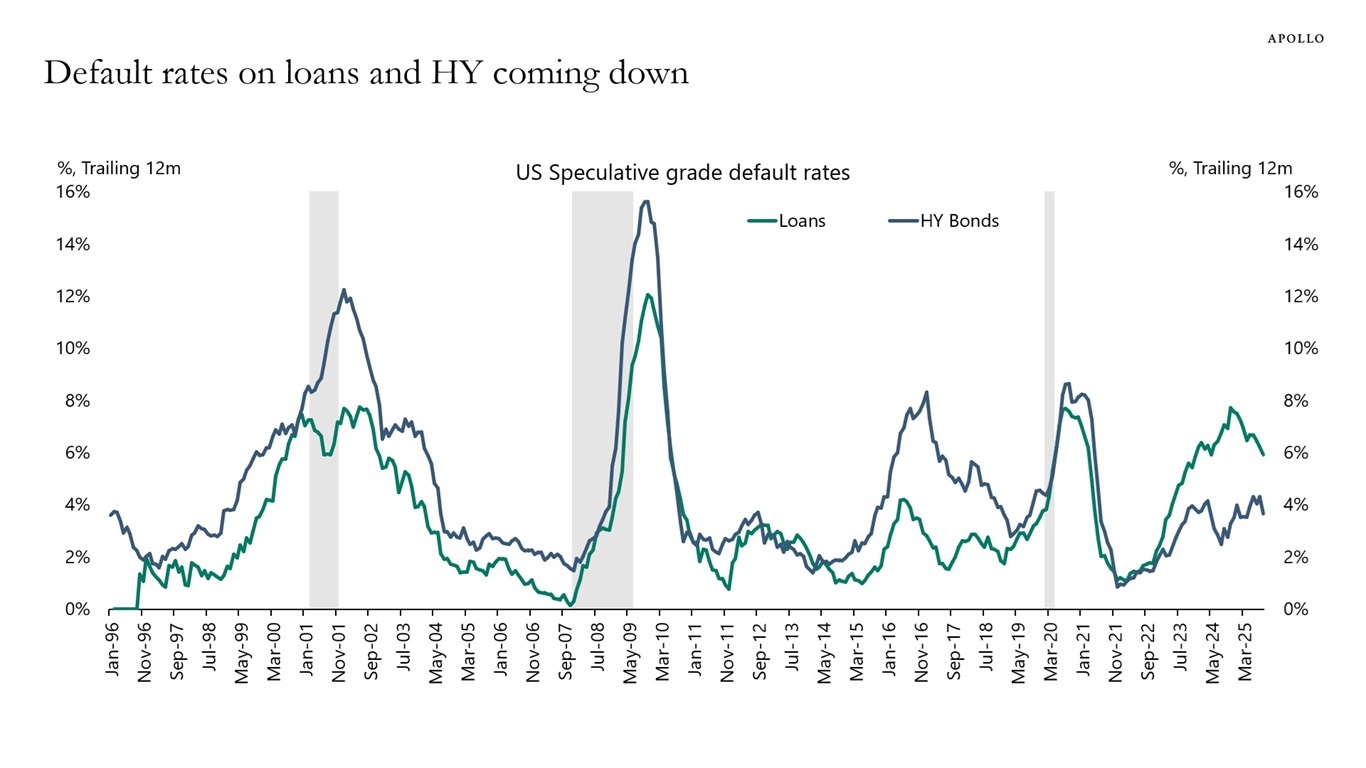
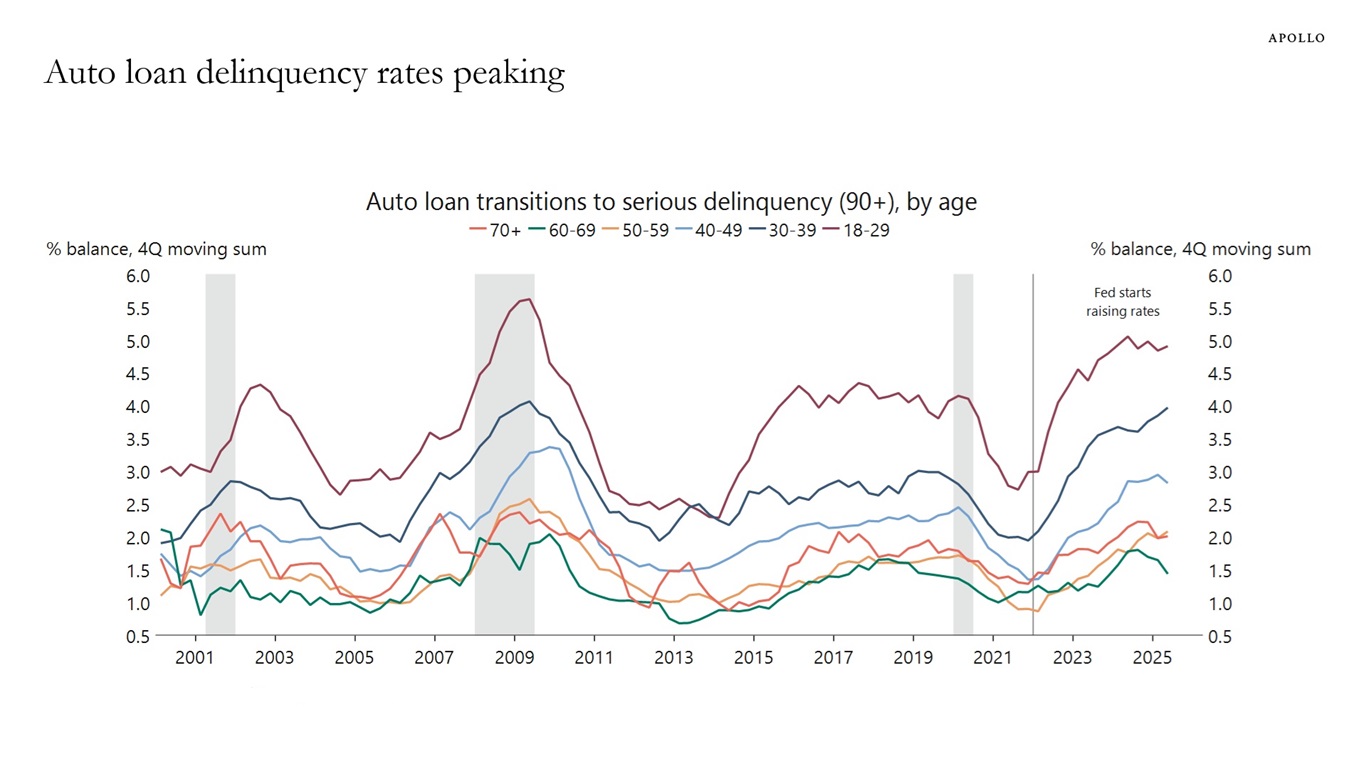
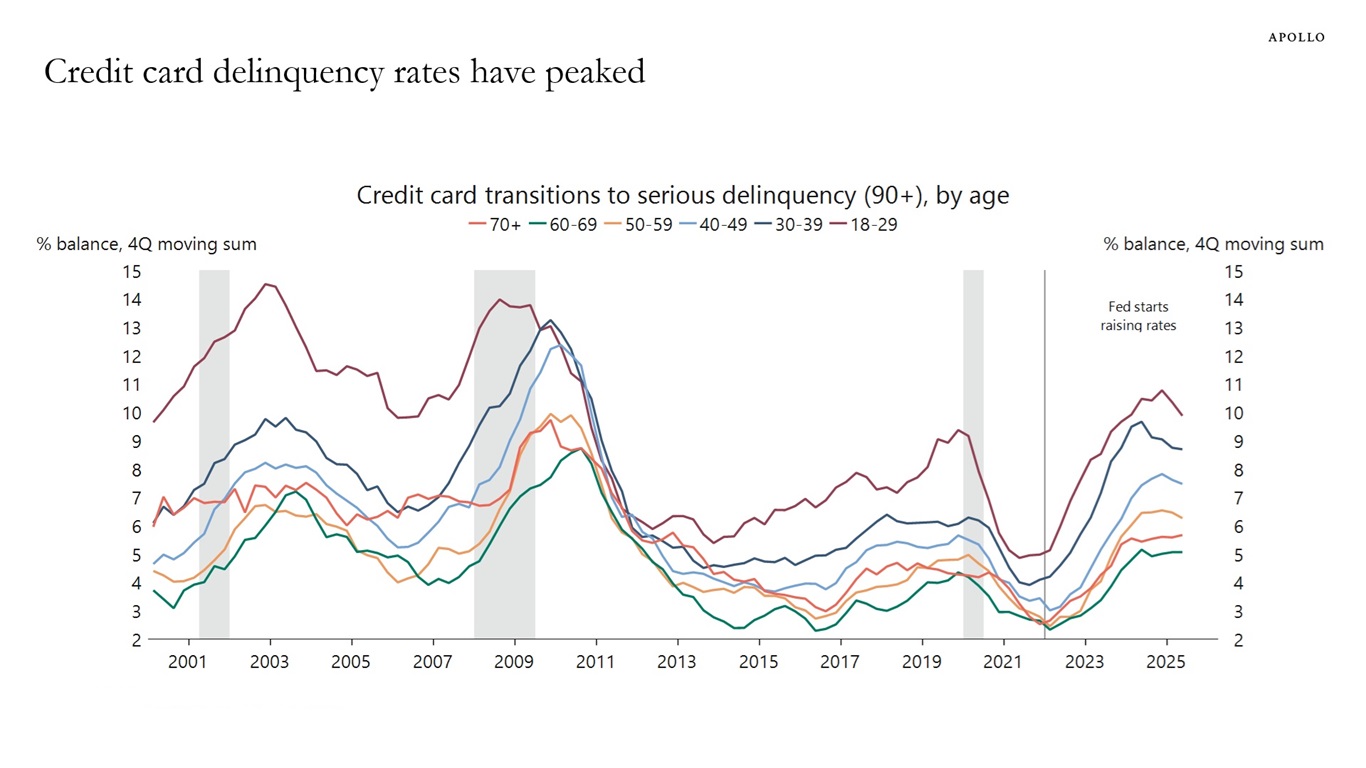
Contrary to widespread fears about the economic outlook, key credit indicators are turning more bullish. Default rates for high yield debt and loans have peaked, along with delinquency rates for auto loans and credit cards, see charts below.
Three factors explain why corporate default and consumer delinquency rates are moving lower:
1) Uncertainty related to the trade war is significantly lower than its peak during Liberation Day.
2) The ongoing AI boom is boosting the buildout of data centers and related energy infrastructure. Simultaneously, higher stock prices are supporting consumer spending.
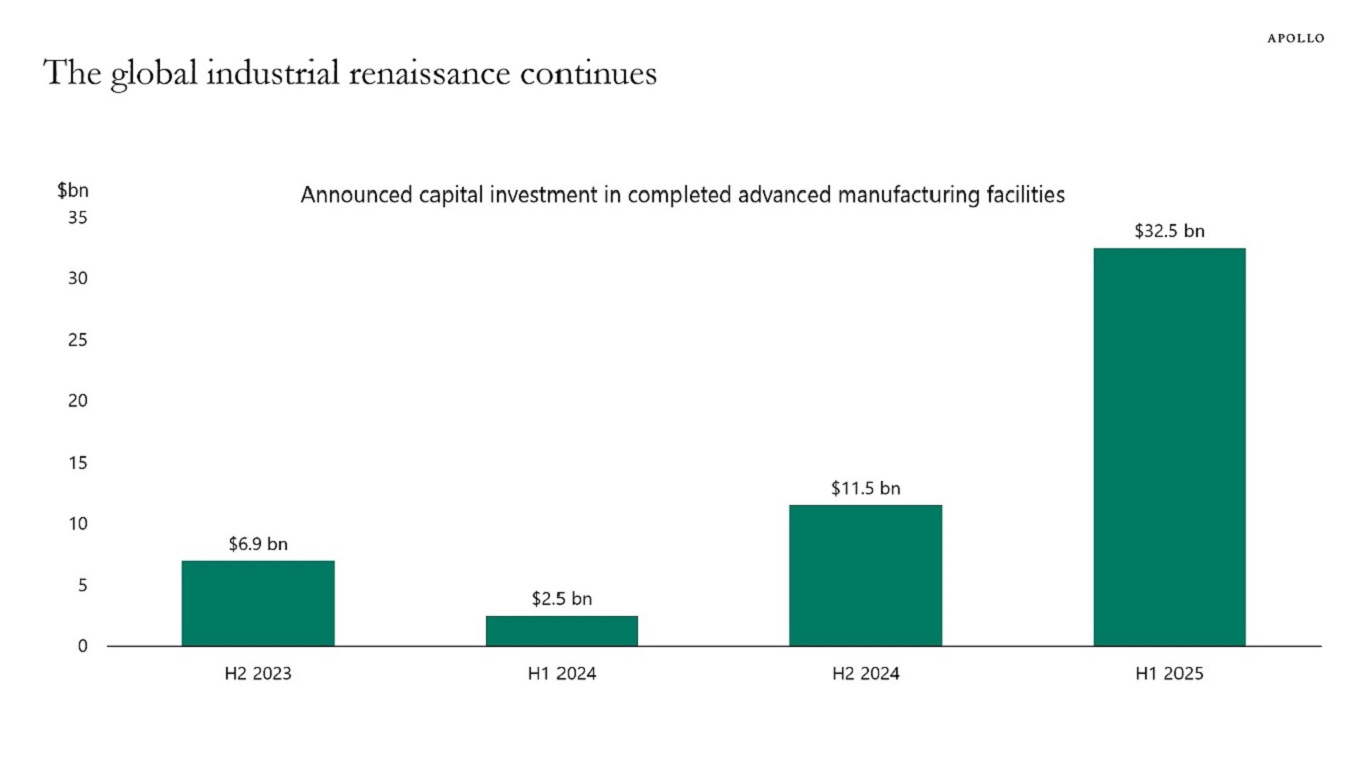
3) Investors are increasingly recognizing that we are in the early stages of an industrial renaissance across sectors like aerospace, defense, manufacturing, biotech and technology/automation.
In summary, while the trade war remains a mild drag on growth, its impact is being more than offset by the tailwinds from the AI boom and the industrial renaissance. Consequently, there is a growing upside risk that economic growth will reaccelerate over the coming quarters.
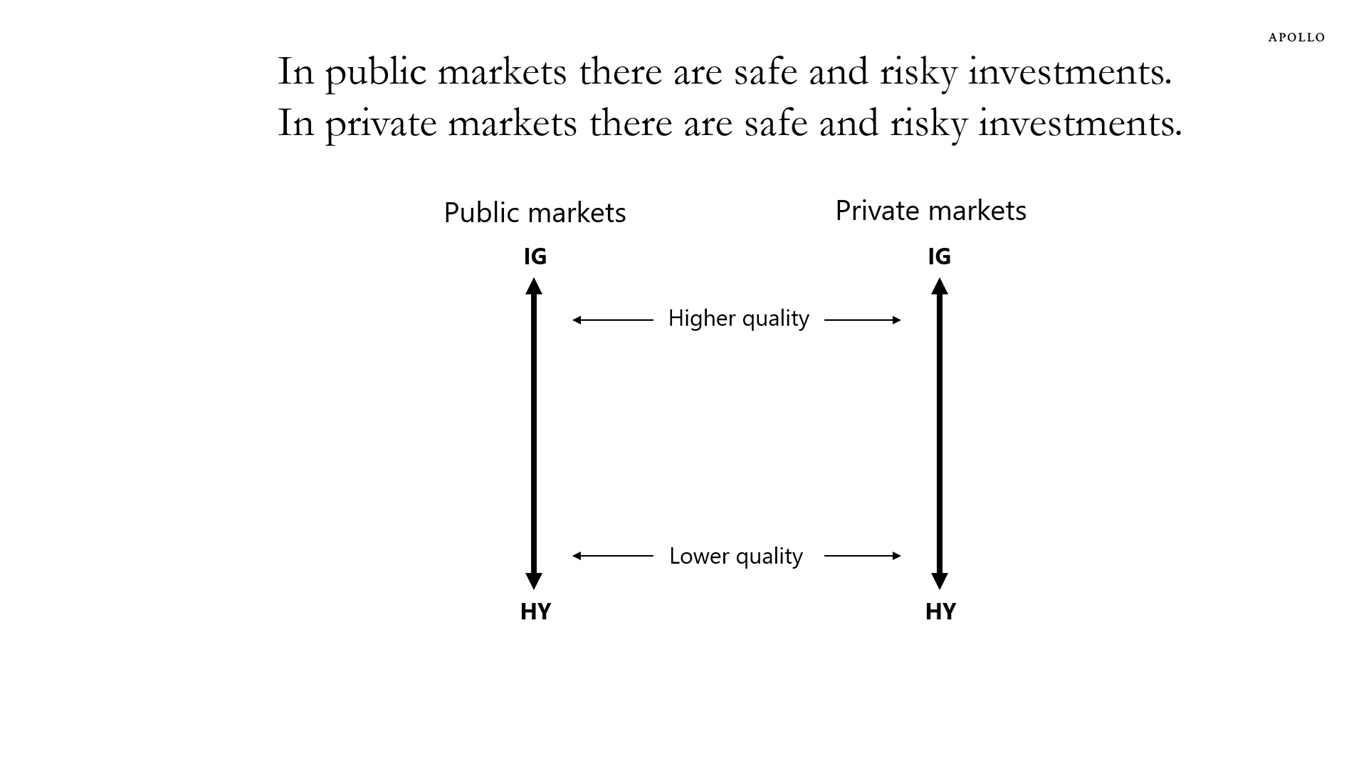
Investing in companies with no earnings, no revenue or no cash flow is risky in both public and private markets.
Put differently, you can invest in investment grade and high yield credit in both public and private markets.
The bottom line is that investors are starting to appreciate that in public markets there are safe and risky investments, and in private markets there are safe and risky investments, see chart below.
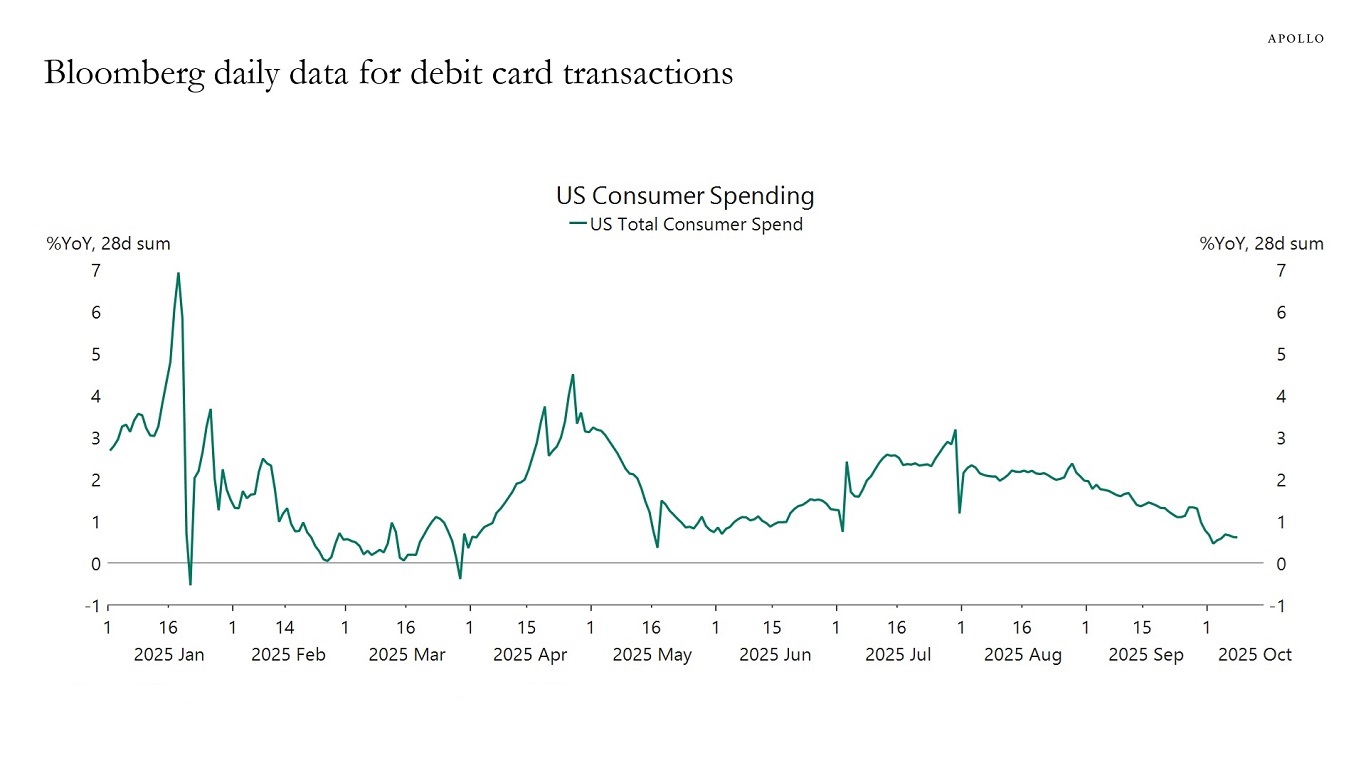
To gauge the health of the US consumer, we typically examine the monthly data on retail sales from the Census Bureau and the personal consumption expenditures from the BEA. But with the shutdown continuing, we are not getting this government data at the moment.
Instead, we have to look at alternative data from the private sector. Unfortunately, the alternative data is not sending a consistent message about the US consumer.
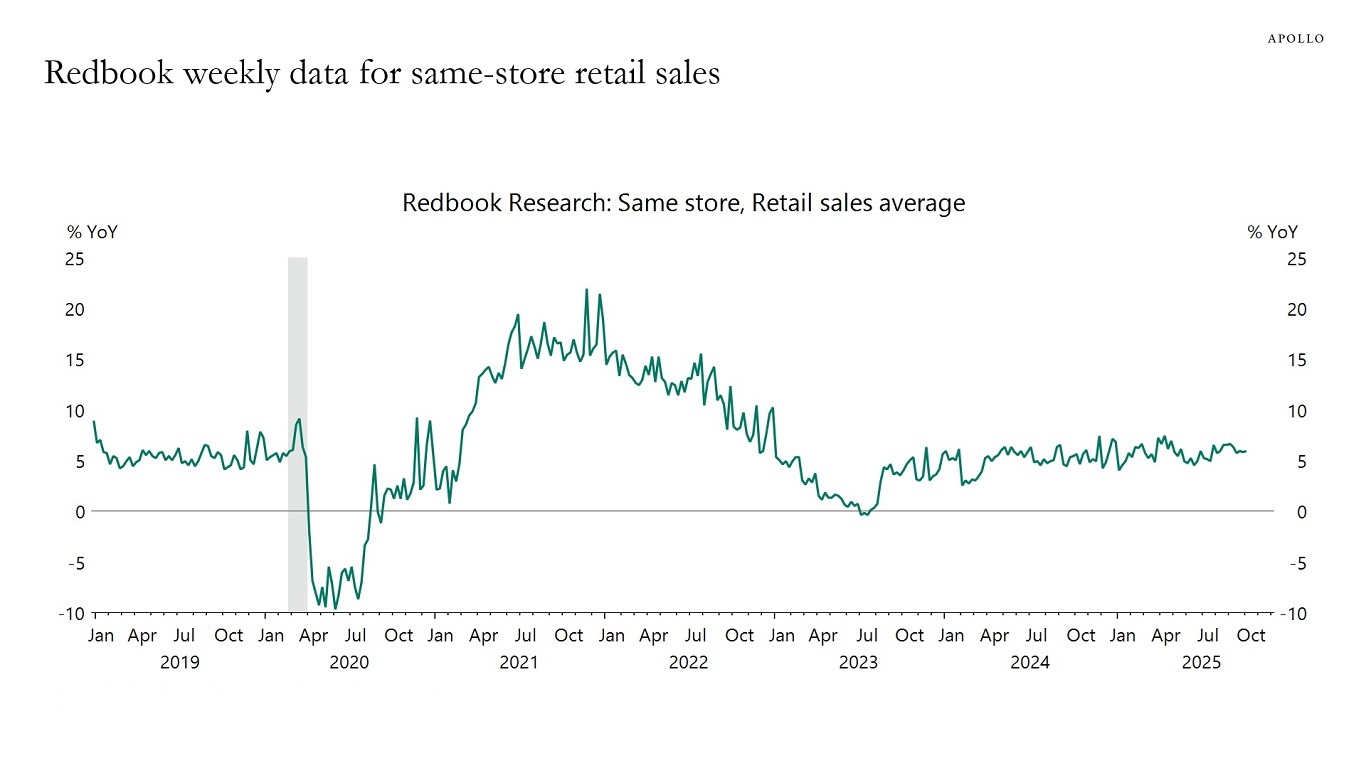
The daily data for debit and credit card spending from Bloomberg shows a slowdown in recent weeks, see the first chart below. This is in contrast to the Redbook weekly same-store retail sales, which show continued strength, see the second chart.
We are monitoring this divergence closely.
Our updated chart book with private sector data for consumer spending, the labor market, inflation, housing, production and consumer sentiment is available here.
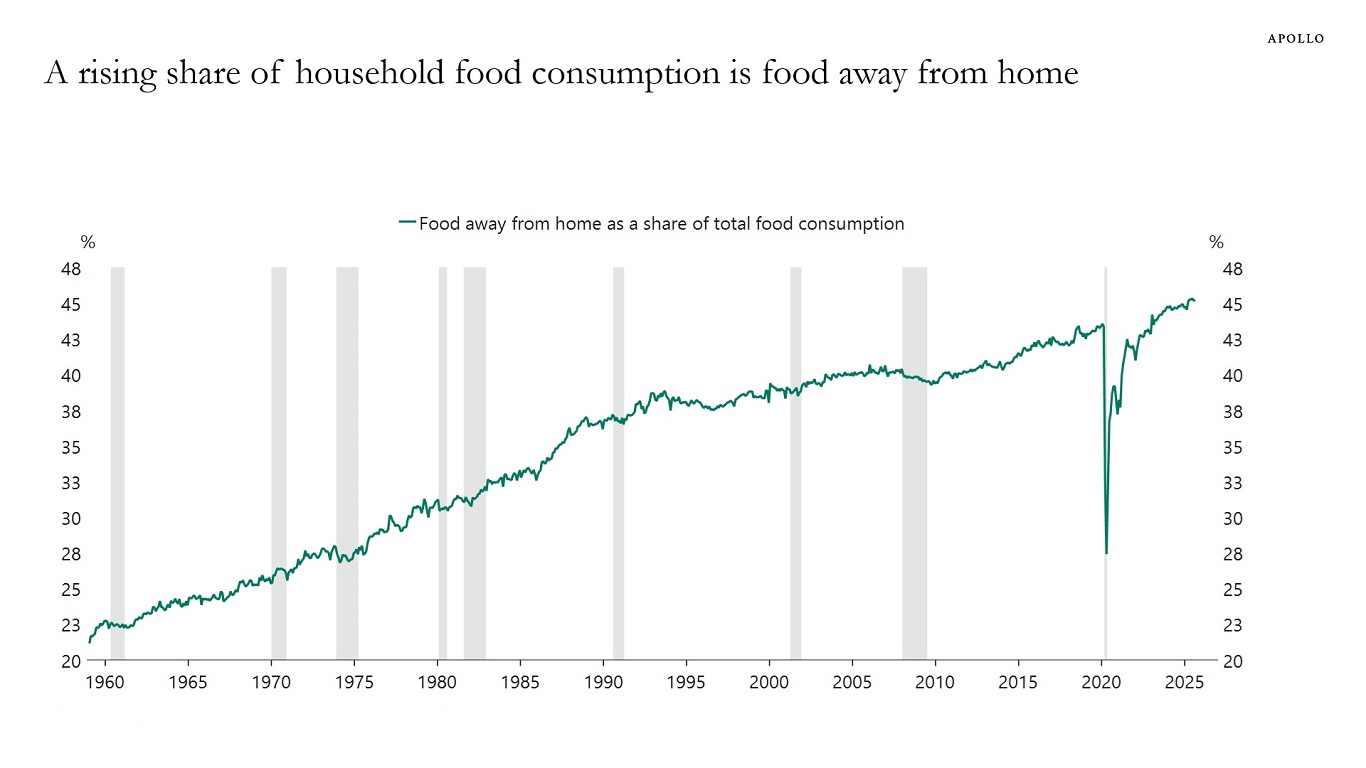
Households now spend almost as much on restaurants, takeout and delivery as on groceries eaten at home.
The US manufacturing cycle is gaining traction. With nearly 200 factory completions since mid-2023 and a $590 billion pipeline led by $5 billion-plus megaprojects, advanced manufacturing is set to be a durable growth engine for the US economy with positive spillovers to industrial real estate, private credit and nationwide employment, see chart below.
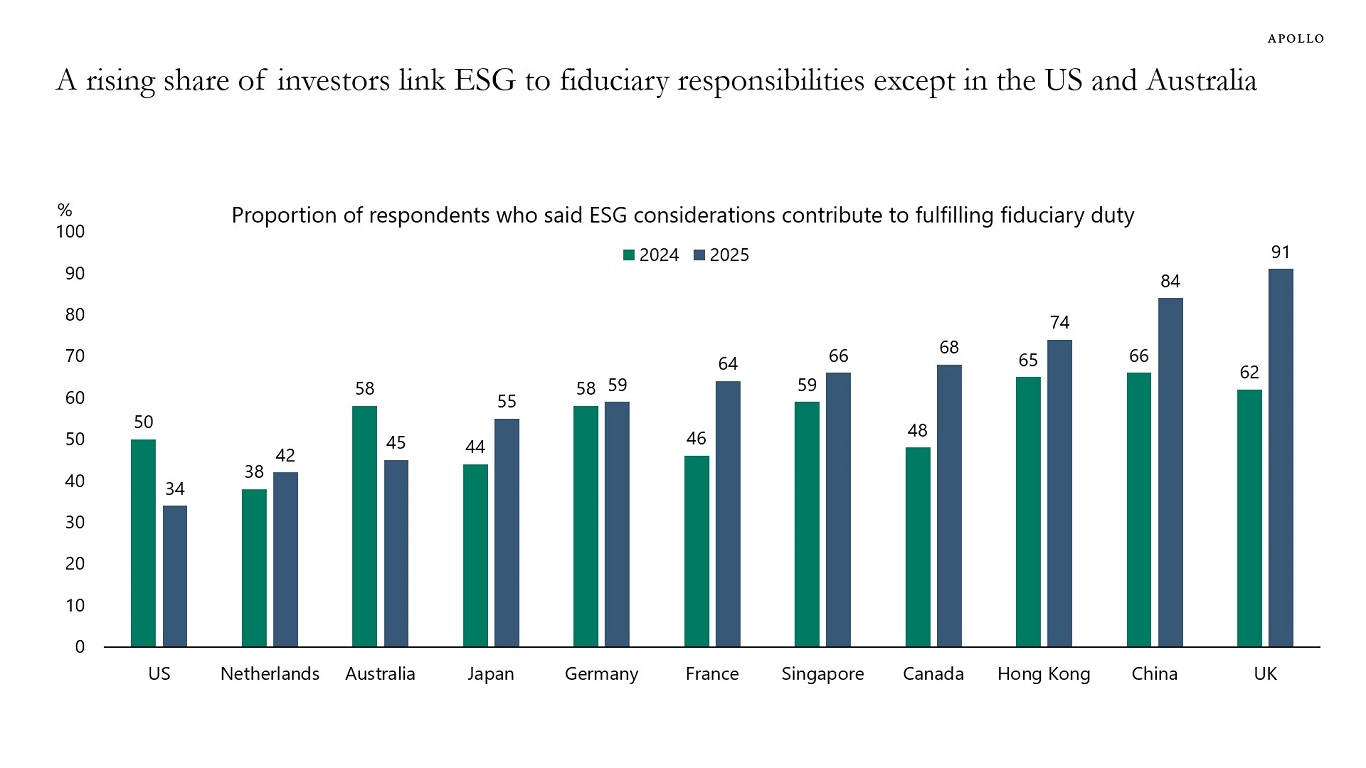
According to a recent Morningstar survey, the proportion of investors who view ESG as part of their fiduciary duty has increased in most surveyed countries, with notable declines in the US and Australia, see chart below.